| Param | Original file | Final file |
|---|---|---|
| Filename | modeM0/AS1A07_145T01_9000005370_38192cztM0_level2.fits | modeM0/AS1A07_145T01_9000005370_38192cztM0_level2_quad_clean.evt |
| Size (bytes) | 333,236,160 | 100,307,520 |
| Size | 317.8 MB | 95.7 MB |
| Events in quadrant A | 3,021,323 | 674,285 |
| Events in quadrant B | 2,805,758 | 689,640 |
| Events in quadrant C | 2,892,415 | 654,341 |
| Events in quadrant D | 3,155,301 | 605,921 |
| Mode M9 | |||
|---|---|---|---|
| Quadrant | BADHDUFLAG | Total packets | Discarded packets |
| A | 0 | 13 | 0 |
| B | 0 | 13 | 0 |
| C | 0 | 13 | 0 |
| D | 0 | 14 | 0 |
| Mode SS | |||
|---|---|---|---|
| Quadrant | BADHDUFLAG | Total packets | Discarded packets |
| A | 0 | 120 | 0 |
| B | 0 | 120 | 0 |
| C | 0 | 120 | 0 |
| D | 0 | 120 | 0 |
| Mode M0 | |||
|---|---|---|---|
| Quadrant | BADHDUFLAG | Total packets | Discarded packets |
| A | 0 | 12451 | 3 |
| B | 0 | 12336 | 2 |
| C | 0 | 12265 | 2 |
| D | 0 | 13165 | 2 |
| Quadrant | Total seconds | Saturated seconds | Saturation percentage |
|---|---|---|---|
| A | 5913 | 16 | 0.270590% |
| B | 5913 | 23 | 0.388973% |
| C | 5913 | 10 | 0.169119% |
| D | 5913 | 50 | 0.845594% |
Noise dominated data is calculated using 1-second bins in cleaned event files. If a bin has >2000 counts, and if more than 50% of those come from <1% of pixels, then it is considered to be noise-dominated and hence unusable.
| Quadrant | # 1 sec bins | Bins with >0 counts | Bins with >2000 counts | High rate bins dominated by noise | Noise dominated (total time) | Noise dominated (detector-on time) | Marked lightcurve |
|---|---|---|---|---|---|---|---|
| A | 7226 | 5913 | 6 | 6 | 0.08% | 0.10% | 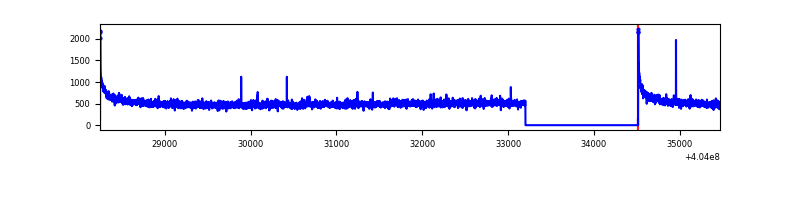 |
| B | 7226 | 5913 | 6 | 6 | 0.08% | 0.10% | 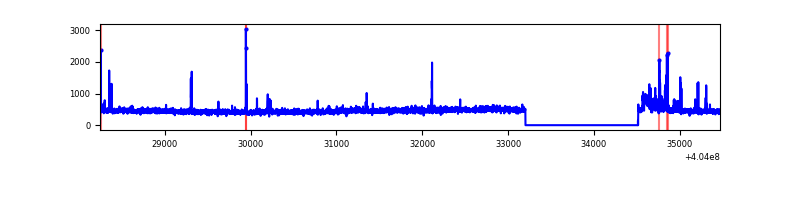 |
| C | 7226 | 5914 | 7 | 7 | 0.10% | 0.12% | 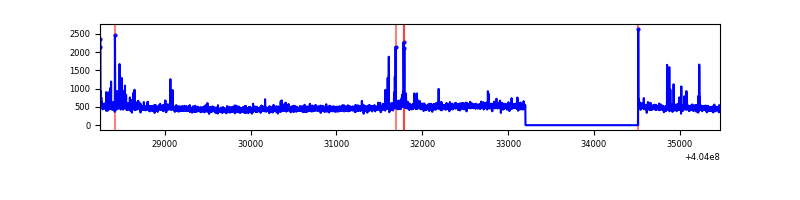 |
| D | 7226 | 5914 | 48 | 48 | 0.66% | 0.81% | 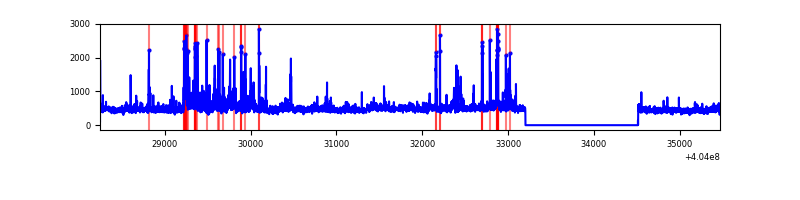 |
Top three noisy pixels from each quadrant. If the there are fewer than three noisy pixels in the level2.evt file, extra rows are filled as -1
| Pixel properties | Quadrant properties | ||||||
|---|---|---|---|---|---|---|---|
| Quadrant | DetID | PixID | Counts | Sigma | Mean | Median | Sigma |
| A | 10 | 83 | 393450 | 2883.71 | 667 | 656 | 136.2 |
| A | 12 | 189 | 30929 | 222.25 | 667 | 656 | 136.2 |
| A | 13 | 254 | 8768 | 59.55 | 667 | 656 | 136.2 |
| B | 5 | 184 | 91683 | 704.84 | 661 | 642 | 129.2 |
| B | 5 | 172 | 54036 | 413.38 | 661 | 642 | 129.2 |
| B | 12 | 111 | 15967 | 118.65 | 661 | 642 | 129.2 |
| C | 15 | 214 | 246574 | 1626.8 | 646 | 650 | 151.2 |
| C | 14 | 254 | 86839 | 570.14 | 646 | 650 | 151.2 |
| C | 0 | 10 | 14543 | 91.9 | 646 | 650 | 151.2 |
| D | 1 | 52 | 241200 | 1530.39 | 650 | 632 | 157.2 |
| D | 13 | 249 | 123948 | 784.48 | 650 | 632 | 157.2 |
| D | 12 | 235 | 79242 | 500.08 | 650 | 632 | 157.2 |
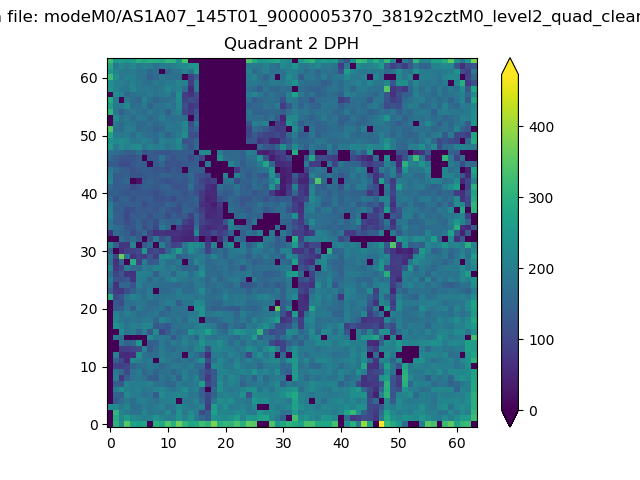
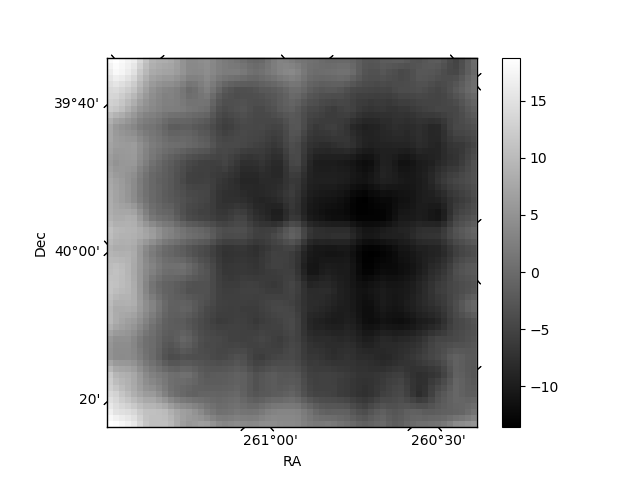
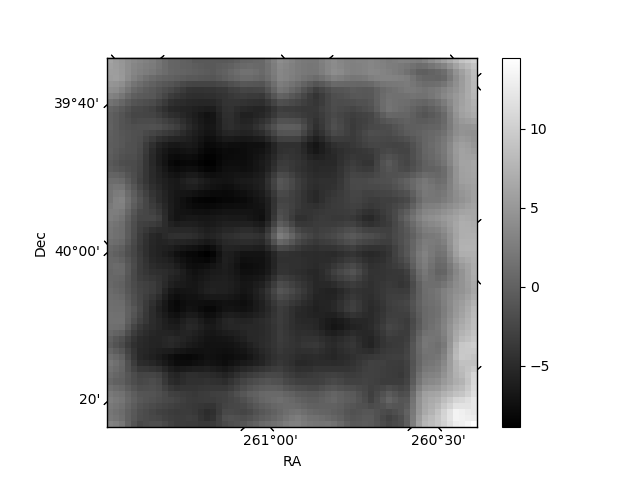
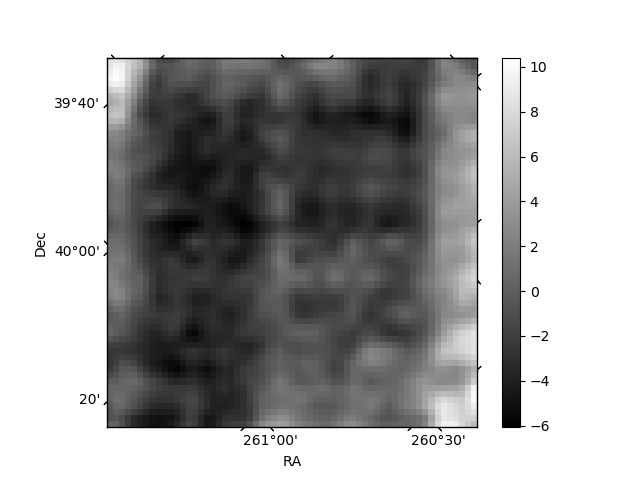
Histogram calculated using DETX and DETY for each event in the final _common_clean file
| Quadrant A | 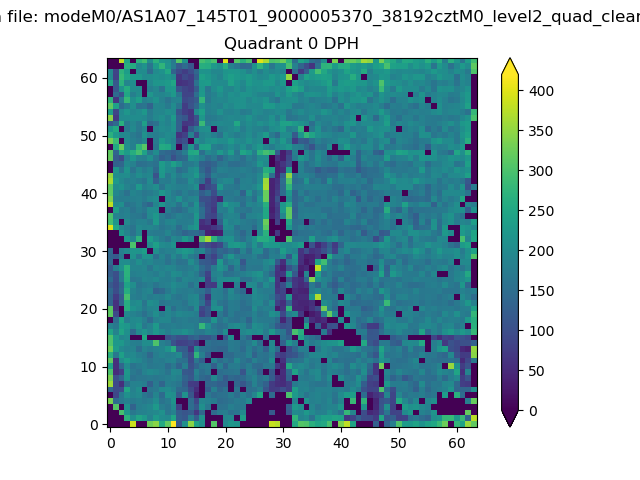 |
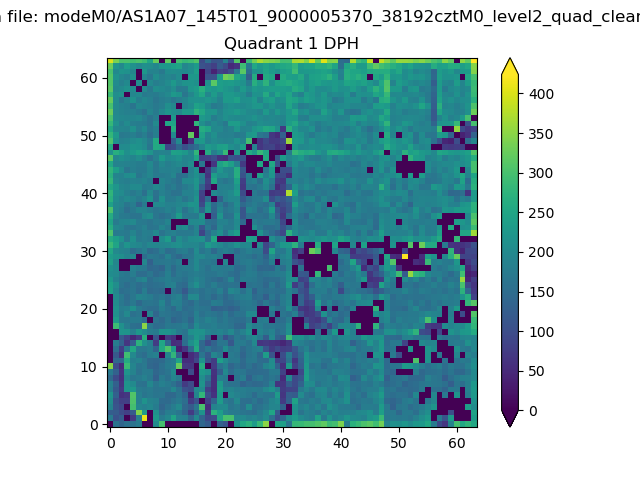 |
Quadrant B |
|---|---|---|---|
| Quadrant D | 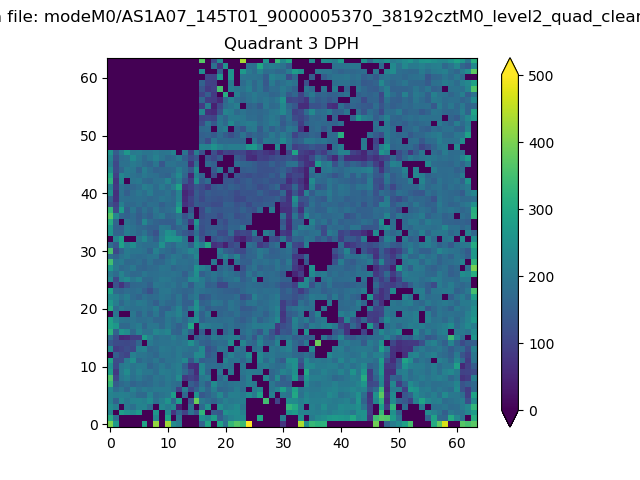 |
 |
Quadrant C |
| Plot type | Count rate plots | Images |
|---|---|---|
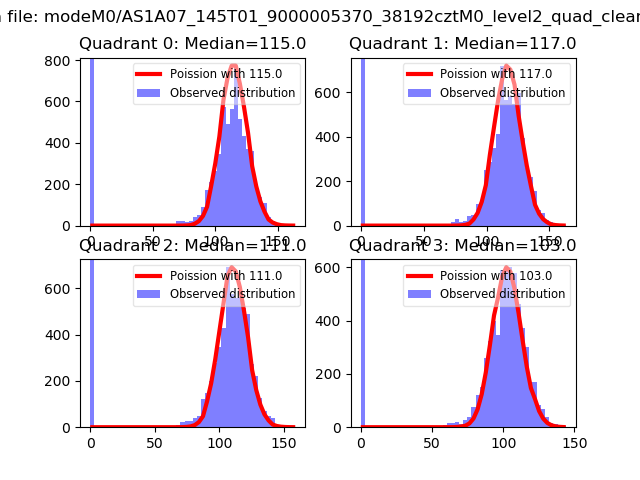
| Comparison with Poisson distribution Blue bars denote a histogram of data divided into 1 sec bins. Red curve is a Poisson curve with rate = median count rate of data. |
 |
 |
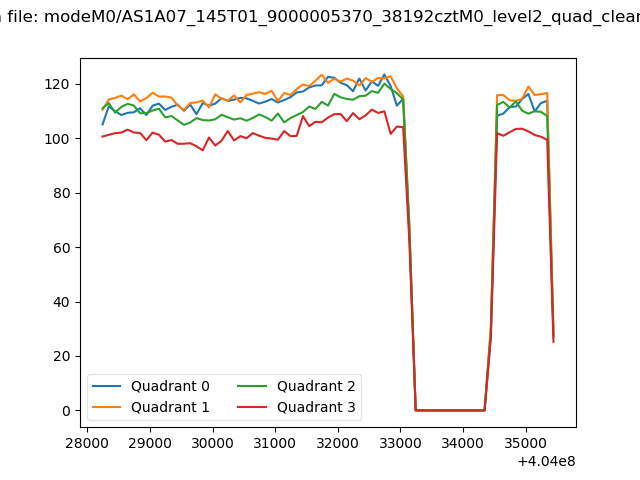
| Quadrant-wise count rates Data is divided into 100 sec bins |
 |
|
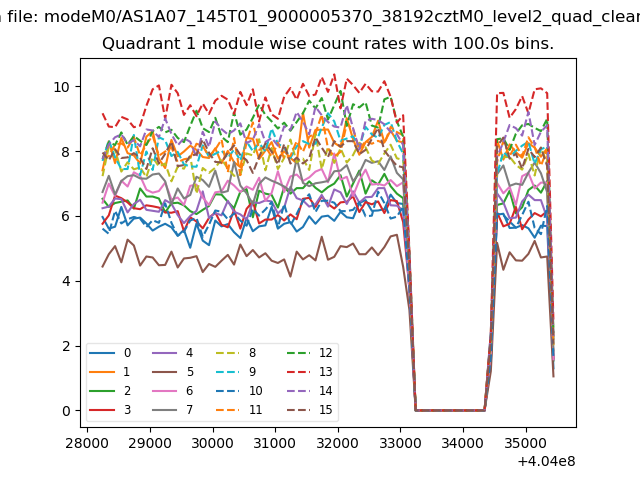
| Module-wise count rates for Quadrant A Data is divided into 100 sec bins |
 |
 |
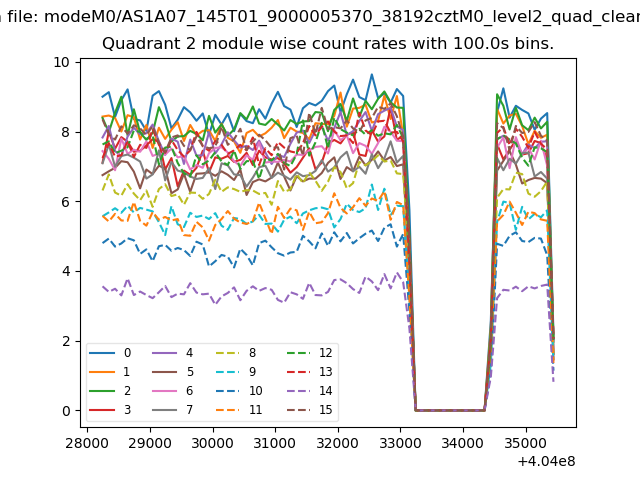
| Module-wise count rates for Quadrant B Data is divided into 100 sec bins |
 |
 |
| Module-wise count rates for Quadrant C Data is divided into 100 sec bins |
 |
 |
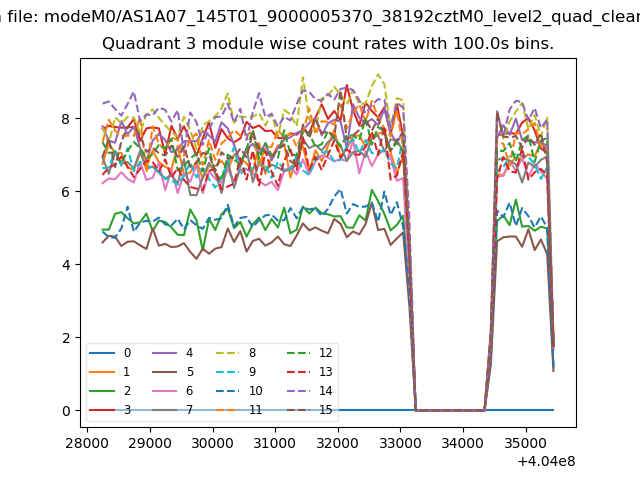
| Module-wise count rates for Quadrant D Data is divided into 100 sec bins |
 |
 |
| Parameter | Plot |
|---|---|
| CZT HV Monitor | 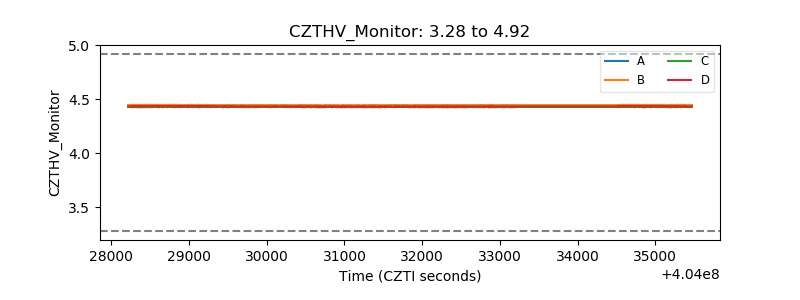 |
| D_VDD | 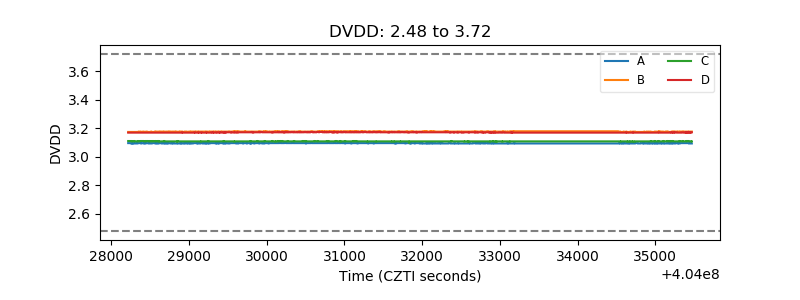 |
| Temperature 1 | 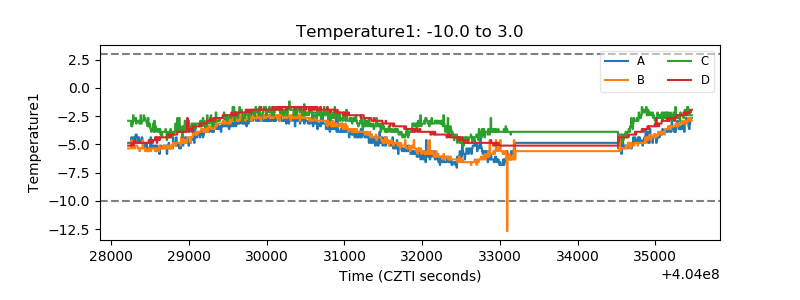 |
| Veto HV Monitor | 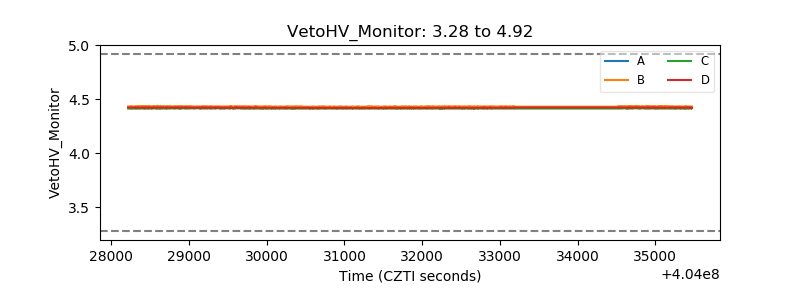 |
| Veto LLD | 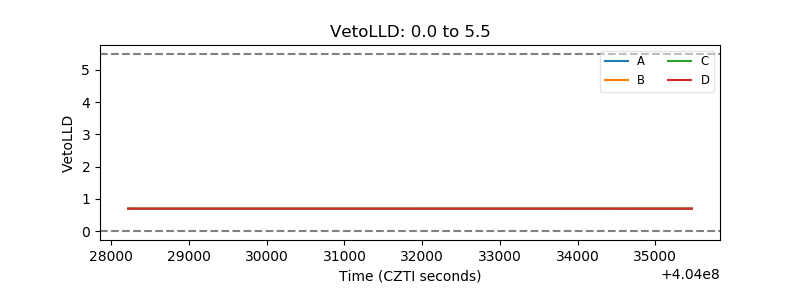 |
| Alpha Counter | 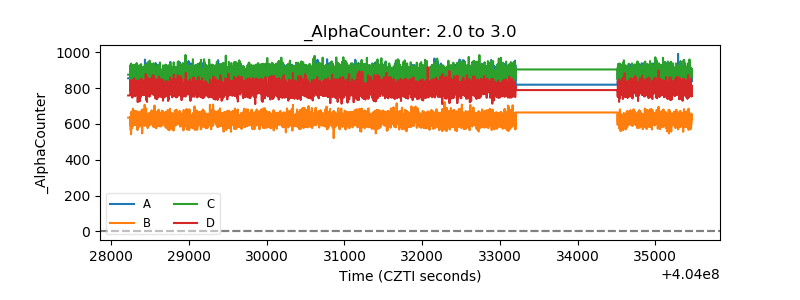 |
| _CPM_Rate | 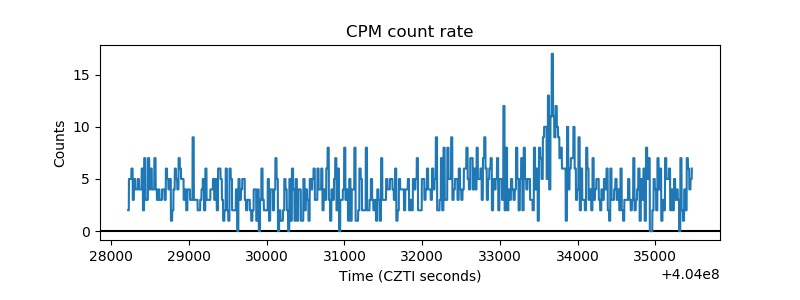 |
| CZT Counter | 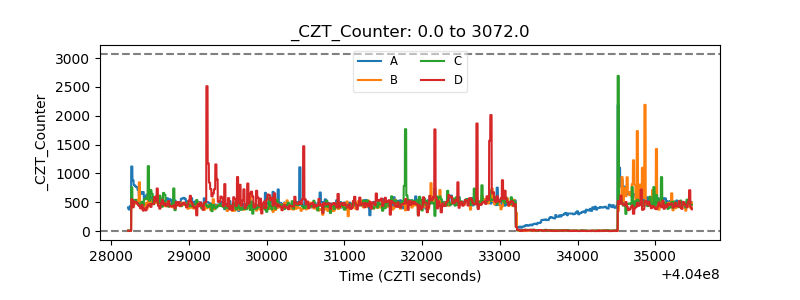 |
| +2.5 Volts monitor | 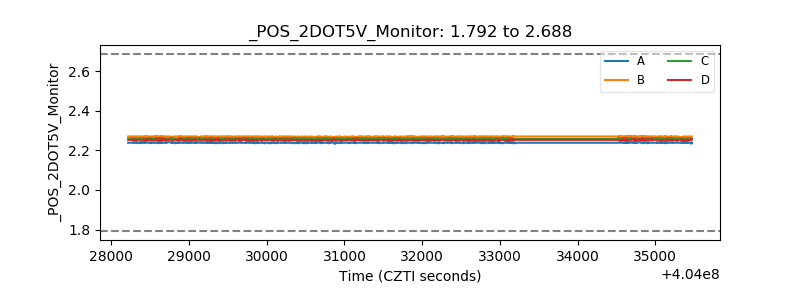 |
| +5 Volts monitor |  |
| _ROLL_ROT | 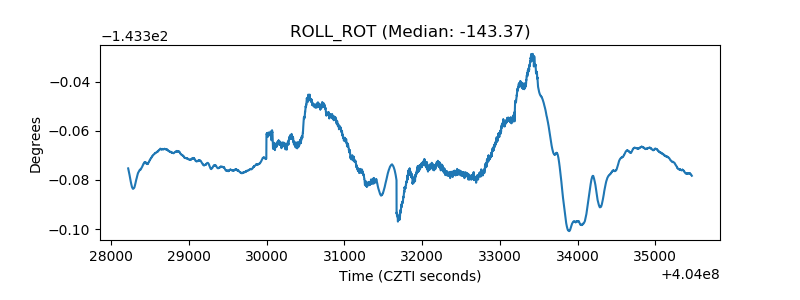 |
| _Roll_DEC | 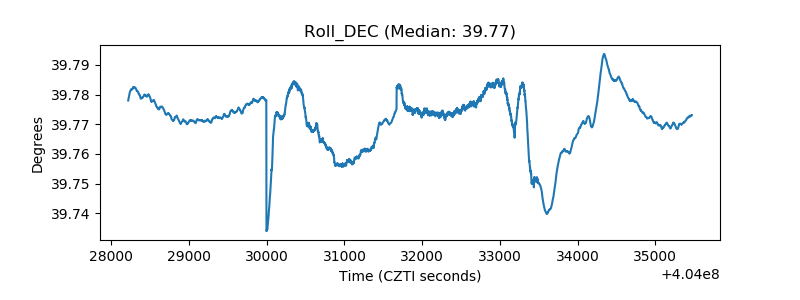 |
| _Roll_RA | 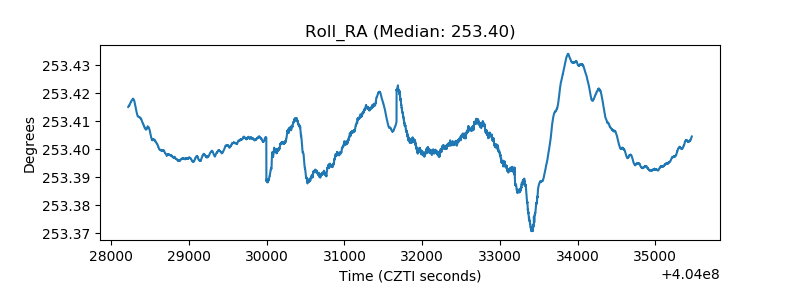 |
| Veto Counter | 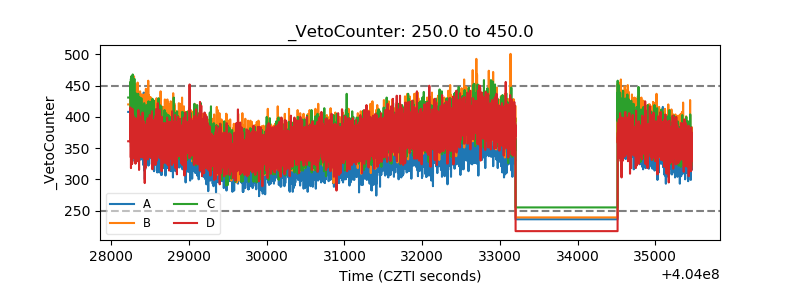 |