| Param | Original file | Final file |
|---|---|---|
| Filename | modeM0/AS1A07_145T01_9000005370_38198cztM0_level2.fits | modeM0/AS1A07_145T01_9000005370_38198cztM0_level2_quad_clean.evt |
| Size (bytes) | 1,448,544,960 | 404,792,640 |
| Size | 1.3 GB | 386.0 MB |
| Events in quadrant A | 12,237,453 | 2,749,646 |
| Events in quadrant B | 12,223,793 | 2,784,486 |
| Events in quadrant C | 12,274,218 | 2,648,670 |
| Events in quadrant D | 15,025,628 | 2,420,223 |
| Mode M9 | |||
|---|---|---|---|
| Quadrant | BADHDUFLAG | Total packets | Discarded packets |
| A | 0 | 76 | 1 |
| B | 0 | 75 | 0 |
| C | 0 | 77 | 3 |
| D | 0 | 76 | 1 |
| Mode SS | |||
|---|---|---|---|
| Quadrant | BADHDUFLAG | Total packets | Discarded packets |
| A | 0 | 495 | 4 |
| B | 0 | 494 | 2 |
| C | 0 | 492 | 0 |
| D | 0 | 495 | 1 |
| Mode M0 | |||
|---|---|---|---|
| Quadrant | BADHDUFLAG | Total packets | Discarded packets |
| A | 0 | 51201 | 374 |
| B | 0 | 52693 | 404 |
| C | 0 | 51699 | 401 |
| D | 0 | 60547 | 437 |
| Quadrant | Total seconds | Saturated seconds | Saturation percentage |
|---|---|---|---|
| A | 24017 | 46 | 0.191531% |
| B | 24017 | 228 | 0.949328% |
| C | 24007 | 168 | 0.699796% |
| D | 24022 | 778 | 3.238698% |
Noise dominated data is calculated using 1-second bins in cleaned event files. If a bin has >2000 counts, and if more than 50% of those come from <1% of pixels, then it is considered to be noise-dominated and hence unusable.
| Quadrant | # 1 sec bins | Bins with >0 counts | Bins with >2000 counts | High rate bins dominated by noise | Noise dominated (total time) | Noise dominated (detector-on time) | Marked lightcurve |
|---|---|---|---|---|---|---|---|
| A | 31699 | 24180 | 12 | 12 | 0.04% | 0.05% | 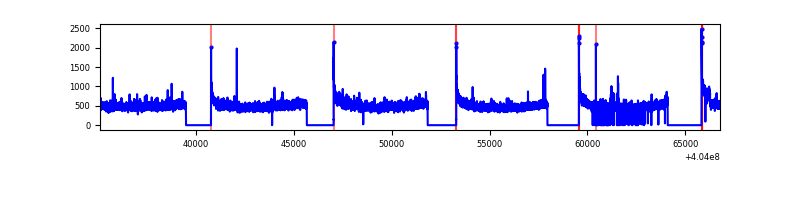 |
| B | 31699 | 24185 | 169 | 169 | 0.53% | 0.70% | 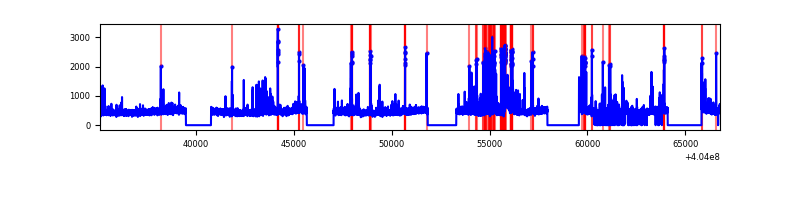 |
| C | 31699 | 24178 | 140 | 140 | 0.44% | 0.58% | 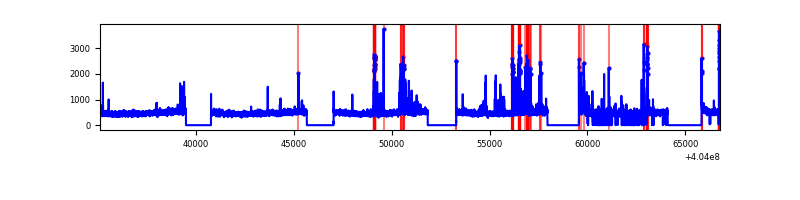 |
| D | 31699 | 24185 | 775 | 775 | 2.44% | 3.20% | 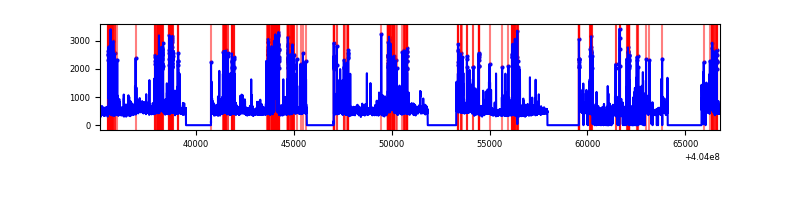 |
Top three noisy pixels from each quadrant. If the there are fewer than three noisy pixels in the level2.evt file, extra rows are filled as -1
| Pixel properties | Quadrant properties | ||||||
|---|---|---|---|---|---|---|---|
| Quadrant | DetID | PixID | Counts | Sigma | Mean | Median | Sigma |
| A | 10 | 83 | 1425288 | 2632.5 | 2692 | 2637 | 540.4 |
| A | 12 | 189 | 238692 | 436.8 | 2692 | 2637 | 540.4 |
| A | 0 | 247 | 83036 | 148.77 | 2692 | 2637 | 540.4 |
| B | 5 | 184 | 909424 | 1801.4 | 2677 | 2605 | 503.4 |
| B | 5 | 172 | 213097 | 418.14 | 2677 | 2605 | 503.4 |
| B | 0 | 229 | 174186 | 340.85 | 2677 | 2605 | 503.4 |
| C | 15 | 214 | 975893 | 1590.08 | 2630 | 2641 | 612.1 |
| C | 14 | 254 | 851749 | 1387.25 | 2630 | 2641 | 612.1 |
| C | 12 | 249 | 72185 | 113.62 | 2630 | 2641 | 612.1 |
| D | 7 | 55 | 1146654 | 1820.64 | 2610 | 2541 | 628.4 |
| D | 2 | 16 | 785077 | 1245.26 | 2610 | 2541 | 628.4 |
| D | 10 | 199 | 659796 | 1045.9 | 2610 | 2541 | 628.4 |
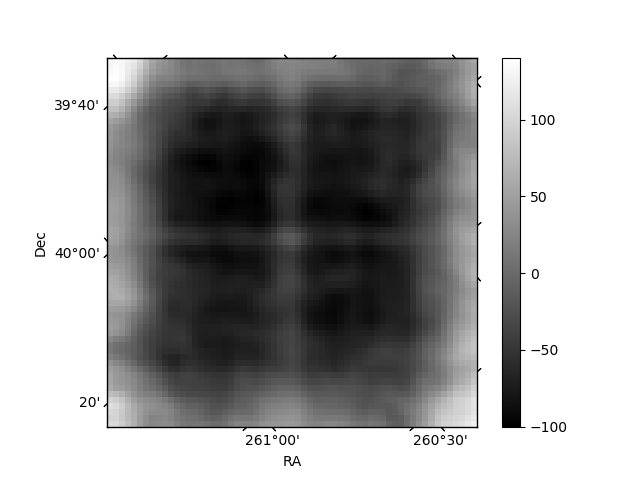
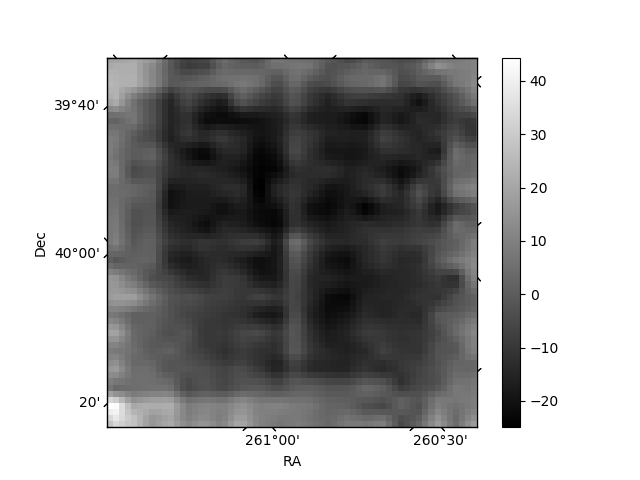
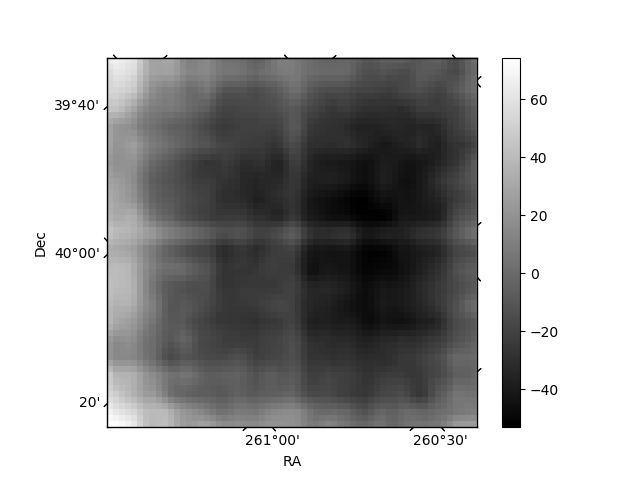
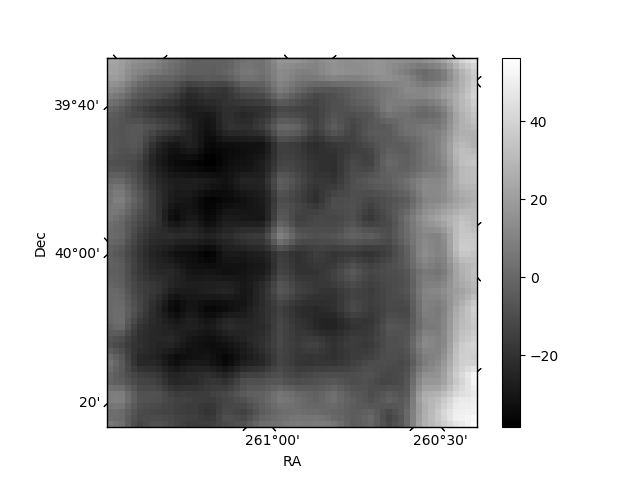
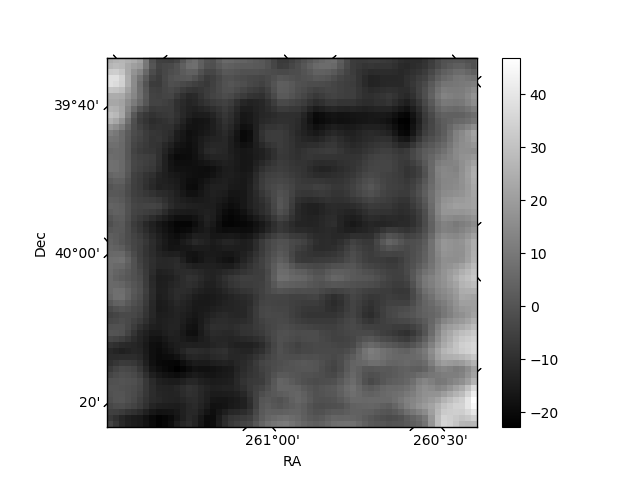
Histogram calculated using DETX and DETY for each event in the final _common_clean file
| Quadrant A | 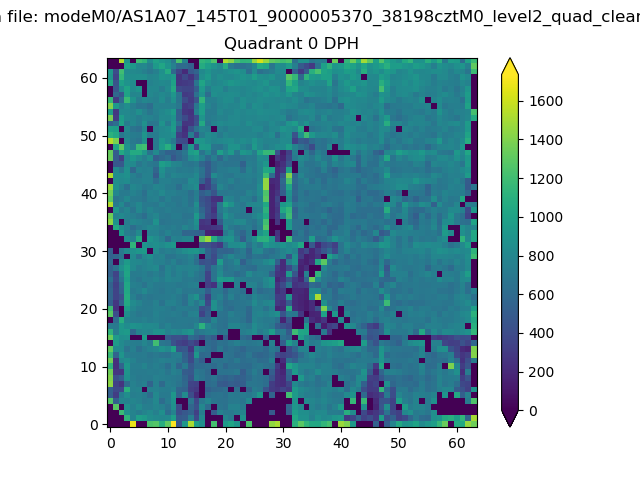 |
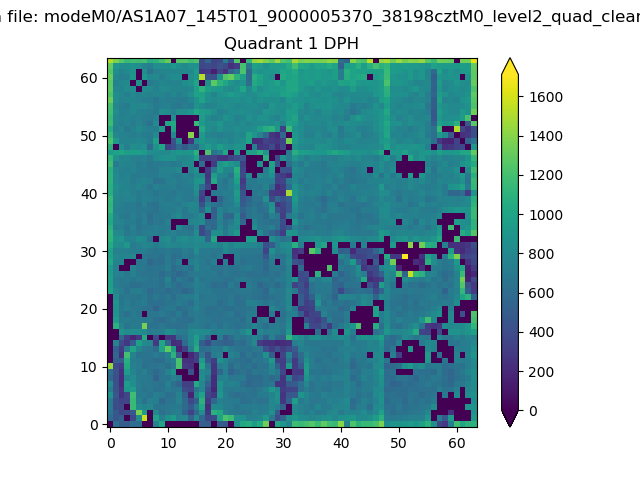 |
Quadrant B |
|---|---|---|---|
| Quadrant D |  |
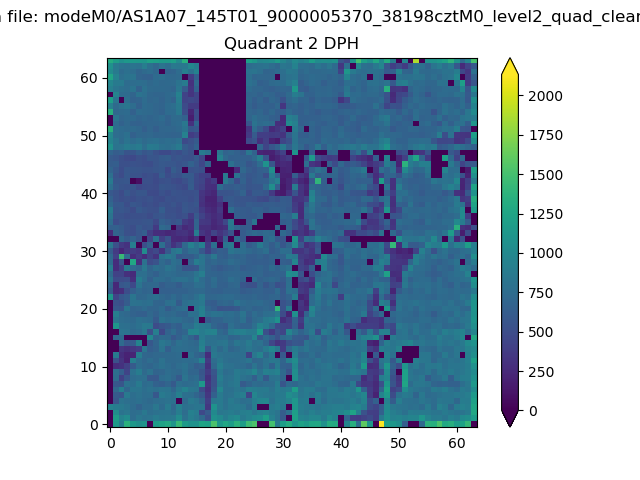 |
Quadrant C |
| Plot type | Count rate plots | Images |
|---|---|---|
| Comparison with Poisson distribution Blue bars denote a histogram of data divided into 1 sec bins. Red curve is a Poisson curve with rate = median count rate of data. |
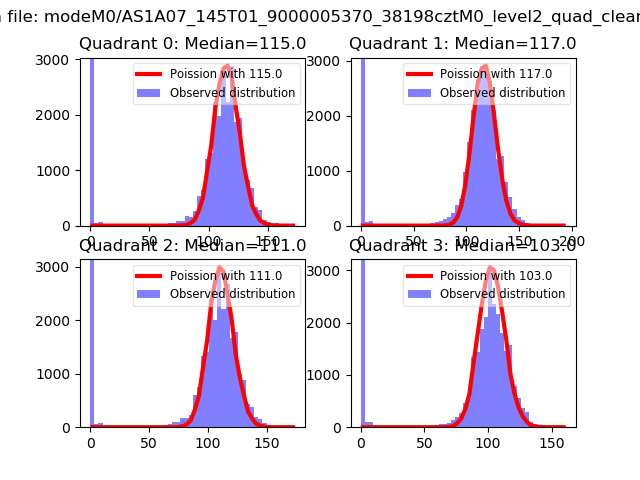 |
 |
| Quadrant-wise count rates Data is divided into 100 sec bins |
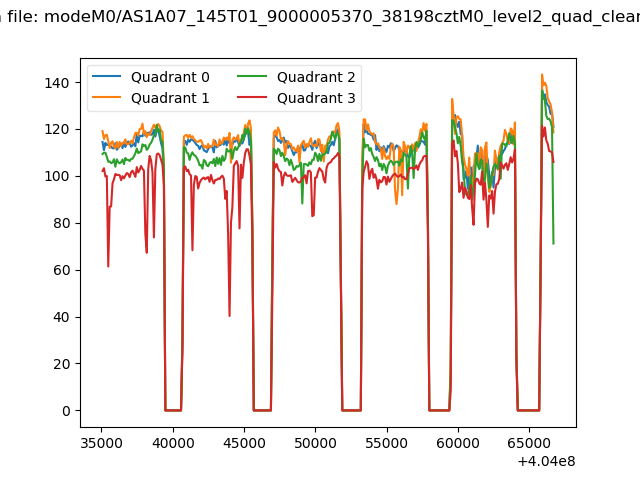 |
|
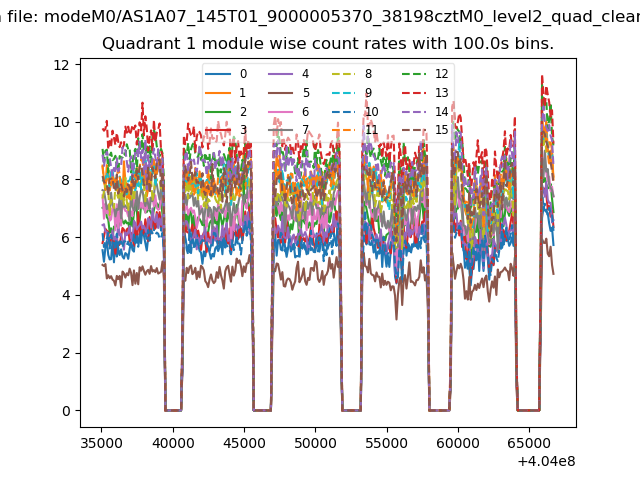
| Module-wise count rates for Quadrant A Data is divided into 100 sec bins |
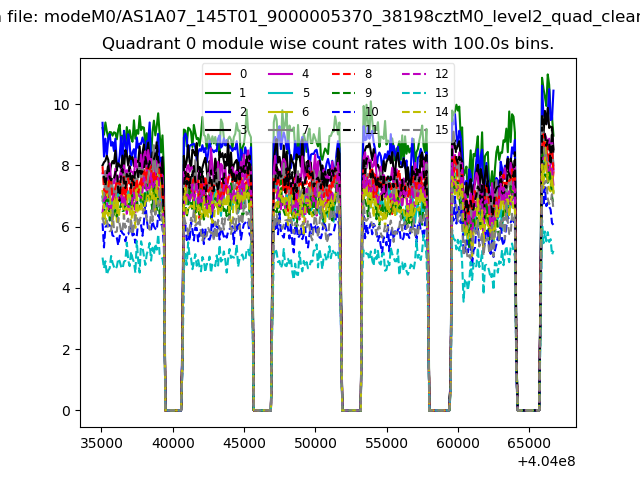 |
 |
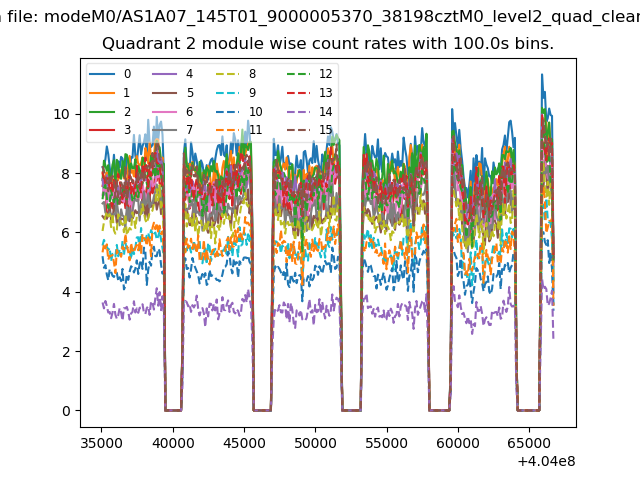
| Module-wise count rates for Quadrant B Data is divided into 100 sec bins |
 |
 |
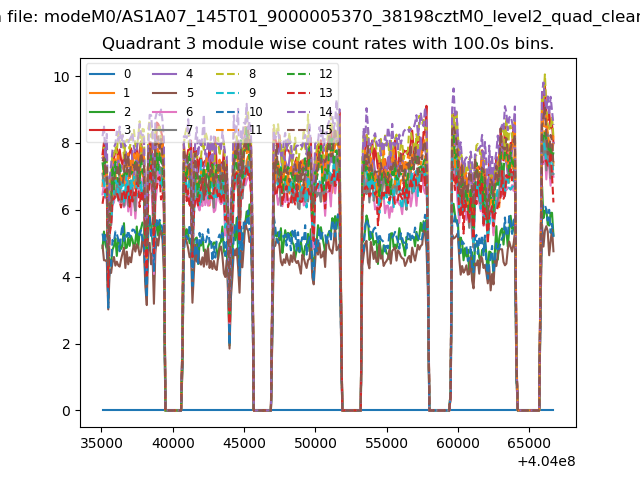
| Module-wise count rates for Quadrant C Data is divided into 100 sec bins |
 |
 |
| Module-wise count rates for Quadrant D Data is divided into 100 sec bins |
 |
 |
| Parameter | Plot |
|---|---|
| CZT HV Monitor | 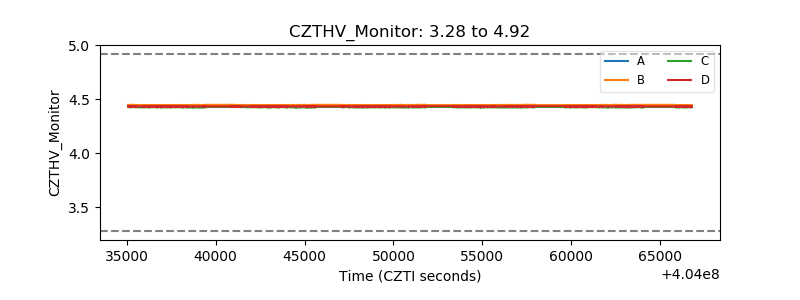 |
| D_VDD | 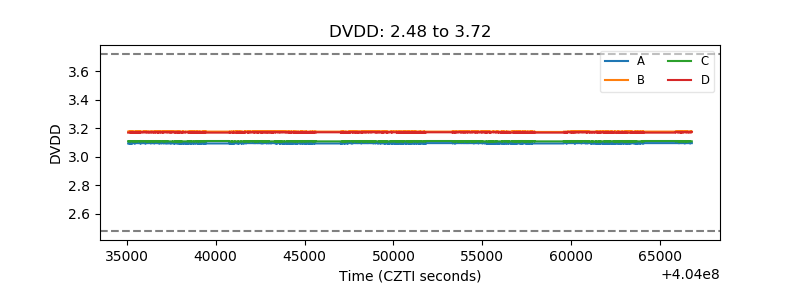 |
| Temperature 1 | 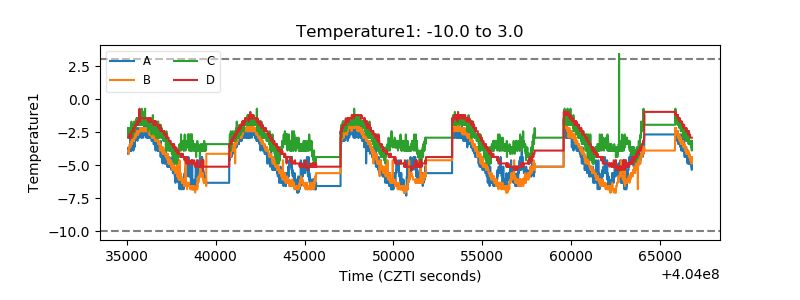 |
| Veto HV Monitor | 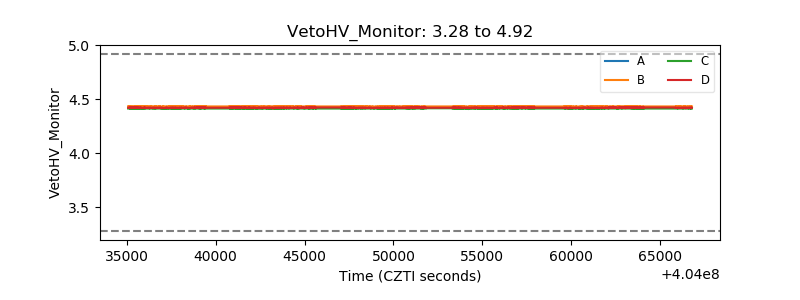 |
| Veto LLD | 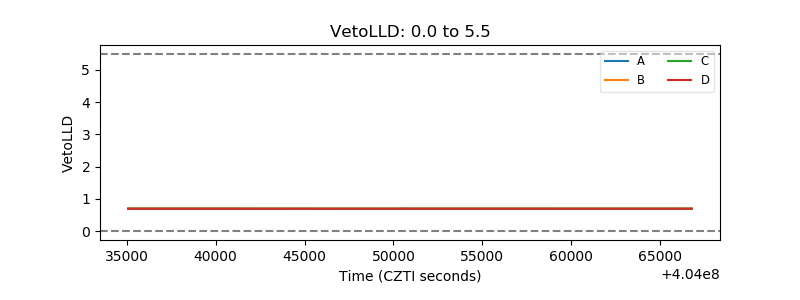 |
| Alpha Counter | 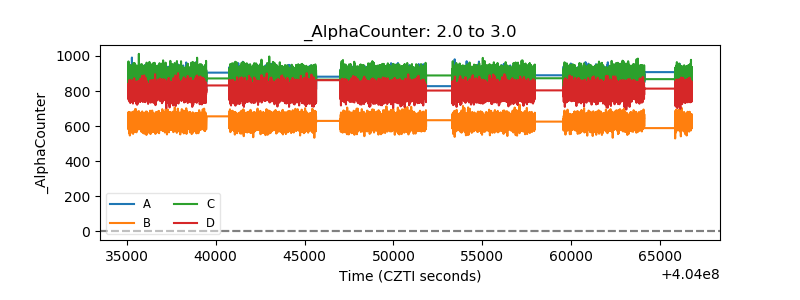 |
| _CPM_Rate | 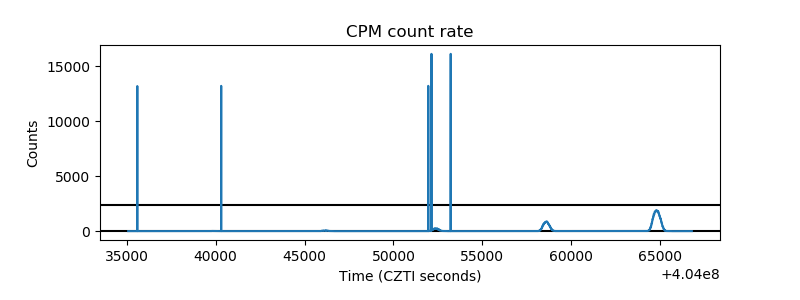 |
| CZT Counter | 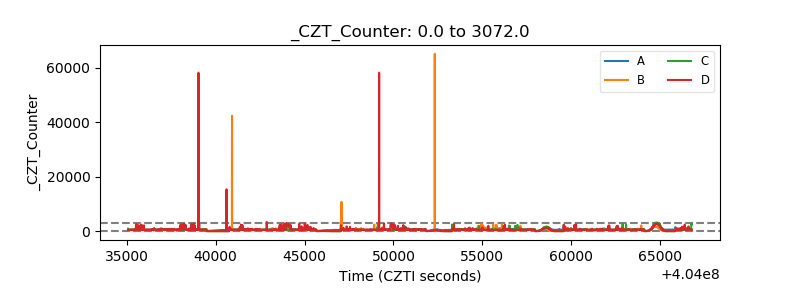 |
| +2.5 Volts monitor | 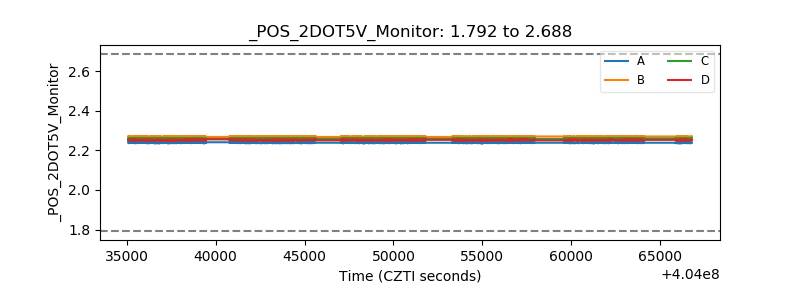 |
| +5 Volts monitor | 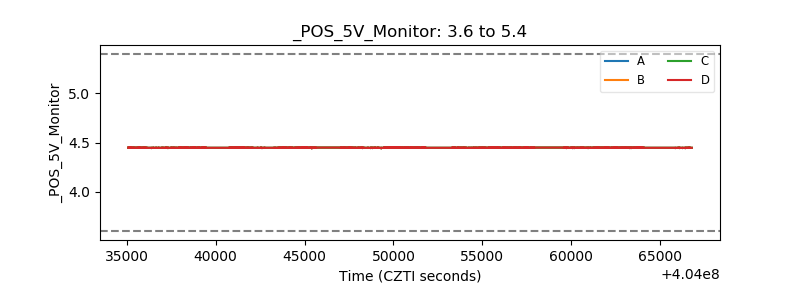 |
| _ROLL_ROT | 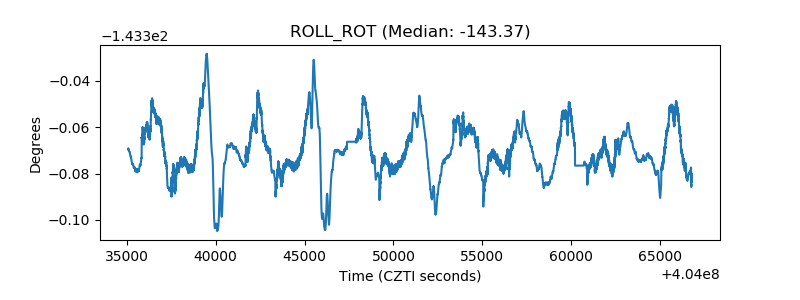 |
| _Roll_DEC | 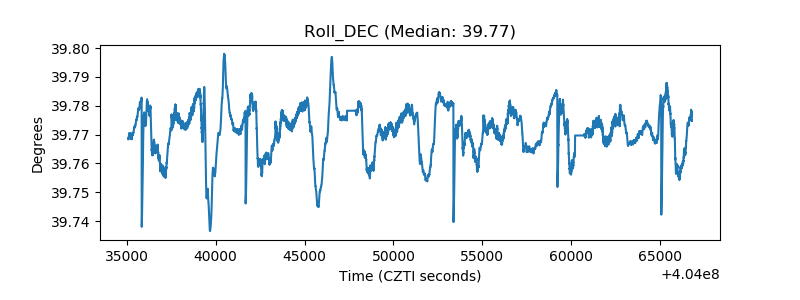 |
| _Roll_RA | 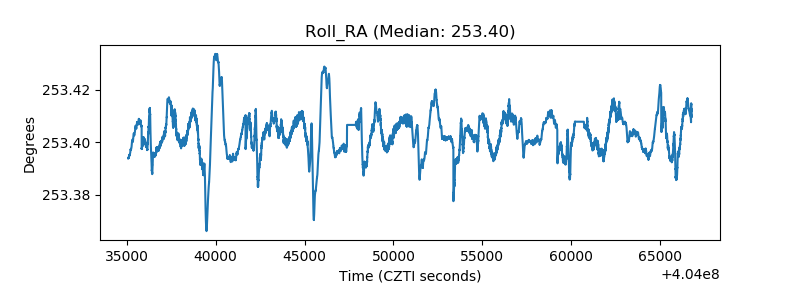 |
| Veto Counter | 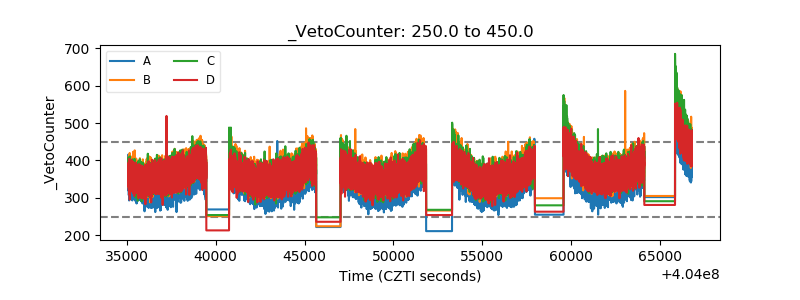 |