| Param | Original file | Final file |
|---|---|---|
| Filename | modeM0/AS1A07_145T01_9000005370_38199cztM0_level2.fits | modeM0/AS1A07_145T01_9000005370_38199cztM0_level2_quad_clean.evt |
| Size (bytes) | 354,600,000 | 91,247,040 |
| Size | 338.2 MB | 87.0 MB |
| Events in quadrant A | 2,835,378 | 622,976 |
| Events in quadrant B | 2,498,012 | 643,868 |
| Events in quadrant C | 2,784,557 | 612,544 |
| Events in quadrant D | 4,611,238 | 525,851 |
| Mode M9 | |||
|---|---|---|---|
| Quadrant | BADHDUFLAG | Total packets | Discarded packets |
| A | 0 | 18 | 0 |
| B | 0 | 18 | 0 |
| C | 0 | 18 | 0 |
| D | 0 | 18 | 0 |
| Mode SS | |||
|---|---|---|---|
| Quadrant | BADHDUFLAG | Total packets | Discarded packets |
| A | 0 | 106 | 0 |
| B | 0 | 106 | 0 |
| C | 0 | 106 | 0 |
| D | 0 | 106 | 0 |
| Mode M0 | |||
|---|---|---|---|
| Quadrant | BADHDUFLAG | Total packets | Discarded packets |
| A | 0 | 11476 | 3 |
| B | 0 | 10648 | 2 |
| C | 0 | 11219 | 2 |
| D | 0 | 17172 | 2 |
| Quadrant | Total seconds | Saturated seconds | Saturation percentage |
|---|---|---|---|
| A | 5098 | 24 | 0.470773% |
| B | 5098 | 14 | 0.274617% |
| C | 5098 | 72 | 1.412319% |
| D | 5098 | 495 | 9.709690% |
Noise dominated data is calculated using 1-second bins in cleaned event files. If a bin has >2000 counts, and if more than 50% of those come from <1% of pixels, then it is considered to be noise-dominated and hence unusable.
| Quadrant | # 1 sec bins | Bins with >0 counts | Bins with >2000 counts | High rate bins dominated by noise | Noise dominated (total time) | Noise dominated (detector-on time) | Marked lightcurve |
|---|---|---|---|---|---|---|---|
| A | 6981 | 5099 | 17 | 17 | 0.24% | 0.33% | 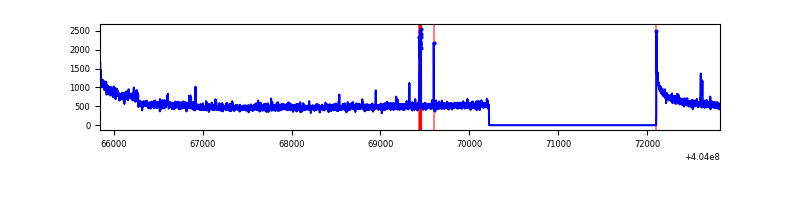 |
| B | 6981 | 5099 | 6 | 6 | 0.09% | 0.12% | 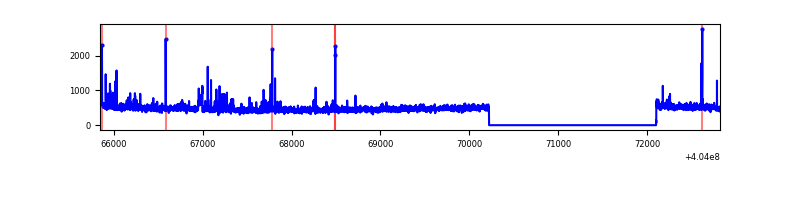 |
| C | 6981 | 5099 | 68 | 68 | 0.97% | 1.33% | 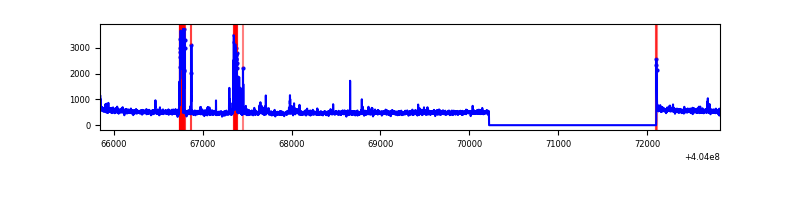 |
| D | 6981 | 5099 | 519 | 519 | 7.43% | 10.18% | 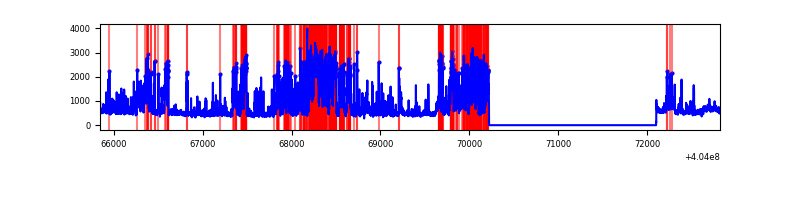 |
Top three noisy pixels from each quadrant. If the there are fewer than three noisy pixels in the level2.evt file, extra rows are filled as -1
| Pixel properties | Quadrant properties | ||||||
|---|---|---|---|---|---|---|---|
| Quadrant | DetID | PixID | Counts | Sigma | Mean | Median | Sigma |
| A | 10 | 83 | 365202 | 3053.68 | 590 | 580 | 119.4 |
| A | 0 | 247 | 65145 | 540.73 | 590 | 580 | 119.4 |
| A | 12 | 189 | 57887 | 479.94 | 590 | 580 | 119.4 |
| B | 12 | 18 | 47339 | 410.82 | 595 | 581 | 113.8 |
| B | 0 | 229 | 37379 | 323.31 | 595 | 581 | 113.8 |
| B | 5 | 172 | 16724 | 141.83 | 595 | 581 | 113.8 |
| C | 14 | 254 | 267882 | 1979.9 | 582 | 588 | 135.0 |
| C | 15 | 214 | 208771 | 1542.06 | 582 | 588 | 135.0 |
| C | 0 | 10 | 14776 | 105.09 | 582 | 588 | 135.0 |
| D | 2 | 250 | 1833547 | 13303.19 | 566 | 552 | 137.8 |
| D | 13 | 249 | 134075 | 969.06 | 566 | 552 | 137.8 |
| D | 10 | 199 | 108666 | 784.65 | 566 | 552 | 137.8 |
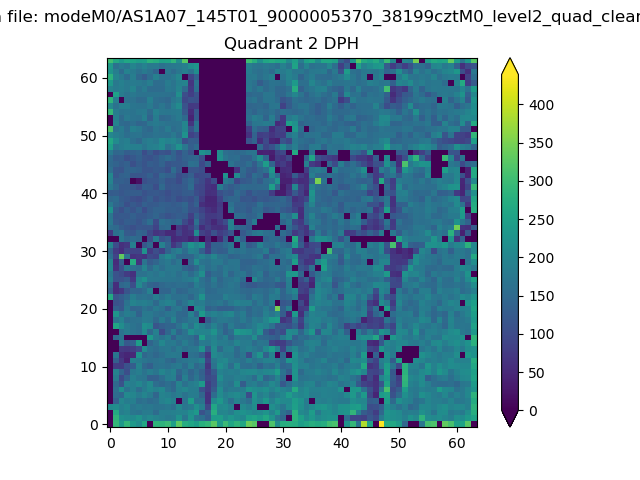
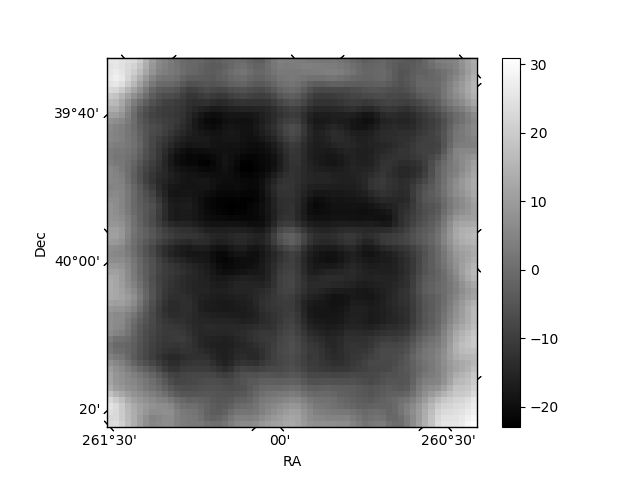
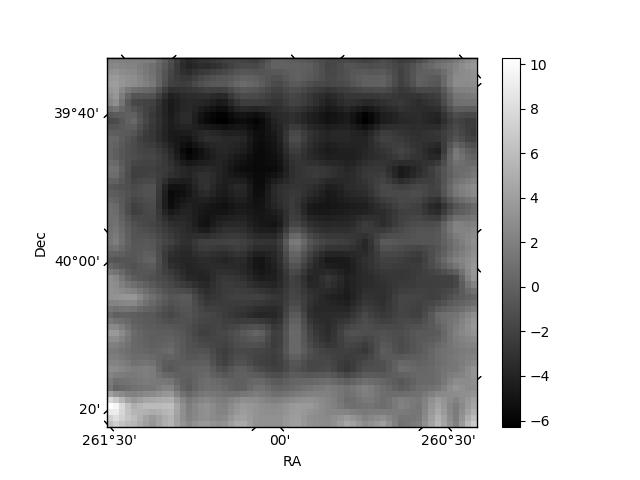
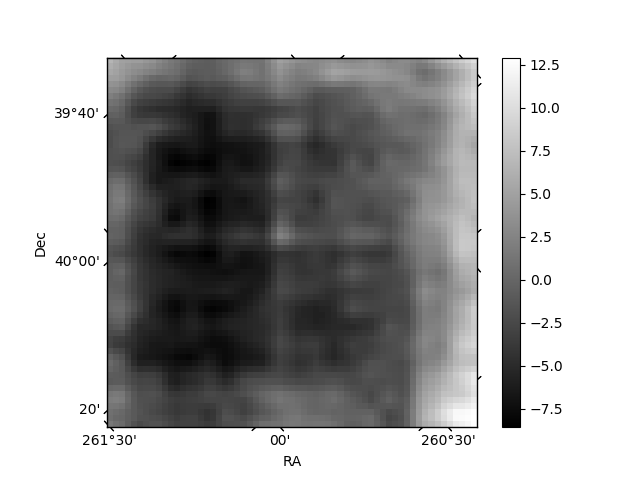
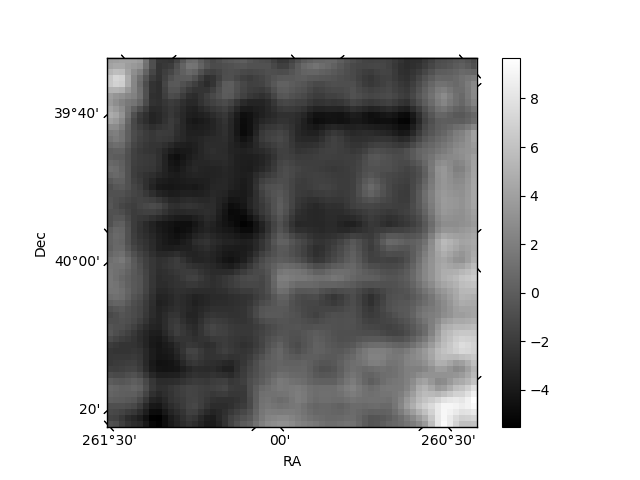
Histogram calculated using DETX and DETY for each event in the final _common_clean file
| Quadrant A | 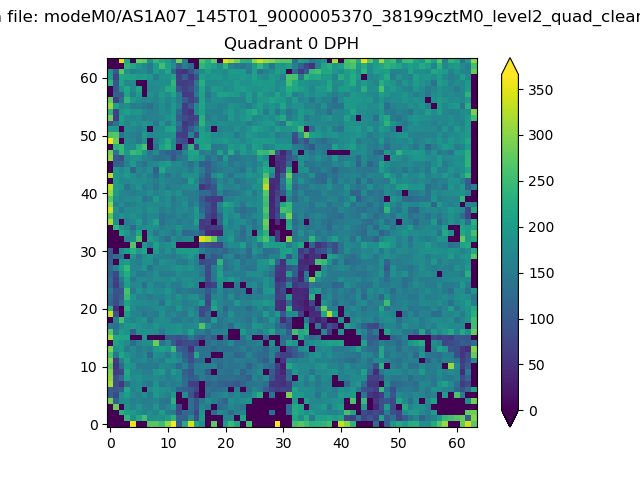 |
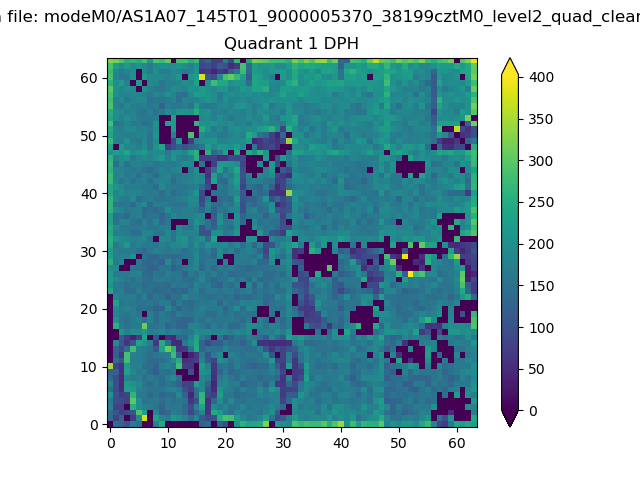 |
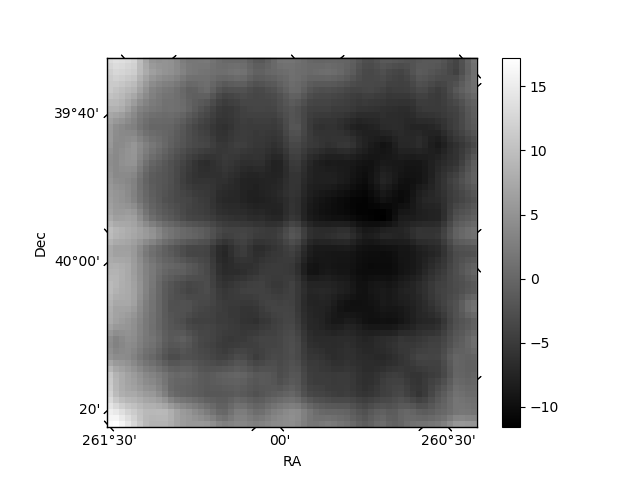
Quadrant B |
|---|---|---|---|
| Quadrant D | 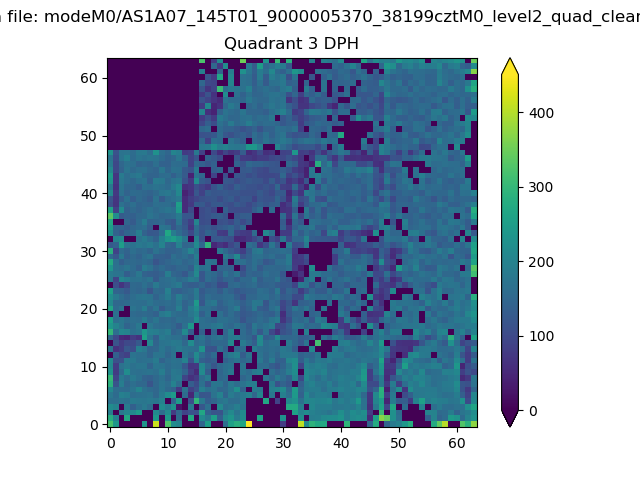 |
 |
Quadrant C |
| Plot type | Count rate plots | Images |
|---|---|---|
| Comparison with Poisson distribution Blue bars denote a histogram of data divided into 1 sec bins. Red curve is a Poisson curve with rate = median count rate of data. |
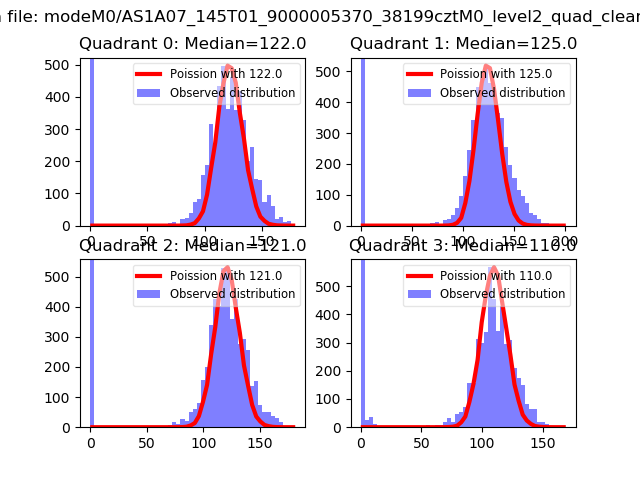 |
 |
| Quadrant-wise count rates Data is divided into 100 sec bins |
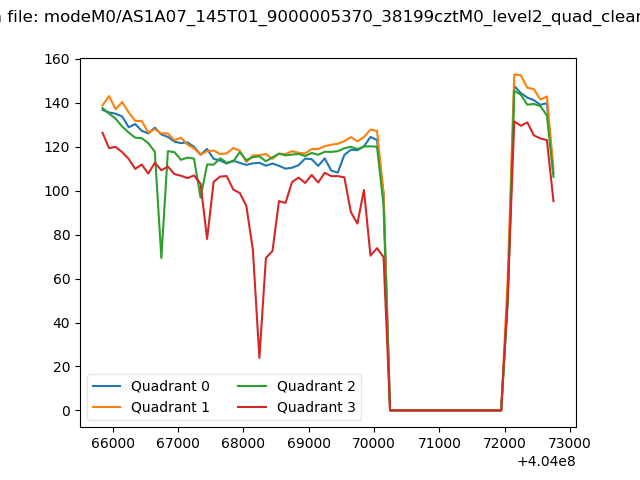 |
|
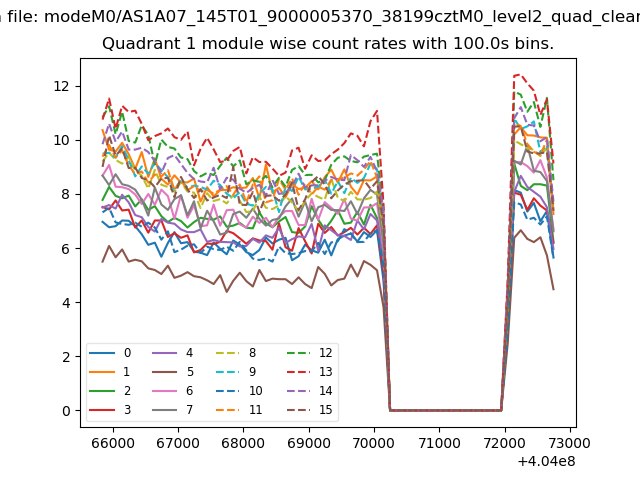
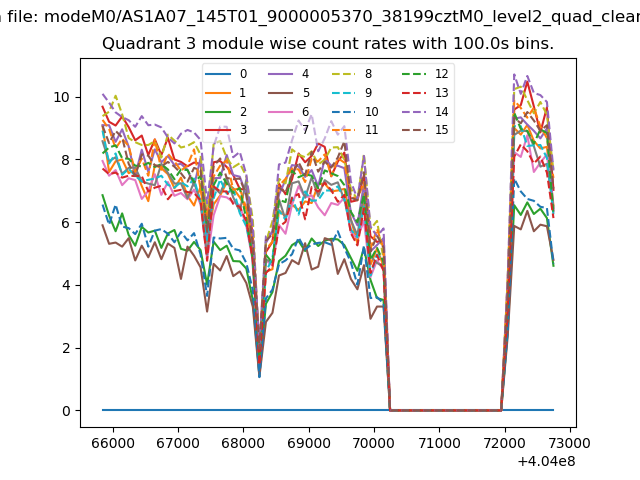
| Module-wise count rates for Quadrant A Data is divided into 100 sec bins |
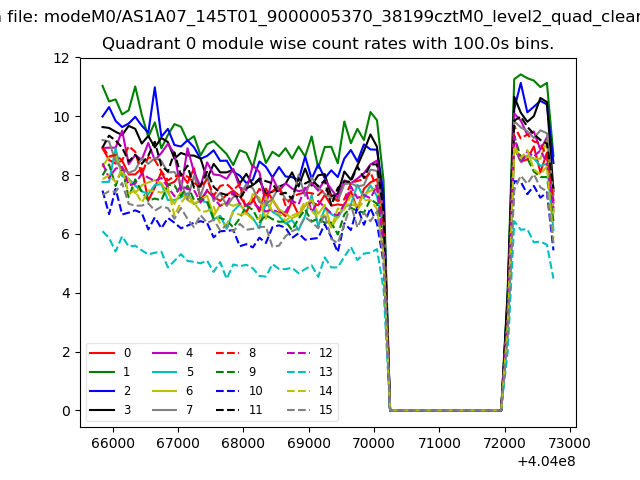 |
 |
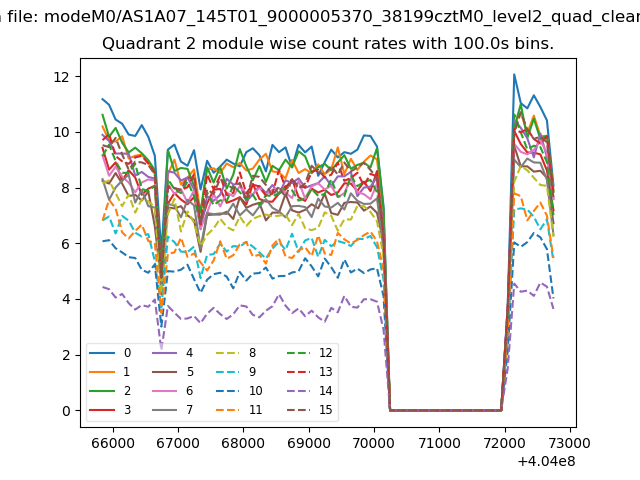
| Module-wise count rates for Quadrant B Data is divided into 100 sec bins |
 |
 |
| Module-wise count rates for Quadrant C Data is divided into 100 sec bins |
 |
 |
| Module-wise count rates for Quadrant D Data is divided into 100 sec bins |
 |
 |
| Parameter | Plot |
|---|---|
| CZT HV Monitor | 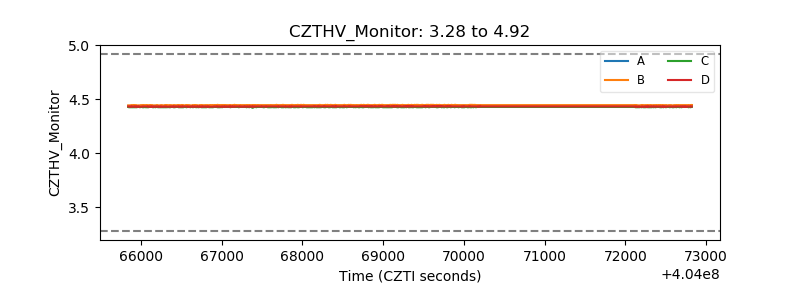 |
| D_VDD | 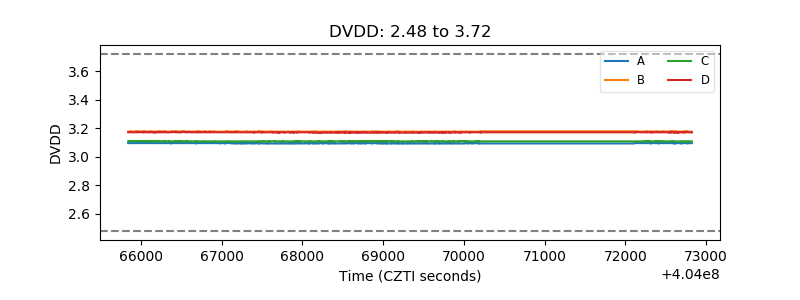 |
| Temperature 1 | 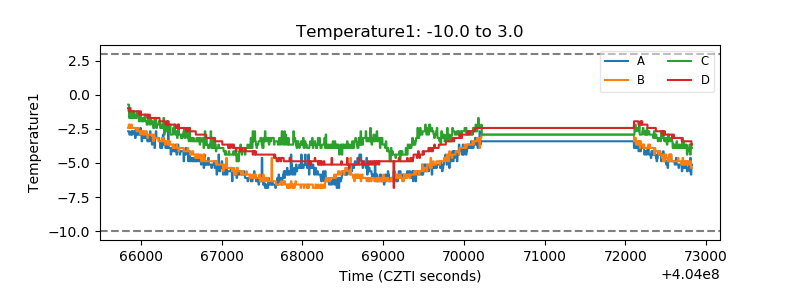 |
| Veto HV Monitor | 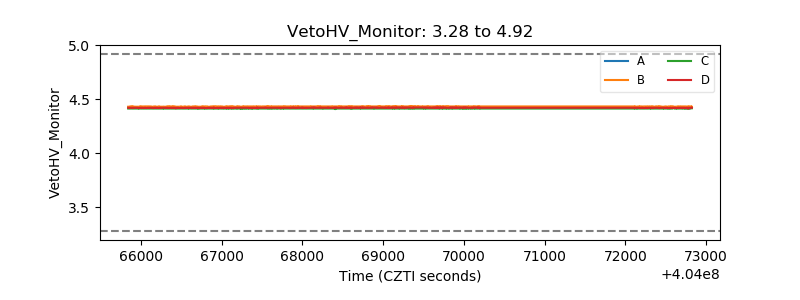 |
| Veto LLD | 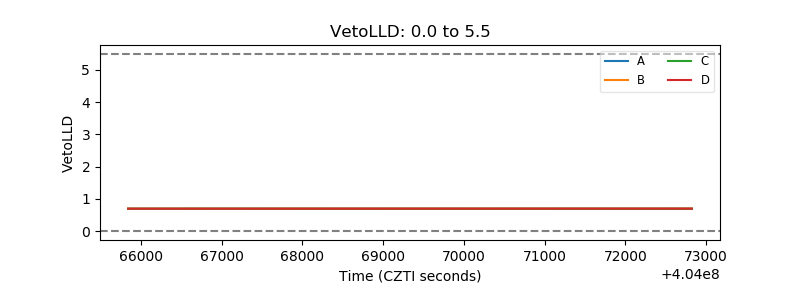 |
| Alpha Counter | 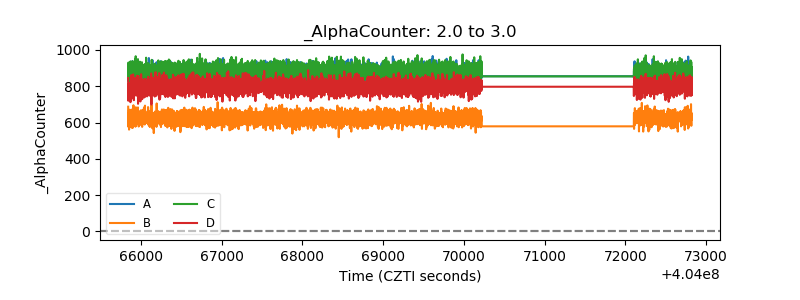 |
| _CPM_Rate | 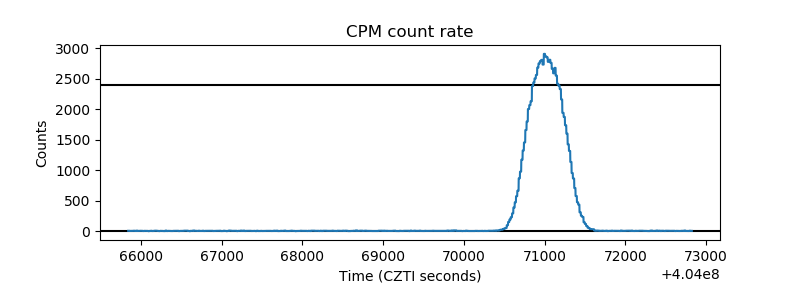 |
| CZT Counter | 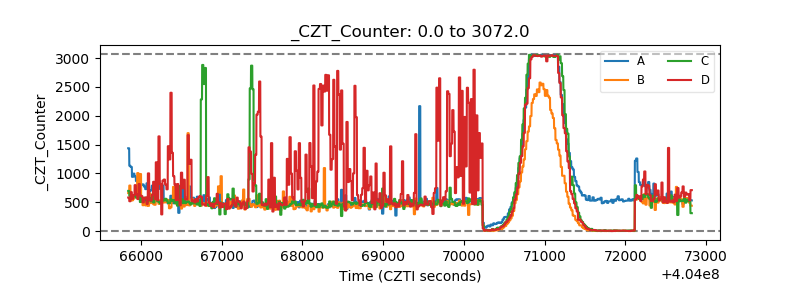 |
| +2.5 Volts monitor | 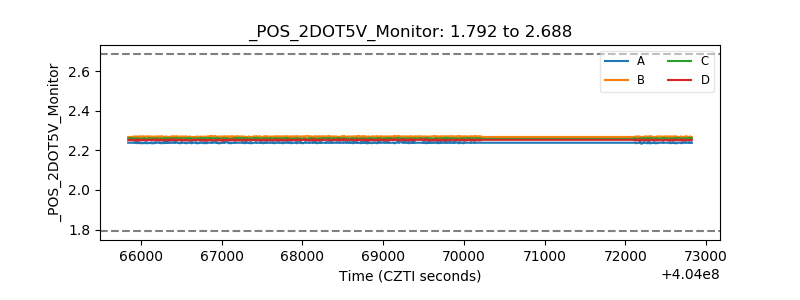 |
| +5 Volts monitor | 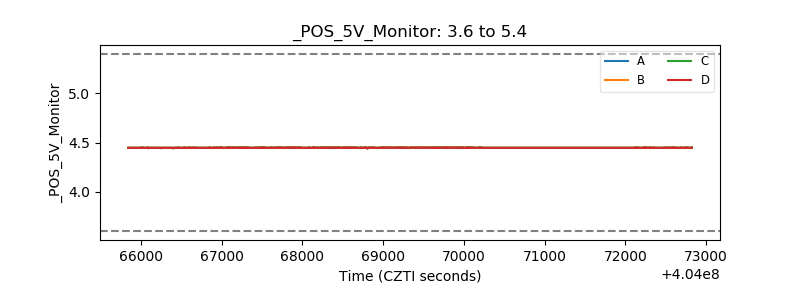 |
| _ROLL_ROT | 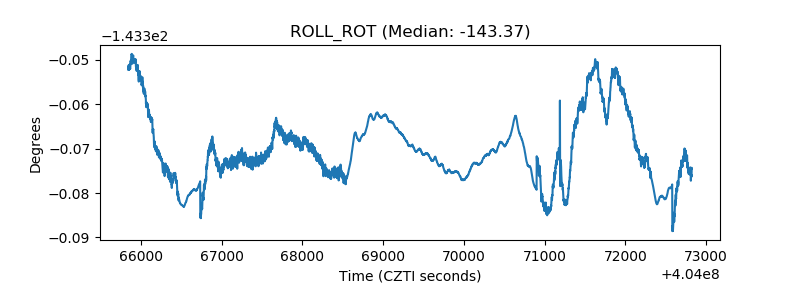 |
| _Roll_DEC | 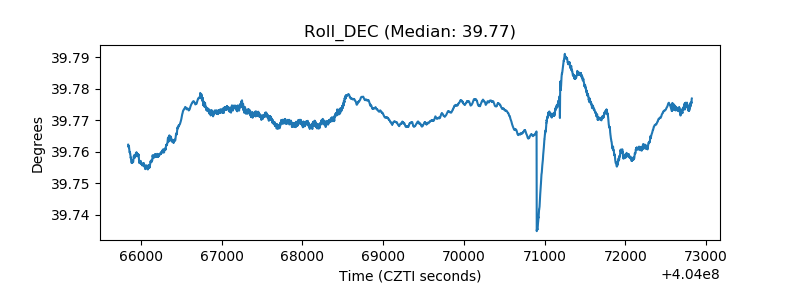 |
| _Roll_RA | 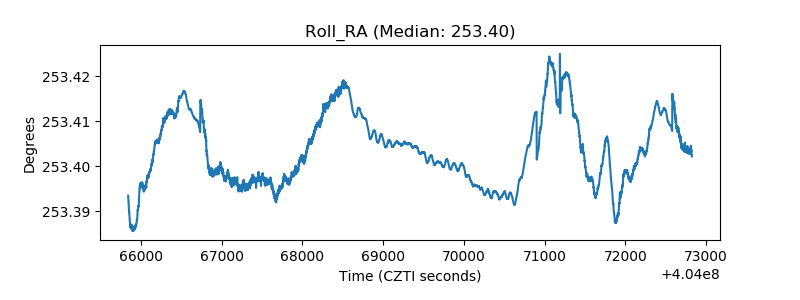 |
| Veto Counter | 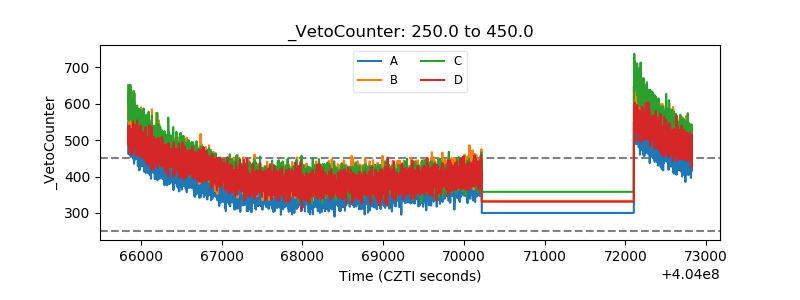 |