| Param | Original file | Final file |
|---|---|---|
| Filename | modeM0/AS1A07_145T01_9000005370_38200cztM0_level2.fits | modeM0/AS1A07_145T01_9000005370_38200cztM0_level2_quad_clean.evt |
| Size (bytes) | 305,470,080 | 94,357,440 |
| Size | 291.3 MB | 90.0 MB |
| Events in quadrant A | 2,766,903 | 635,111 |
| Events in quadrant B | 2,406,185 | 663,169 |
| Events in quadrant C | 2,640,846 | 633,411 |
| Events in quadrant D | 3,106,295 | 577,132 |
| Mode M9 | |||
|---|---|---|---|
| Quadrant | BADHDUFLAG | Total packets | Discarded packets |
| A | 0 | 31 | 0 |
| B | 0 | 31 | 0 |
| C | 0 | 31 | 0 |
| D | 0 | 32 | 0 |
| Mode SS | |||
|---|---|---|---|
| Quadrant | BADHDUFLAG | Total packets | Discarded packets |
| A | 0 | 102 | 0 |
| B | 0 | 102 | 0 |
| C | 0 | 102 | 0 |
| D | 0 | 102 | 0 |
| Mode M0 | |||
|---|---|---|---|
| Quadrant | BADHDUFLAG | Total packets | Discarded packets |
| A | 0 | 11222 | 3 |
| B | 0 | 10164 | 2 |
| C | 0 | 10696 | 2 |
| D | 0 | 12381 | 2 |
| Quadrant | Total seconds | Saturated seconds | Saturation percentage |
|---|---|---|---|
| A | 4971 | 22 | 0.442567% |
| B | 4971 | 10 | 0.201167% |
| C | 4971 | 20 | 0.402334% |
| D | 4971 | 78 | 1.569101% |
Noise dominated data is calculated using 1-second bins in cleaned event files. If a bin has >2000 counts, and if more than 50% of those come from <1% of pixels, then it is considered to be noise-dominated and hence unusable.
| Quadrant | # 1 sec bins | Bins with >0 counts | Bins with >2000 counts | High rate bins dominated by noise | Noise dominated (total time) | Noise dominated (detector-on time) | Marked lightcurve |
|---|---|---|---|---|---|---|---|
| A | 6973 | 4972 | 9 | 9 | 0.13% | 0.18% | 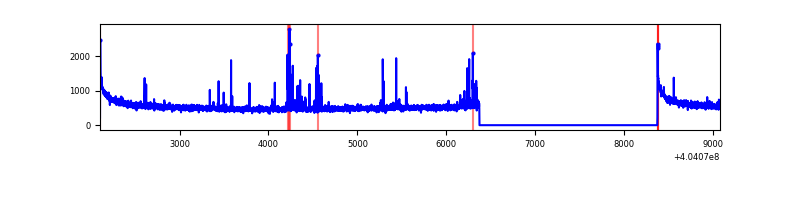 |
| B | 6973 | 4972 | 1 | 1 | 0.01% | 0.02% | 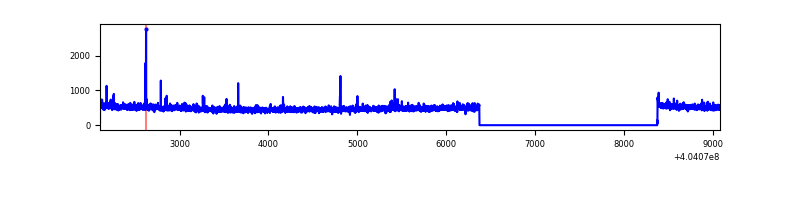 |
| C | 6973 | 4972 | 16 | 16 | 0.23% | 0.32% | 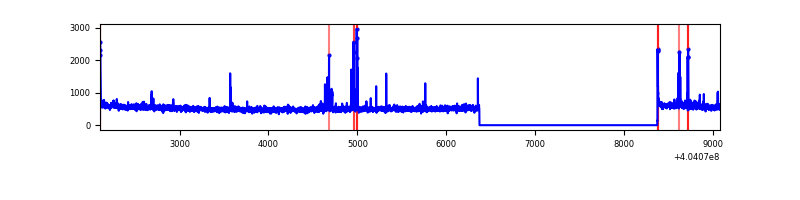 |
| D | 6973 | 4972 | 76 | 76 | 1.09% | 1.53% | 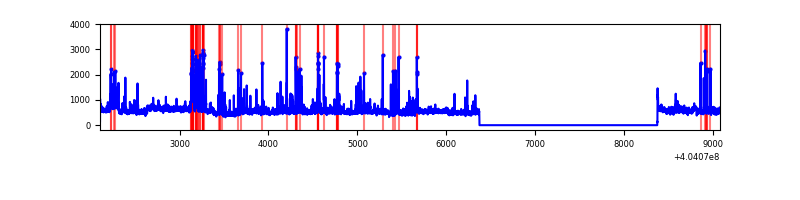 |
Top three noisy pixels from each quadrant. If the there are fewer than three noisy pixels in the level2.evt file, extra rows are filled as -1
| Pixel properties | Quadrant properties | ||||||
|---|---|---|---|---|---|---|---|
| Quadrant | DetID | PixID | Counts | Sigma | Mean | Median | Sigma |
| A | 10 | 83 | 349736 | 2927.06 | 589 | 578 | 119.3 |
| A | 9 | 143 | 86952 | 724.09 | 589 | 578 | 119.3 |
| A | 13 | 6 | 18339 | 148.89 | 589 | 578 | 119.3 |
| B | 5 | 172 | 18030 | 154.79 | 598 | 584 | 112.7 |
| B | 15 | 35 | 14933 | 127.31 | 598 | 584 | 112.7 |
| B | 12 | 111 | 13701 | 116.38 | 598 | 584 | 112.7 |
| C | 15 | 214 | 206684 | 1517.92 | 590 | 596 | 135.8 |
| C | 14 | 254 | 75734 | 553.42 | 590 | 596 | 135.8 |
| C | 0 | 10 | 21229 | 151.97 | 590 | 596 | 135.8 |
| D | 10 | 203 | 253184 | 1786.93 | 583 | 568 | 141.4 |
| D | 7 | 55 | 133477 | 940.16 | 583 | 568 | 141.4 |
| D | 13 | 249 | 113588 | 799.47 | 583 | 568 | 141.4 |
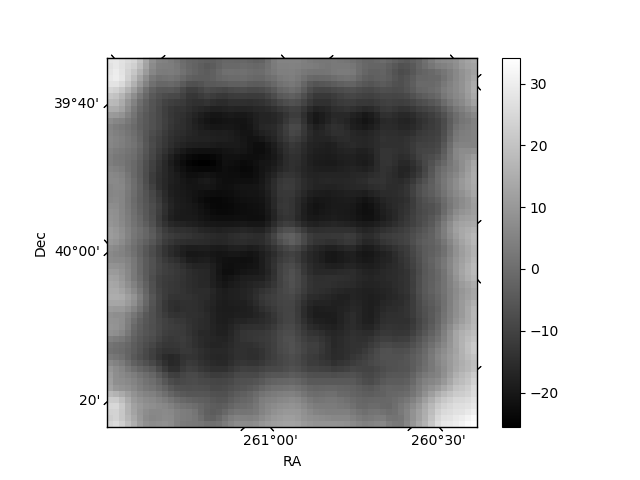
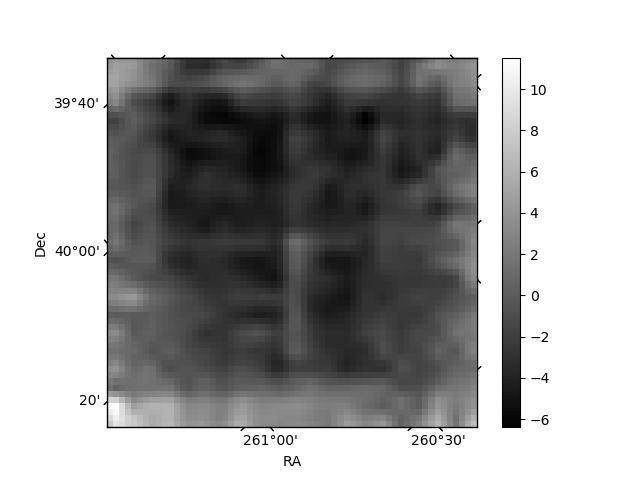
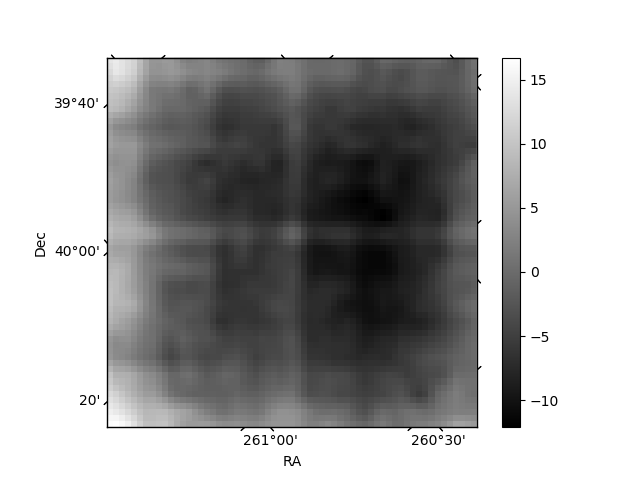
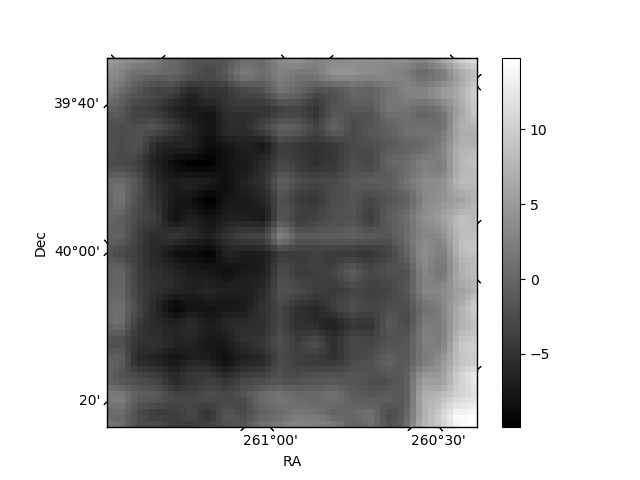
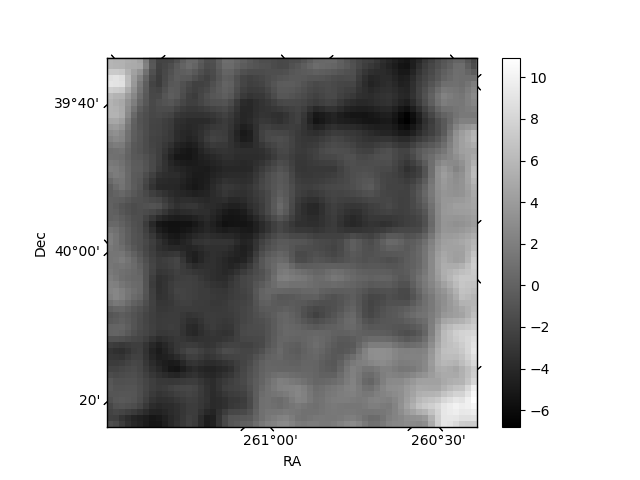
Histogram calculated using DETX and DETY for each event in the final _common_clean file
| Quadrant A | 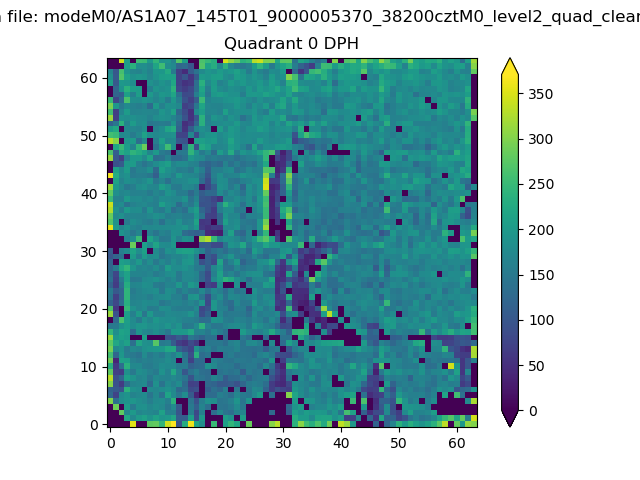 |
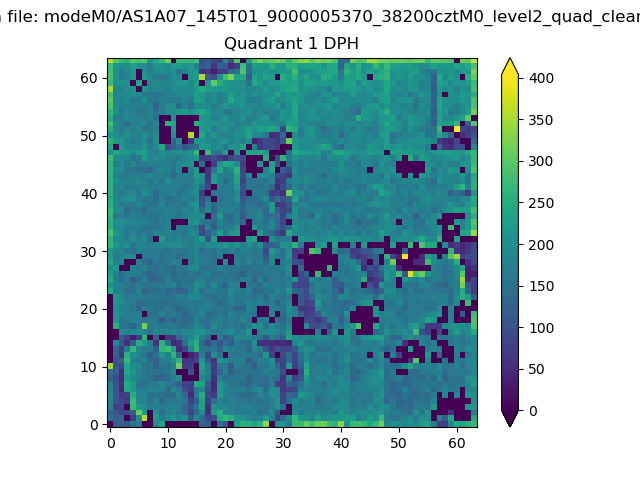 |
Quadrant B |
|---|---|---|---|
| Quadrant D |  |
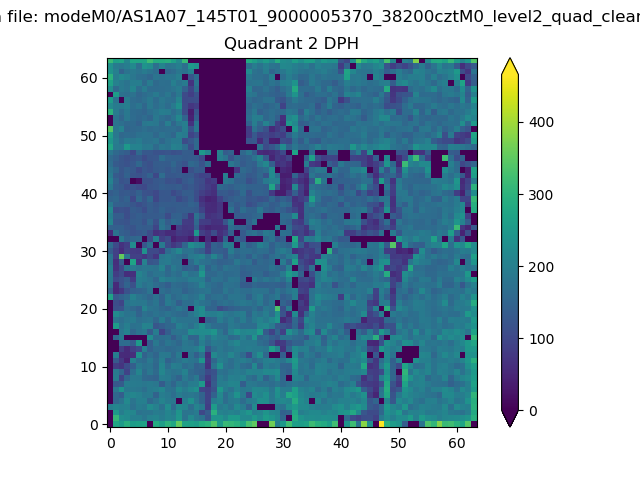 |
Quadrant C |
| Plot type | Count rate plots | Images |
|---|---|---|
| Comparison with Poisson distribution Blue bars denote a histogram of data divided into 1 sec bins. Red curve is a Poisson curve with rate = median count rate of data. |
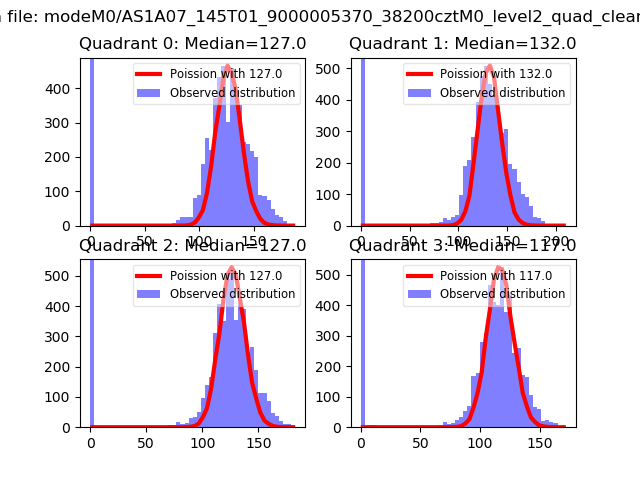 |
 |
| Quadrant-wise count rates Data is divided into 100 sec bins |
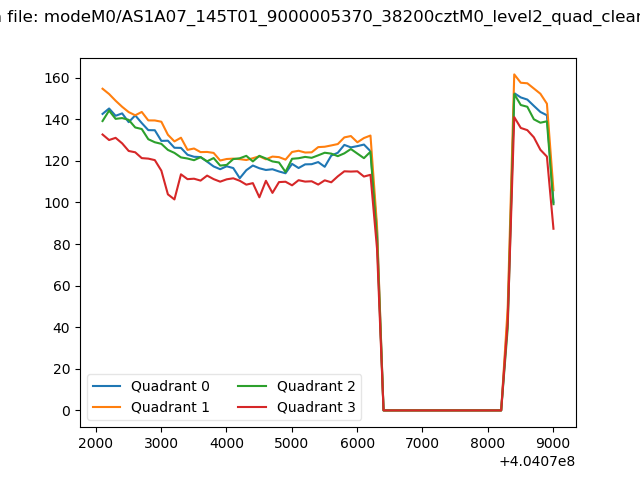 |
|
| Module-wise count rates for Quadrant A Data is divided into 100 sec bins |
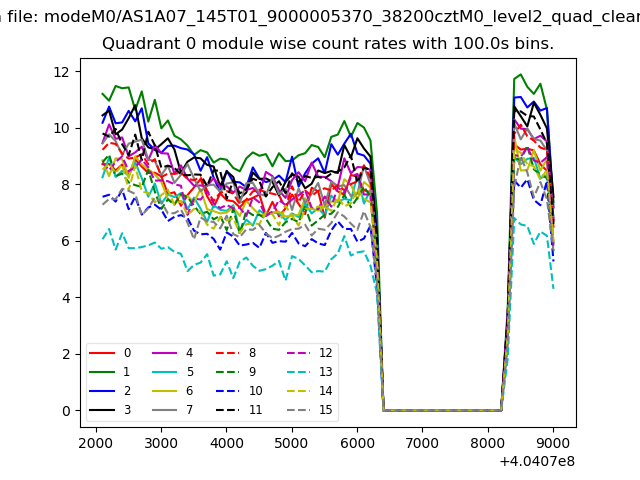 |
 |
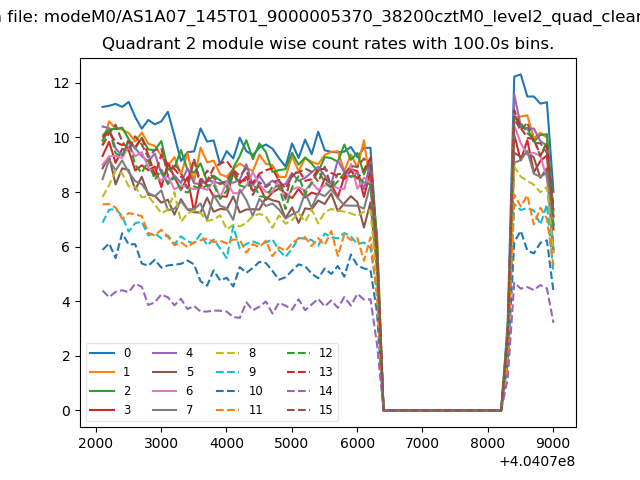
| Module-wise count rates for Quadrant B Data is divided into 100 sec bins |
 |
 |
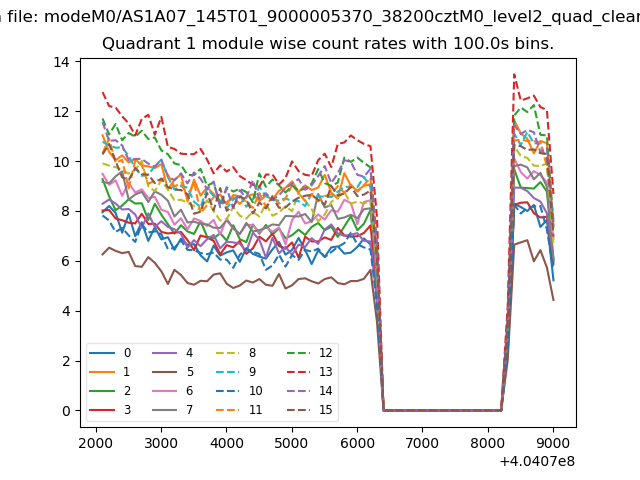
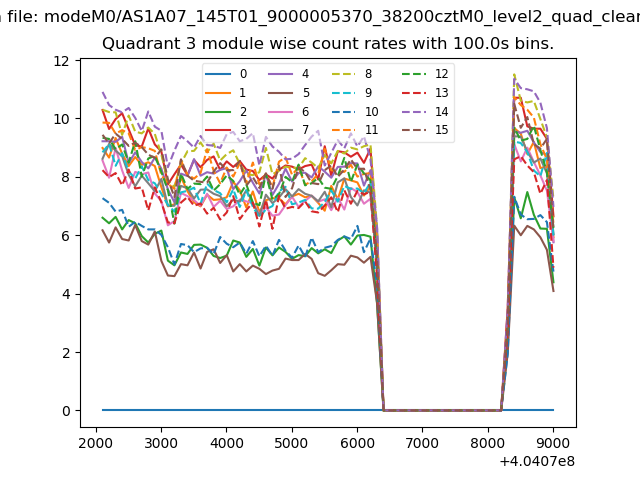
| Module-wise count rates for Quadrant C Data is divided into 100 sec bins |
 |
 |
| Module-wise count rates for Quadrant D Data is divided into 100 sec bins |
 |
 |
| Parameter | Plot |
|---|---|
| CZT HV Monitor |  |
| D_VDD | 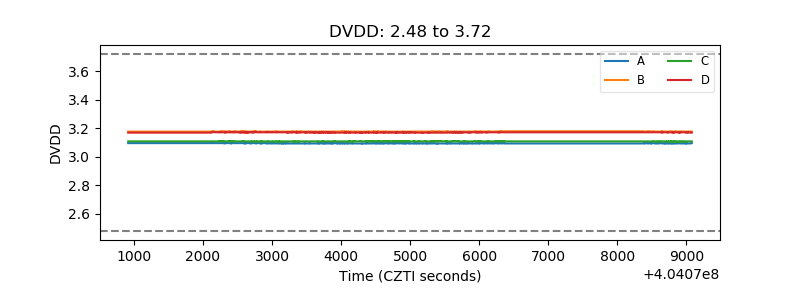 |
| Temperature 1 | 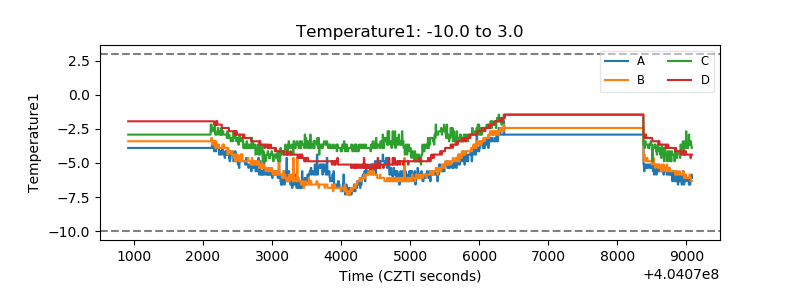 |
| Veto HV Monitor | 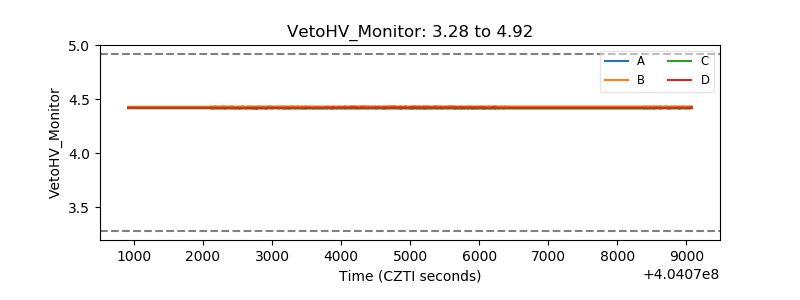 |
| Veto LLD | 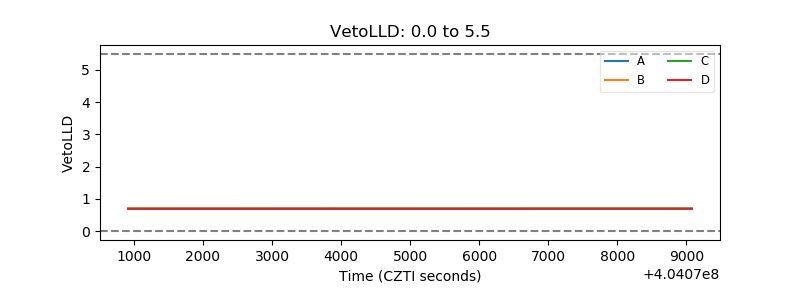 |
| Alpha Counter | 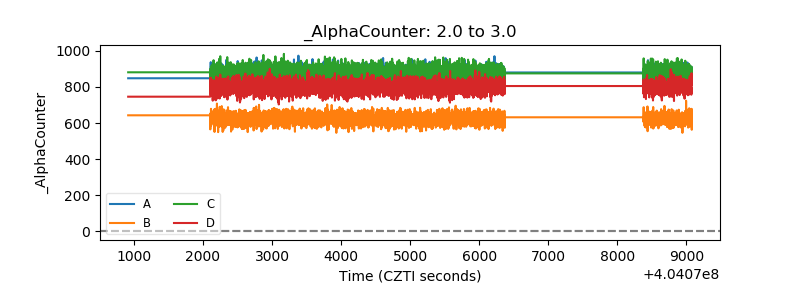 |
| _CPM_Rate | 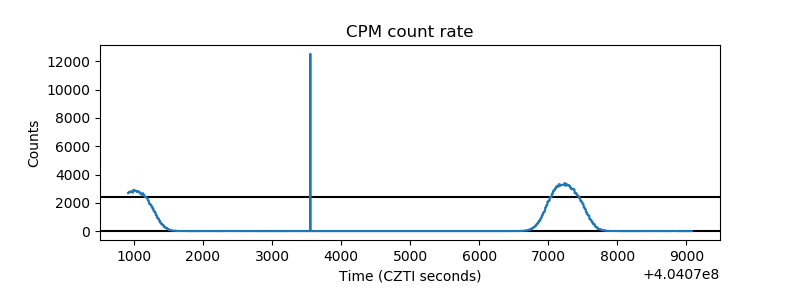 |
| CZT Counter | 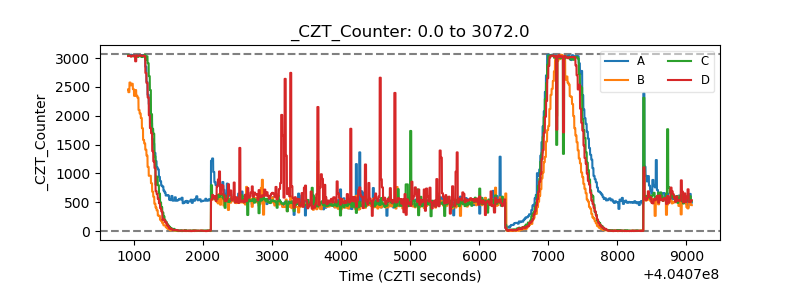 |
| +2.5 Volts monitor | 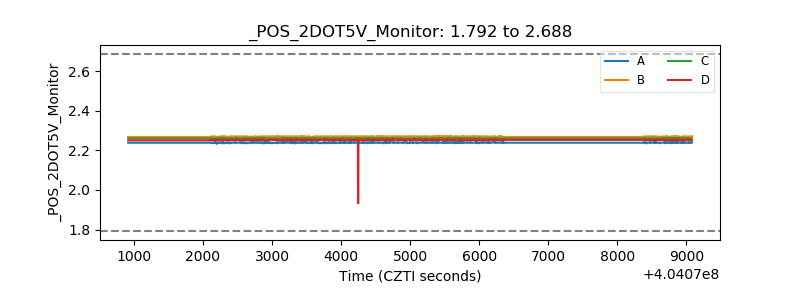 |
| +5 Volts monitor | 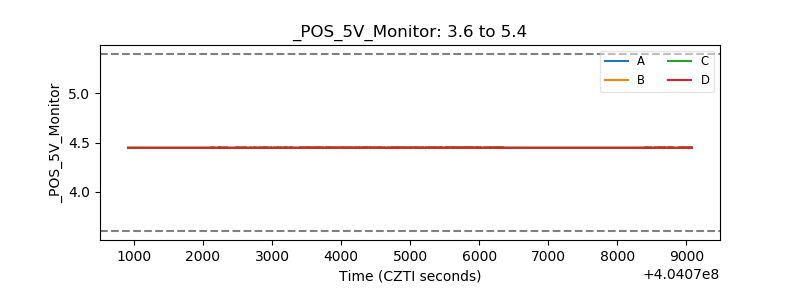 |
| _ROLL_ROT | 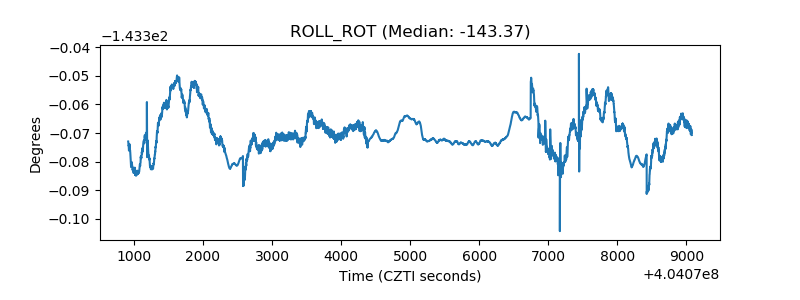 |
| _Roll_DEC | 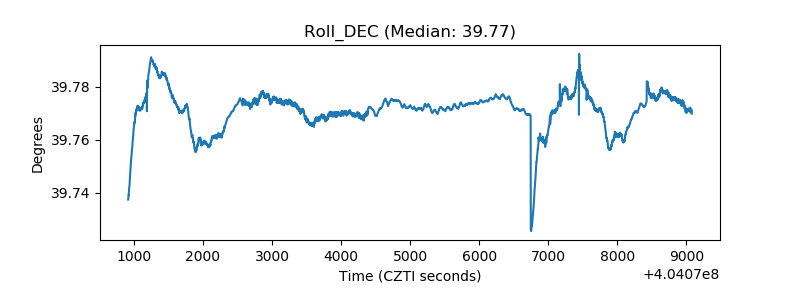 |
| _Roll_RA | 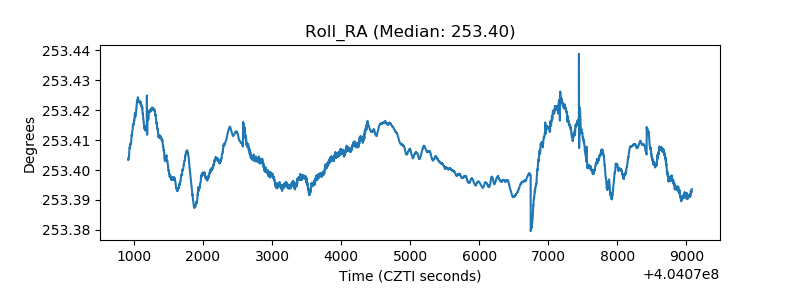 |
| Veto Counter | 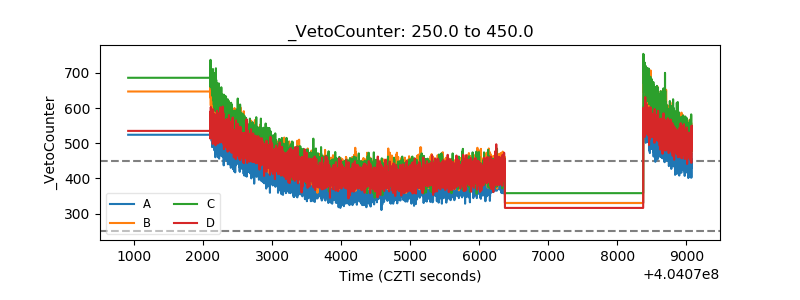 |