| Param | Original file | Final file |
|---|---|---|
| Filename | modeM0/AS1A07_145T01_9000005370_38201cztM0_level2.fits | modeM0/AS1A07_145T01_9000005370_38201cztM0_level2_quad_clean.evt |
| Size (bytes) | 343,200,960 | 99,921,600 |
| Size | 327.3 MB | 95.3 MB |
| Events in quadrant A | 2,934,466 | 682,401 |
| Events in quadrant B | 2,572,257 | 710,647 |
| Events in quadrant C | 3,012,780 | 668,196 |
| Events in quadrant D | 3,779,535 | 600,311 |
| Mode M9 | |||
|---|---|---|---|
| Quadrant | BADHDUFLAG | Total packets | Discarded packets |
| A | 0 | 32 | 0 |
| B | 0 | 32 | 0 |
| C | 0 | 32 | 0 |
| D | 0 | 33 | 0 |
| Mode SS | |||
|---|---|---|---|
| Quadrant | BADHDUFLAG | Total packets | Discarded packets |
| A | 0 | 106 | 0 |
| B | 0 | 106 | 0 |
| C | 0 | 106 | 0 |
| D | 0 | 106 | 0 |
| Mode M0 | |||
|---|---|---|---|
| Quadrant | BADHDUFLAG | Total packets | Discarded packets |
| A | 0 | 11860 | 3 |
| B | 0 | 10701 | 2 |
| C | 0 | 11935 | 2 |
| D | 0 | 14655 | 2 |
| Quadrant | Total seconds | Saturated seconds | Saturation percentage |
|---|---|---|---|
| A | 5204 | 17 | 0.326672% |
| B | 5204 | 20 | 0.384320% |
| C | 5204 | 108 | 2.075327% |
| D | 5204 | 272 | 5.226749% |
Noise dominated data is calculated using 1-second bins in cleaned event files. If a bin has >2000 counts, and if more than 50% of those come from <1% of pixels, then it is considered to be noise-dominated and hence unusable.
| Quadrant | # 1 sec bins | Bins with >0 counts | Bins with >2000 counts | High rate bins dominated by noise | Noise dominated (total time) | Noise dominated (detector-on time) | Marked lightcurve |
|---|---|---|---|---|---|---|---|
| A | 7296 | 5205 | 6 | 6 | 0.08% | 0.12% | 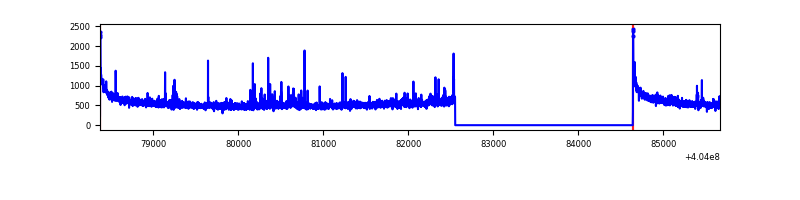 |
| B | 7296 | 5205 | 7 | 7 | 0.10% | 0.13% | 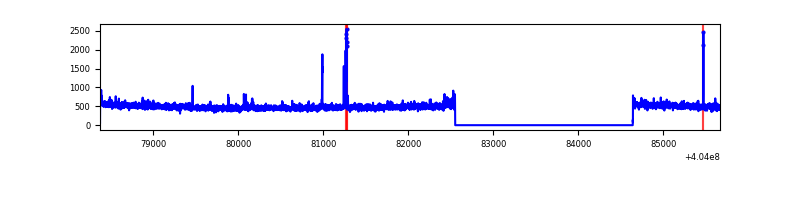 |
| C | 7296 | 5205 | 97 | 97 | 1.33% | 1.86% | 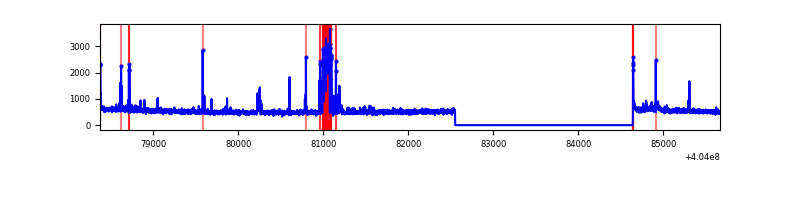 |
| D | 7296 | 5205 | 277 | 277 | 3.80% | 5.32% | 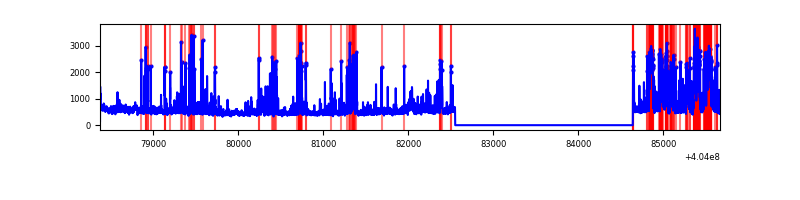 |
Top three noisy pixels from each quadrant. If the there are fewer than three noisy pixels in the level2.evt file, extra rows are filled as -1
| Pixel properties | Quadrant properties | ||||||
|---|---|---|---|---|---|---|---|
| Quadrant | DetID | PixID | Counts | Sigma | Mean | Median | Sigma |
| A | 10 | 83 | 362476 | 2867.98 | 628 | 617 | 126.2 |
| A | 12 | 189 | 79821 | 627.74 | 628 | 617 | 126.2 |
| A | 9 | 143 | 39235 | 306.07 | 628 | 617 | 126.2 |
| B | 5 | 172 | 48045 | 398.42 | 634 | 619 | 119.0 |
| B | 12 | 111 | 14379 | 115.59 | 634 | 619 | 119.0 |
| B | 11 | 111 | 13111 | 104.94 | 634 | 619 | 119.0 |
| C | 14 | 254 | 309092 | 2157.59 | 619 | 625 | 143.0 |
| C | 15 | 214 | 214903 | 1498.78 | 619 | 625 | 143.0 |
| C | 2 | 16 | 25451 | 173.65 | 619 | 625 | 143.0 |
| D | 2 | 250 | 551571 | 3770.97 | 609 | 593 | 146.1 |
| D | 13 | 171 | 259128 | 1769.45 | 609 | 593 | 146.1 |
| D | 13 | 249 | 178607 | 1218.35 | 609 | 593 | 146.1 |
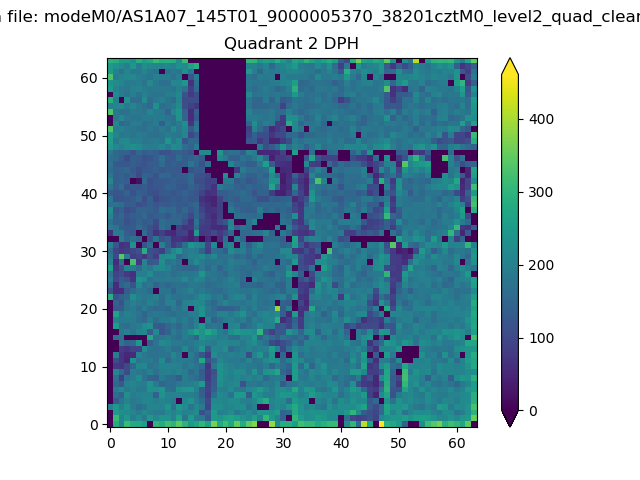
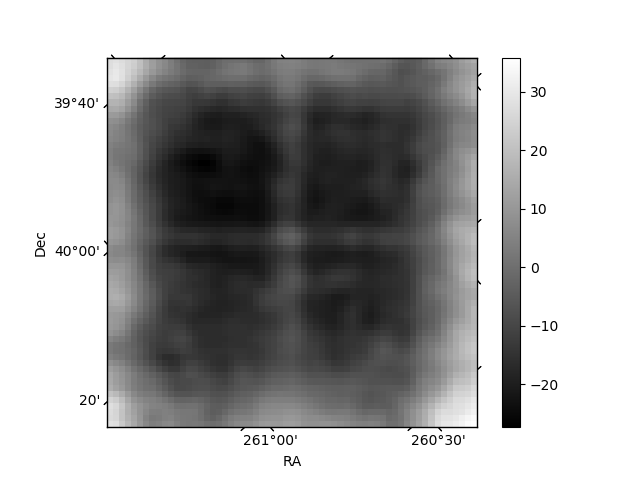
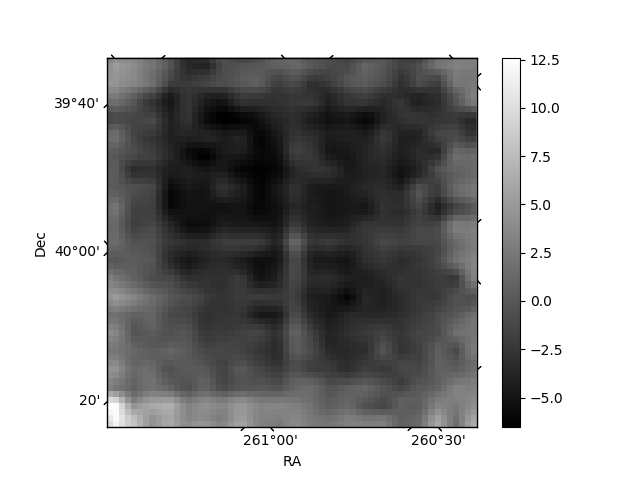
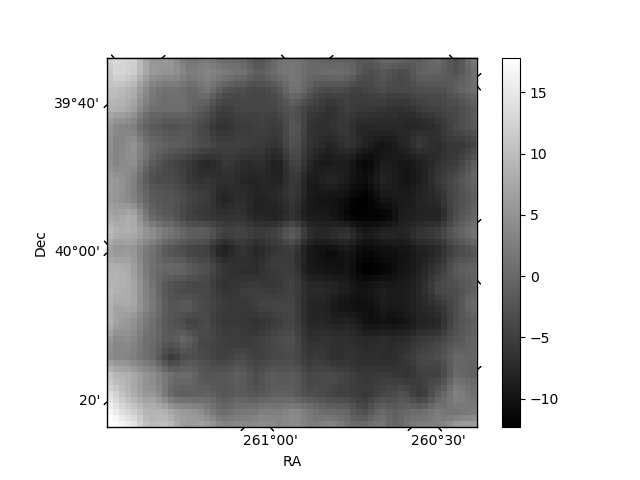
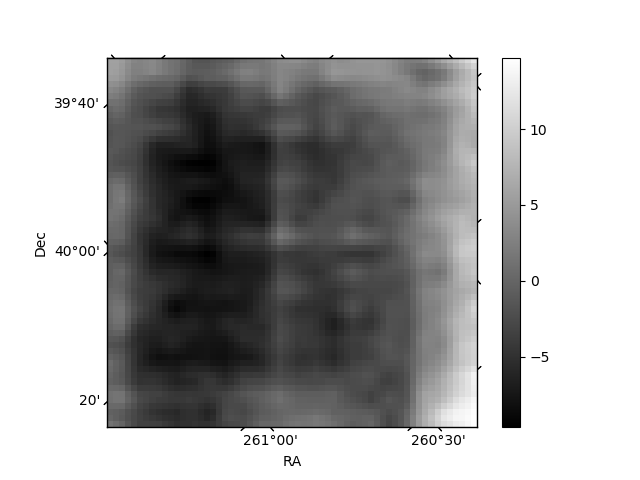
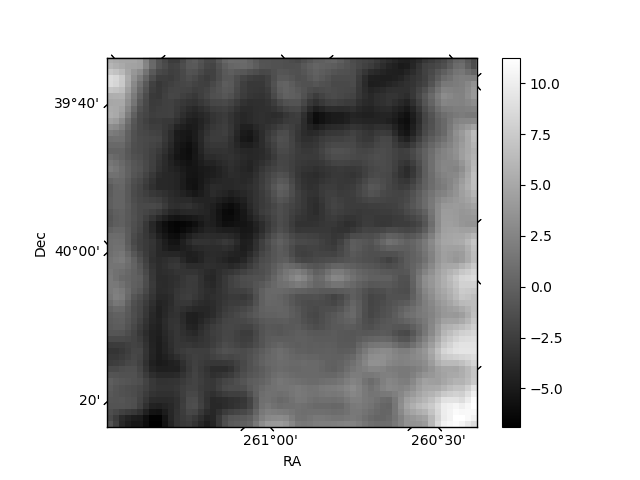
Histogram calculated using DETX and DETY for each event in the final _common_clean file
| Quadrant A | 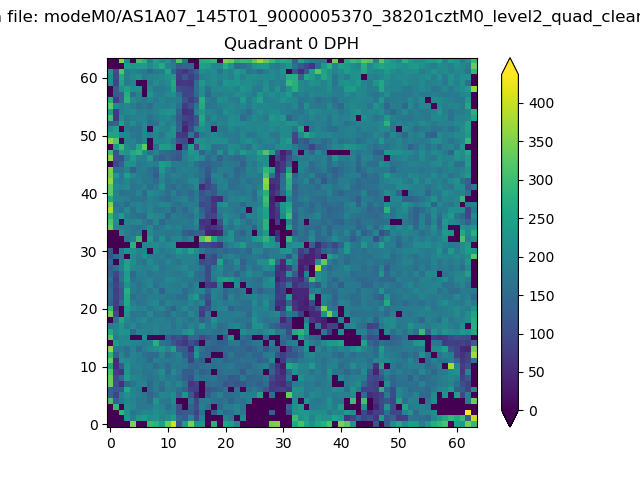 |
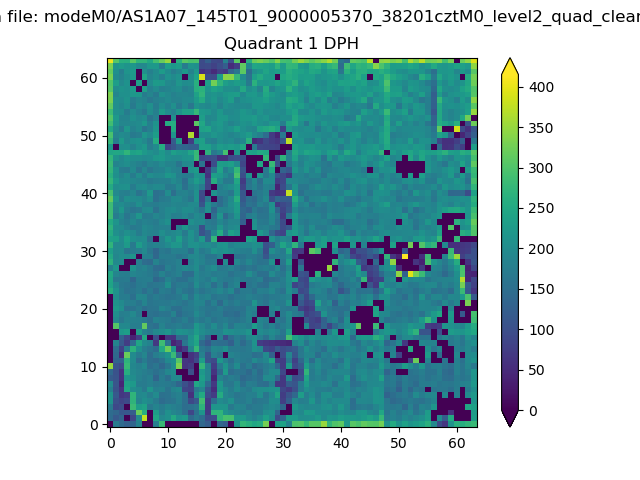 |
Quadrant B |
|---|---|---|---|
| Quadrant D | 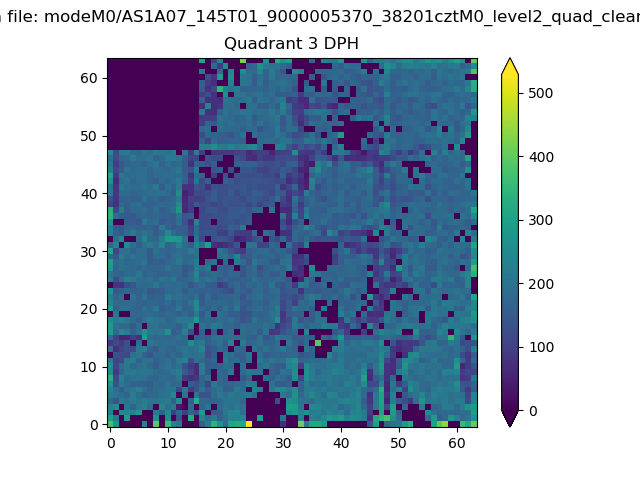 |
 |
Quadrant C |
| Plot type | Count rate plots | Images |
|---|---|---|
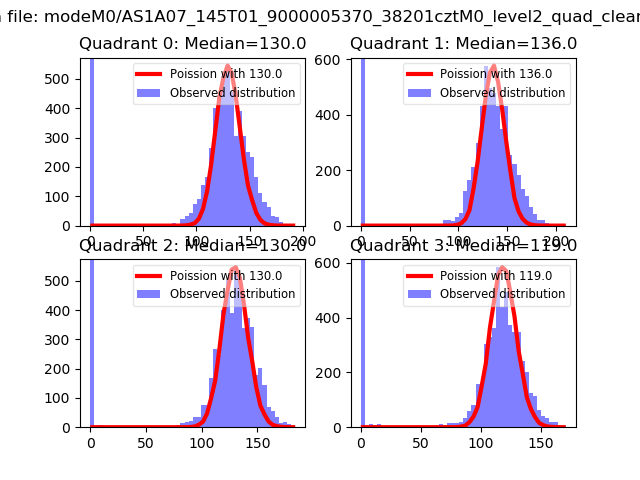
| Comparison with Poisson distribution Blue bars denote a histogram of data divided into 1 sec bins. Red curve is a Poisson curve with rate = median count rate of data. |
 |
 |
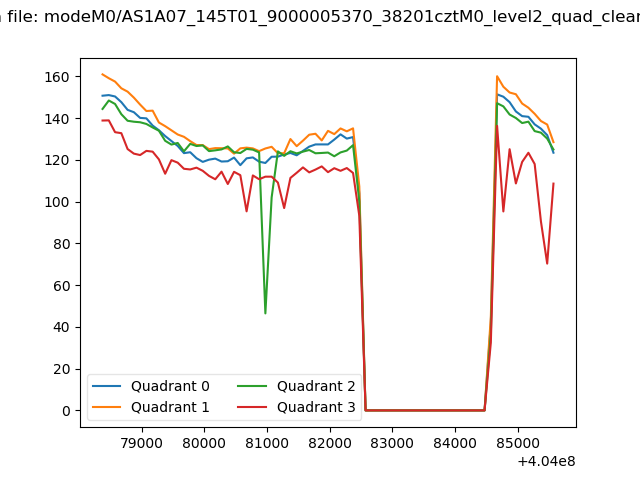
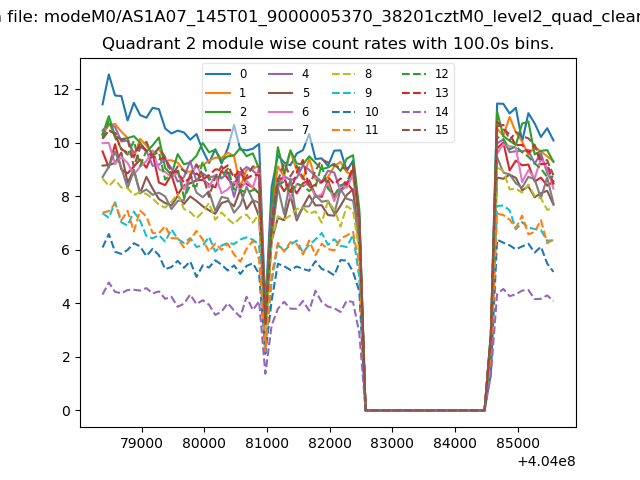
| Quadrant-wise count rates Data is divided into 100 sec bins |
 |
|
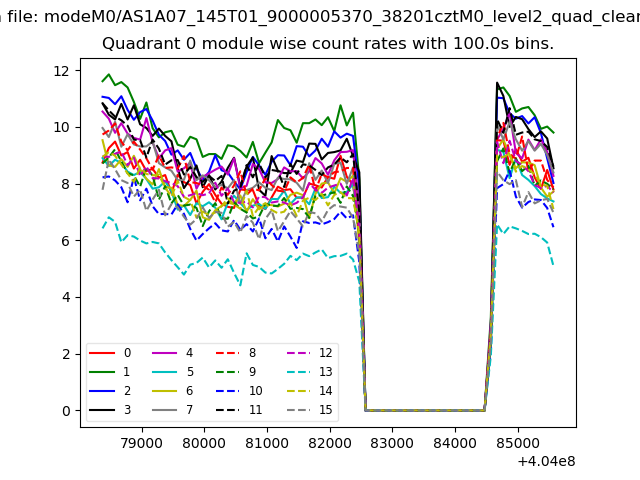
| Module-wise count rates for Quadrant A Data is divided into 100 sec bins |
 |
 |
| Module-wise count rates for Quadrant B Data is divided into 100 sec bins |
 |
 |
| Module-wise count rates for Quadrant C Data is divided into 100 sec bins |
 |
 |
| Module-wise count rates for Quadrant D Data is divided into 100 sec bins |
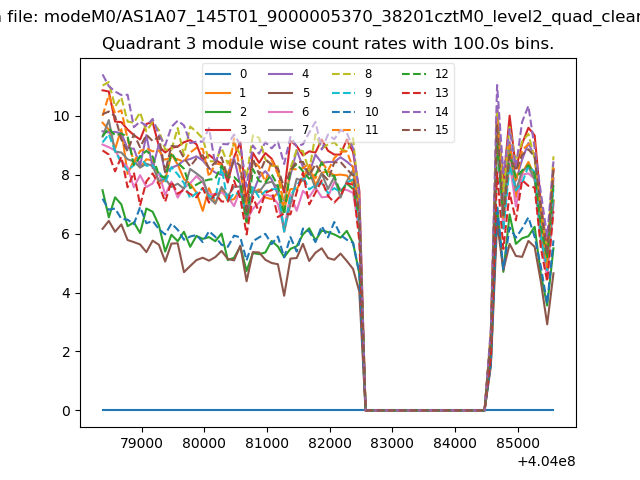 |
 |
| Parameter | Plot |
|---|---|
| CZT HV Monitor | 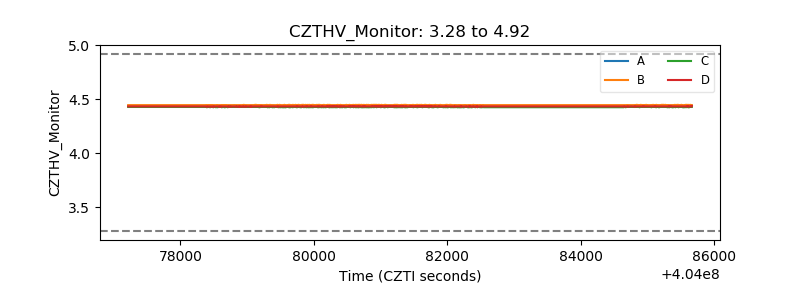 |
| D_VDD | 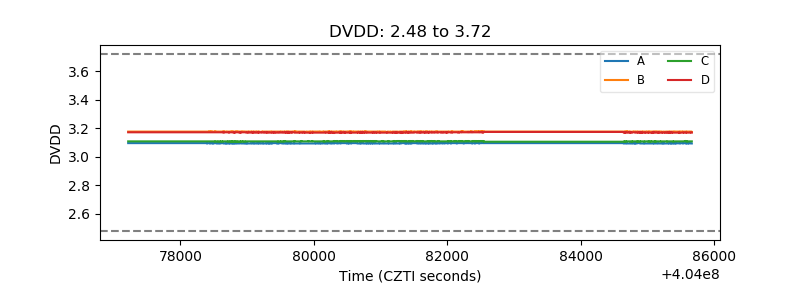 |
| Temperature 1 | 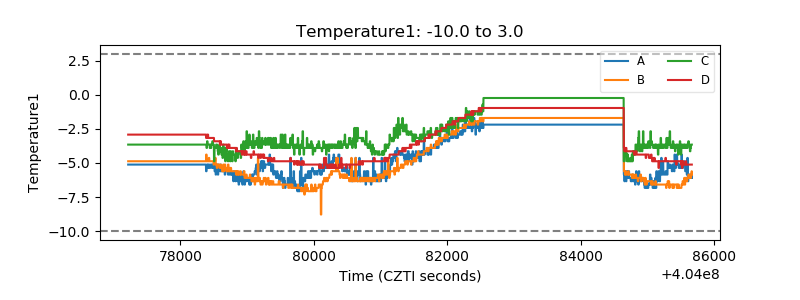 |
| Veto HV Monitor | 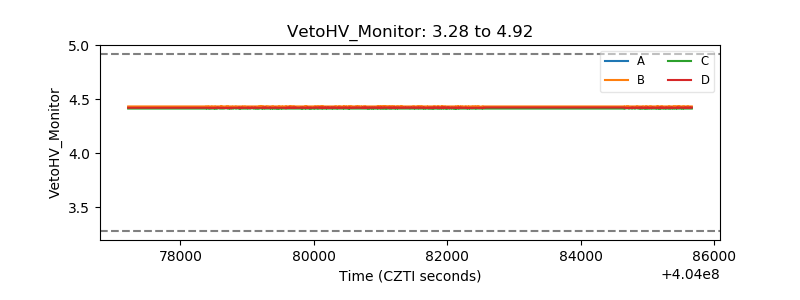 |
| Veto LLD |  |
| Alpha Counter | 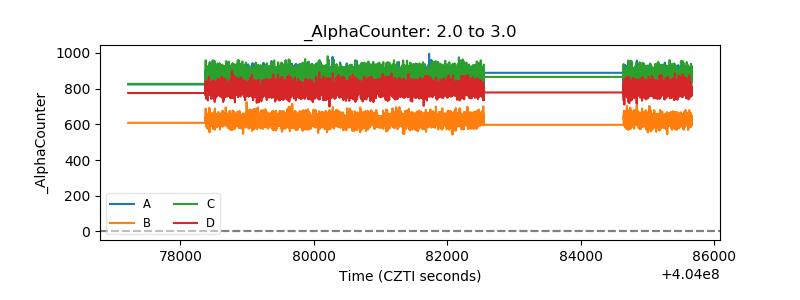 |
| _CPM_Rate | 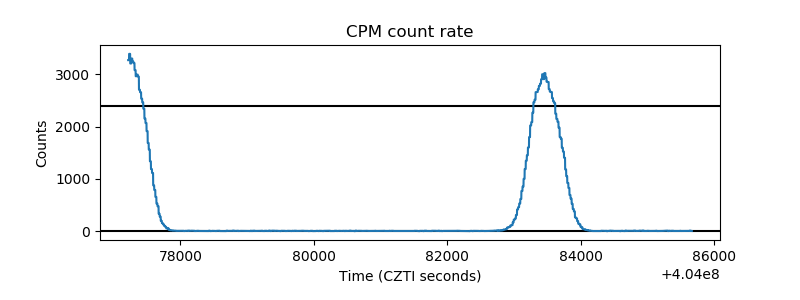 |
| CZT Counter | 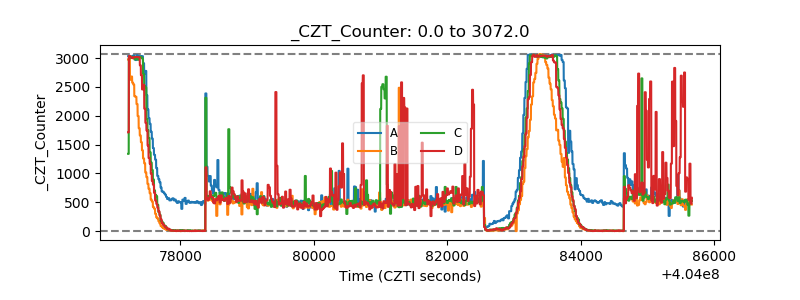 |
| +2.5 Volts monitor | 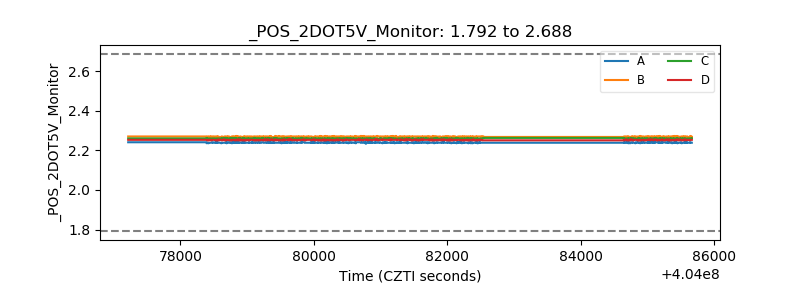 |
| +5 Volts monitor | 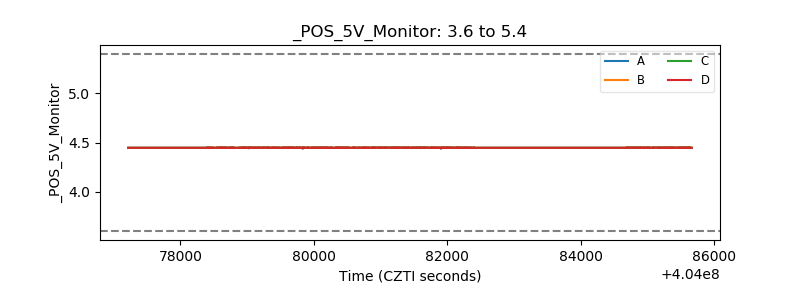 |
| _ROLL_ROT | 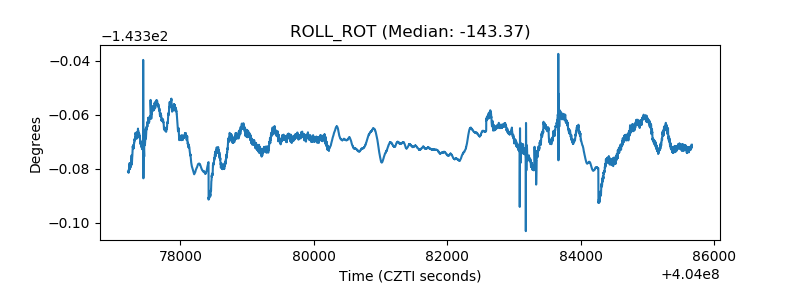 |
| _Roll_DEC | 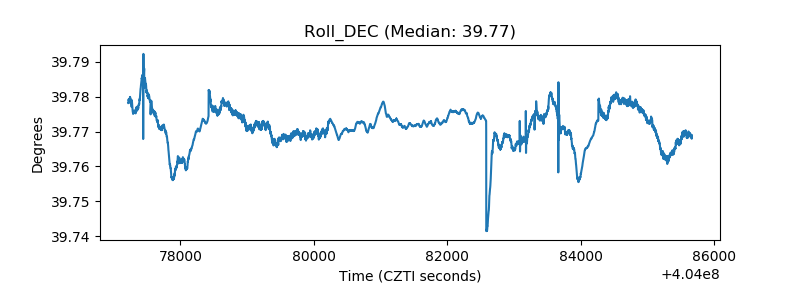 |
| _Roll_RA | 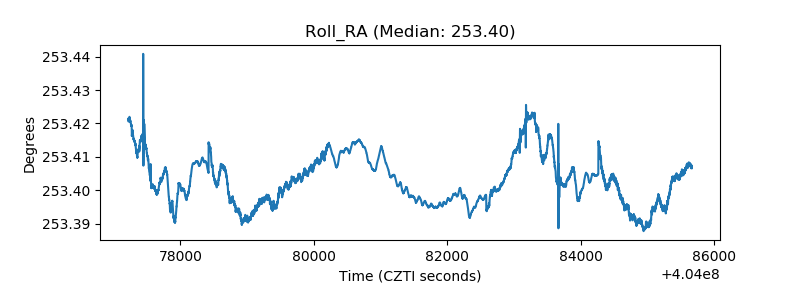 |
| Veto Counter | 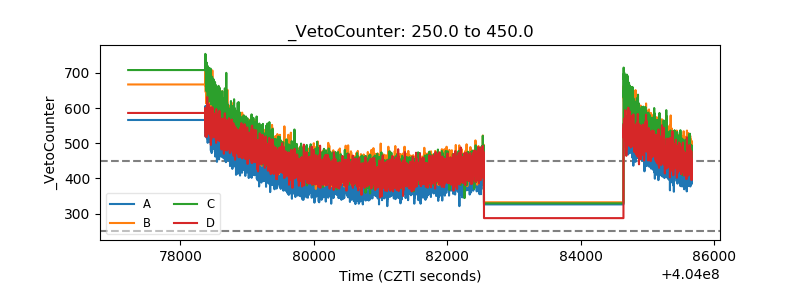 |