| Param | Original file | Final file |
|---|---|---|
| Filename | modeM0/AS1A07_145T01_9000005370_38202cztM0_level2.fits | modeM0/AS1A07_145T01_9000005370_38202cztM0_level2_quad_clean.evt |
| Size (bytes) | 349,488,000 | 97,473,600 |
| Size | 333.3 MB | 93.0 MB |
| Events in quadrant A | 2,976,740 | 667,265 |
| Events in quadrant B | 2,558,312 | 692,813 |
| Events in quadrant C | 3,227,156 | 644,526 |
| Events in quadrant D | 3,771,326 | 584,288 |
| Mode M9 | |||
|---|---|---|---|
| Quadrant | BADHDUFLAG | Total packets | Discarded packets |
| A | 0 | 33 | 0 |
| B | 0 | 33 | 0 |
| C | 0 | 33 | 0 |
| D | 0 | 34 | 0 |
| Mode SS | |||
|---|---|---|---|
| Quadrant | BADHDUFLAG | Total packets | Discarded packets |
| A | 0 | 106 | 0 |
| B | 0 | 106 | 0 |
| C | 0 | 106 | 0 |
| D | 0 | 106 | 0 |
| Mode M0 | |||
|---|---|---|---|
| Quadrant | BADHDUFLAG | Total packets | Discarded packets |
| A | 0 | 11966 | 3 |
| B | 0 | 10718 | 2 |
| C | 0 | 12575 | 2 |
| D | 0 | 14583 | 2 |
| Quadrant | Total seconds | Saturated seconds | Saturation percentage |
|---|---|---|---|
| A | 5181 | 22 | 0.424628% |
| B | 5181 | 27 | 0.521135% |
| C | 5181 | 174 | 3.358425% |
| D | 5181 | 266 | 5.134144% |
Noise dominated data is calculated using 1-second bins in cleaned event files. If a bin has >2000 counts, and if more than 50% of those come from <1% of pixels, then it is considered to be noise-dominated and hence unusable.
| Quadrant | # 1 sec bins | Bins with >0 counts | Bins with >2000 counts | High rate bins dominated by noise | Noise dominated (total time) | Noise dominated (detector-on time) | Marked lightcurve |
|---|---|---|---|---|---|---|---|
| A | 7334 | 5182 | 14 | 14 | 0.19% | 0.27% | 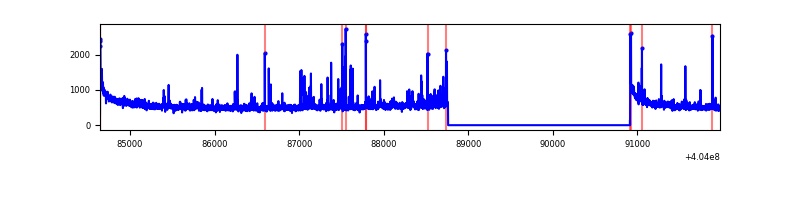 |
| B | 7334 | 5181 | 18 | 18 | 0.25% | 0.35% | 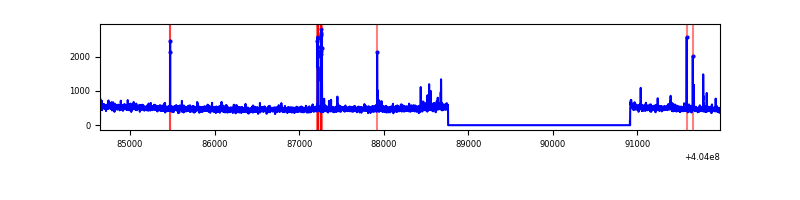 |
| C | 7334 | 5182 | 173 | 173 | 2.36% | 3.34% | 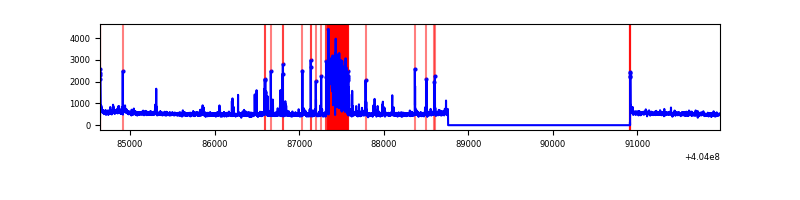 |
| D | 7334 | 5181 | 285 | 285 | 3.89% | 5.50% | 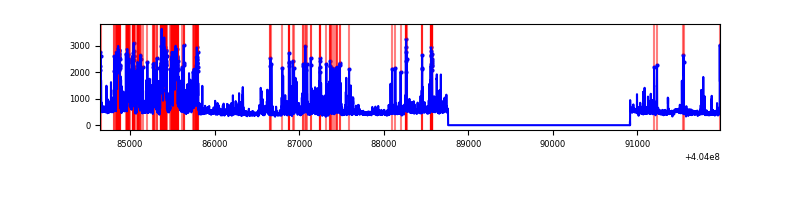 |
Top three noisy pixels from each quadrant. If the there are fewer than three noisy pixels in the level2.evt file, extra rows are filled as -1
| Pixel properties | Quadrant properties | ||||||
|---|---|---|---|---|---|---|---|
| Quadrant | DetID | PixID | Counts | Sigma | Mean | Median | Sigma |
| A | 10 | 83 | 364424 | 2922.98 | 618 | 607 | 124.5 |
| A | 9 | 143 | 134101 | 1072.52 | 618 | 607 | 124.5 |
| A | 12 | 189 | 55397 | 440.19 | 618 | 607 | 124.5 |
| B | 5 | 172 | 72225 | 612.55 | 623 | 606 | 116.9 |
| B | 0 | 230 | 16732 | 137.92 | 623 | 606 | 116.9 |
| B | 12 | 111 | 14490 | 118.75 | 623 | 606 | 116.9 |
| C | 2 | 16 | 540739 | 3903.12 | 601 | 607 | 138.4 |
| C | 15 | 214 | 213420 | 1537.84 | 601 | 607 | 138.4 |
| C | 14 | 254 | 88378 | 634.25 | 601 | 607 | 138.4 |
| D | 2 | 250 | 633675 | 4398.49 | 593 | 576 | 143.9 |
| D | 13 | 171 | 254358 | 1763.17 | 593 | 576 | 143.9 |
| D | 13 | 249 | 169096 | 1170.8 | 593 | 576 | 143.9 |
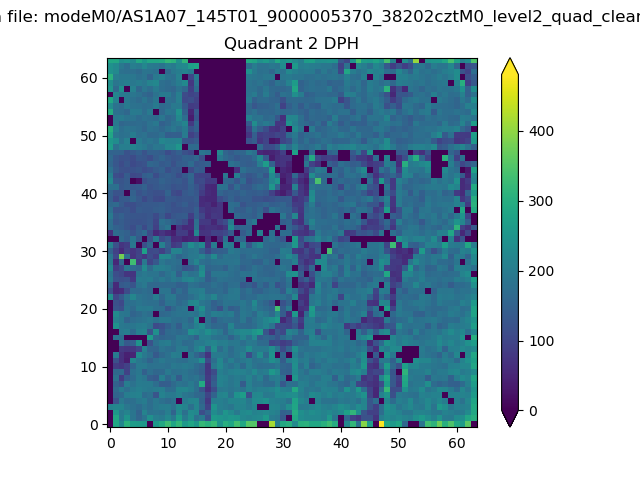
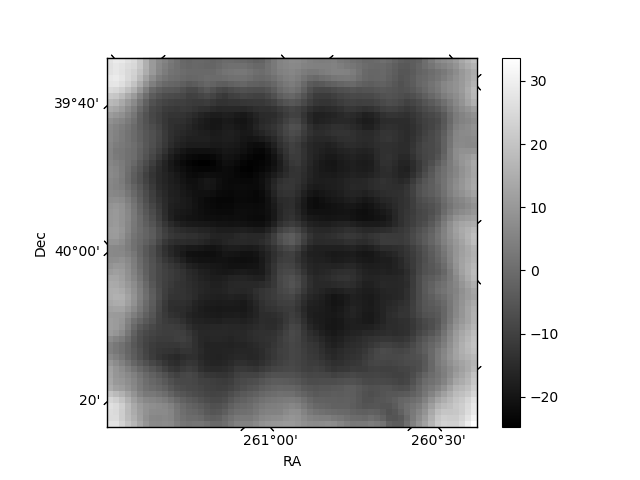
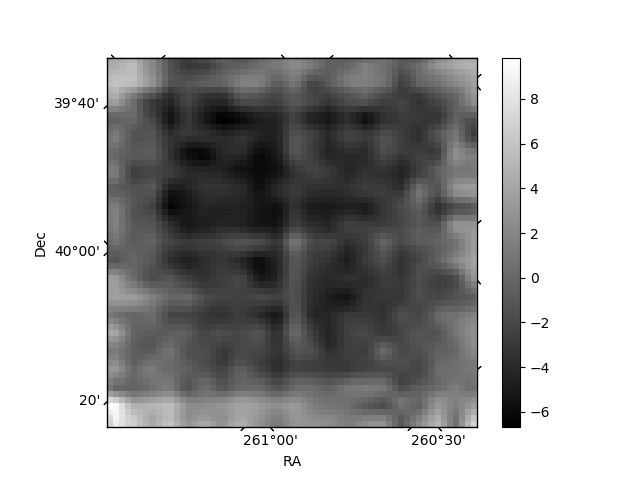
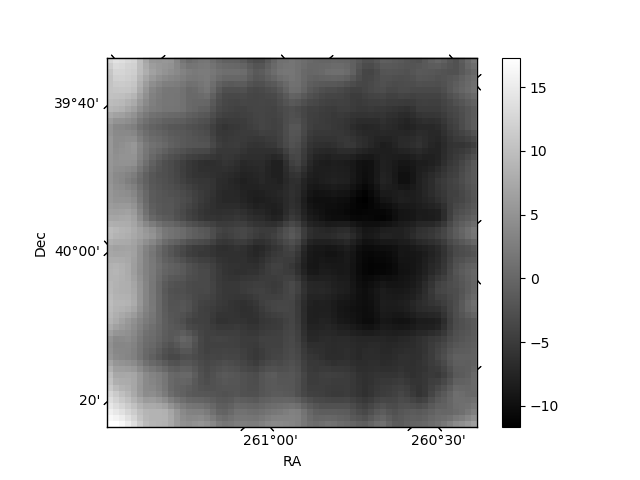
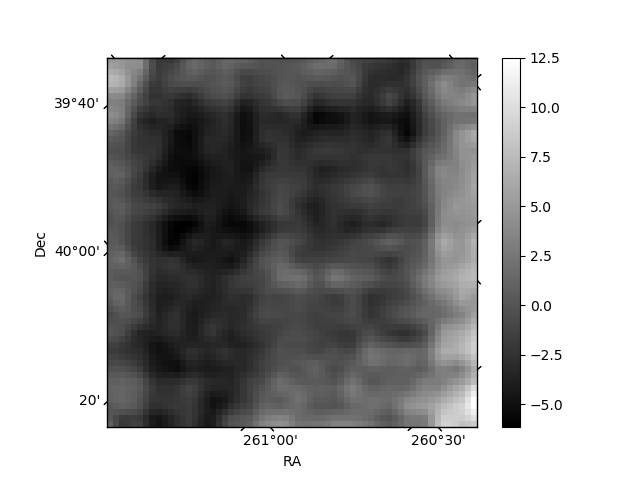
Histogram calculated using DETX and DETY for each event in the final _common_clean file
| Quadrant A | 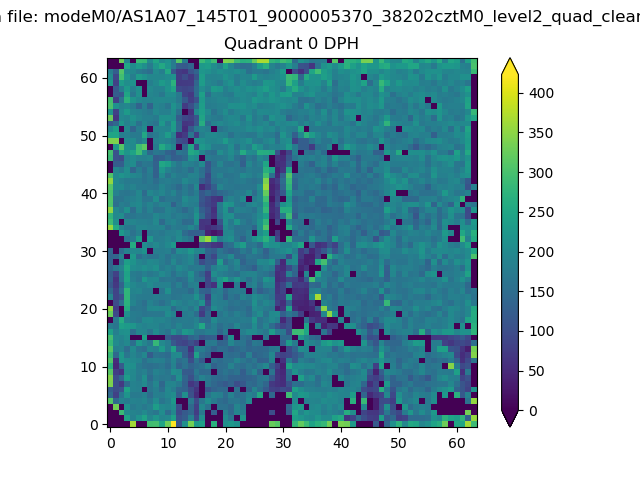 |
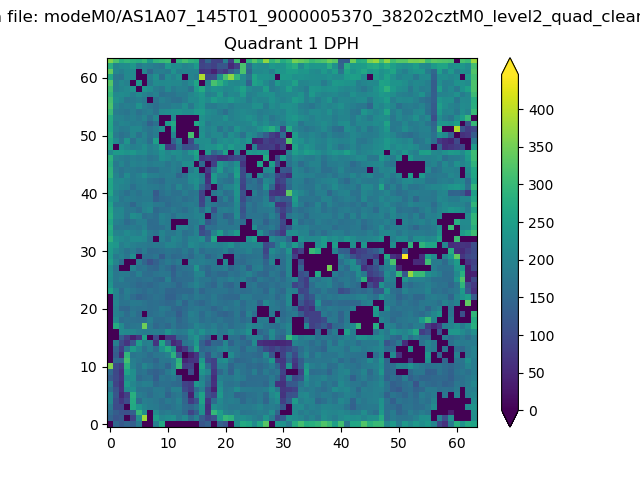 |
Quadrant B |
|---|---|---|---|
| Quadrant D | 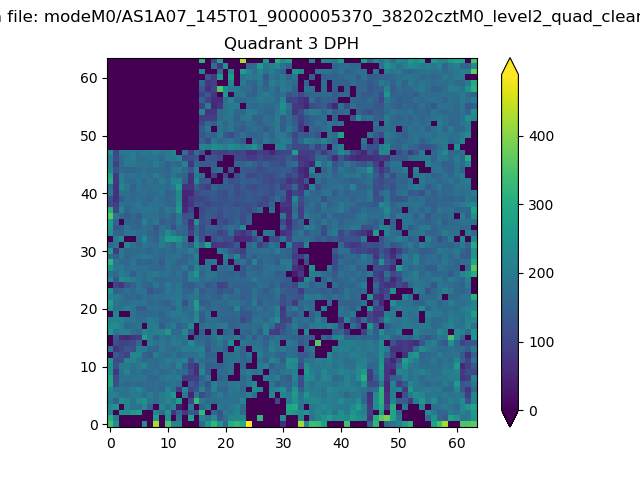 |
 |
Quadrant C |
| Plot type | Count rate plots | Images |
|---|---|---|
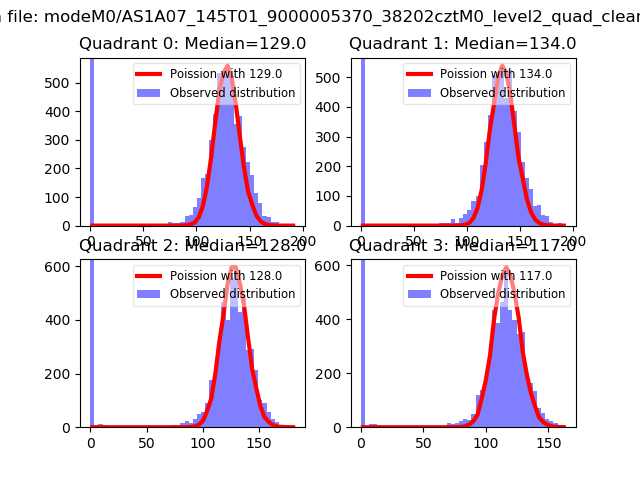
| Comparison with Poisson distribution Blue bars denote a histogram of data divided into 1 sec bins. Red curve is a Poisson curve with rate = median count rate of data. |
 |
 |
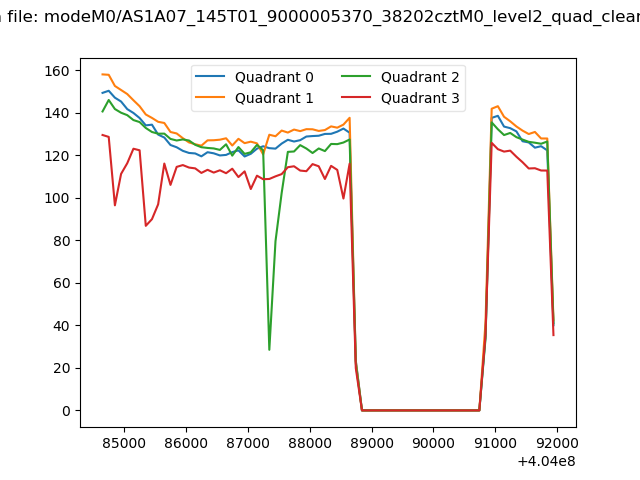
| Quadrant-wise count rates Data is divided into 100 sec bins |
 |
|
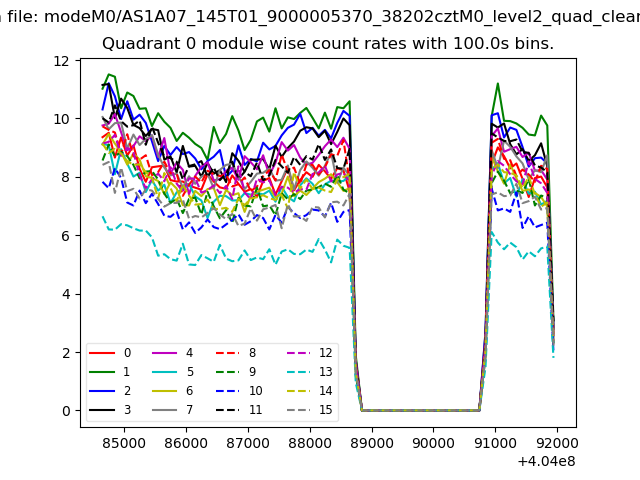
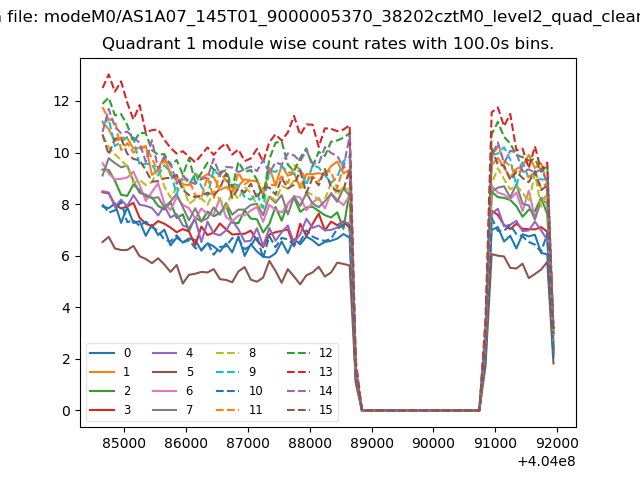
| Module-wise count rates for Quadrant A Data is divided into 100 sec bins |
 |
 |
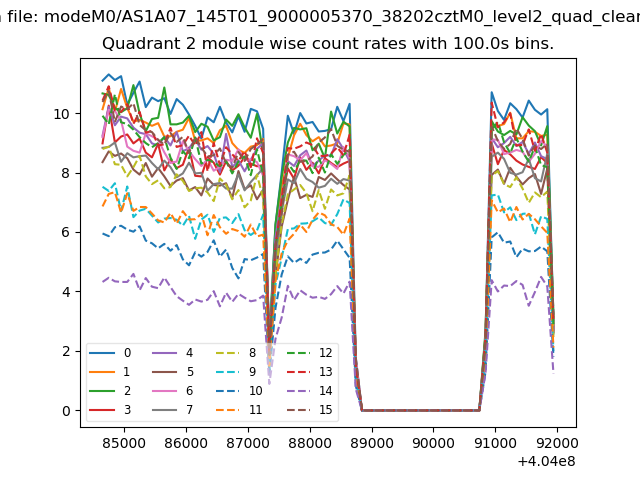
| Module-wise count rates for Quadrant B Data is divided into 100 sec bins |
 |
 |
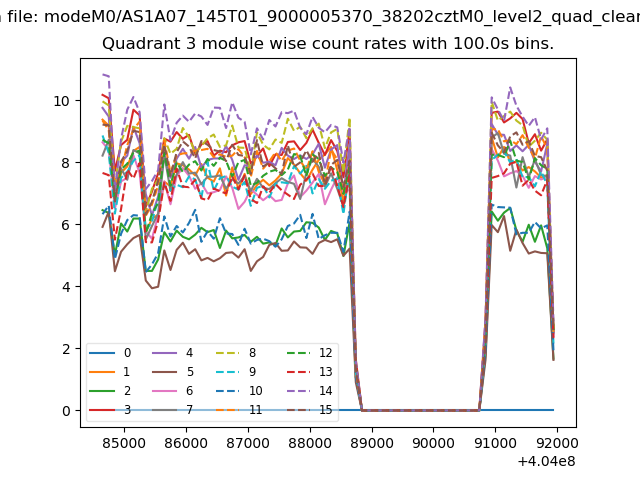
| Module-wise count rates for Quadrant C Data is divided into 100 sec bins |
 |
 |
| Module-wise count rates for Quadrant D Data is divided into 100 sec bins |
 |
 |
| Parameter | Plot |
|---|---|
| CZT HV Monitor | 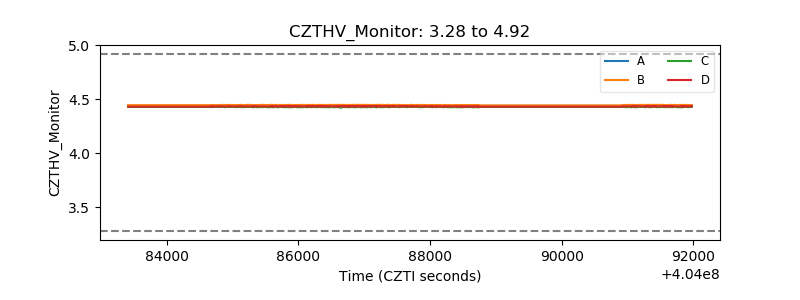 |
| D_VDD | 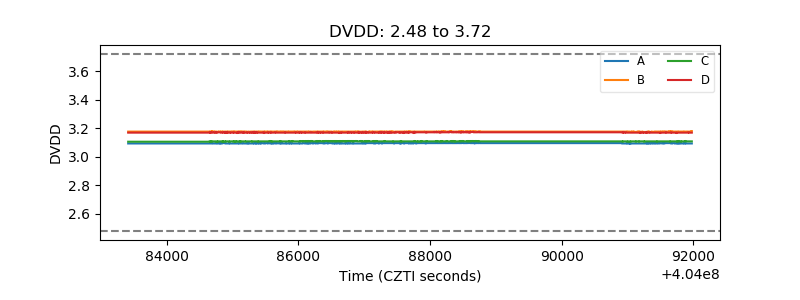 |
| Temperature 1 | 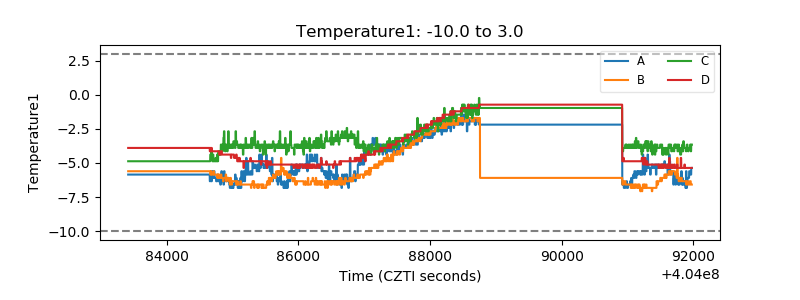 |
| Veto HV Monitor | 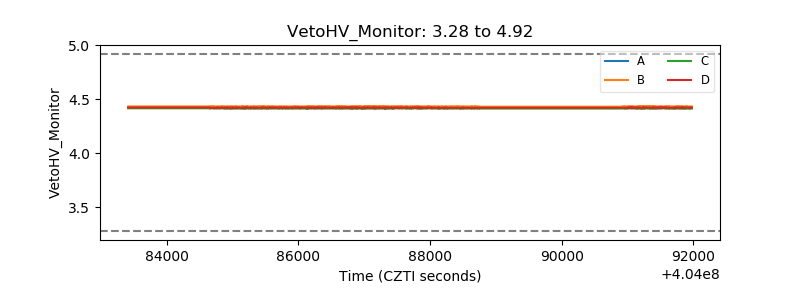 |
| Veto LLD | 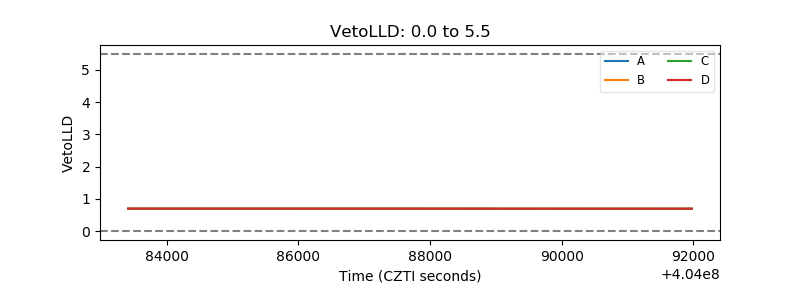 |
| Alpha Counter | 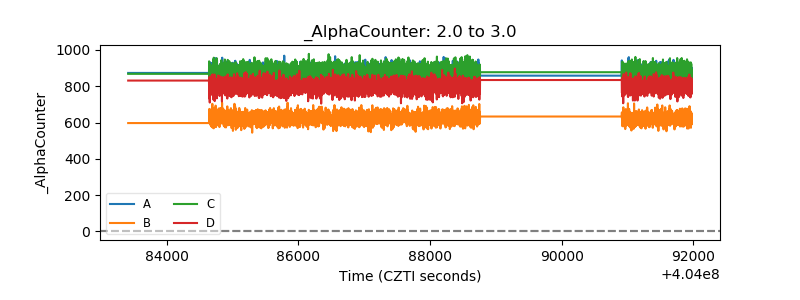 |
| _CPM_Rate | 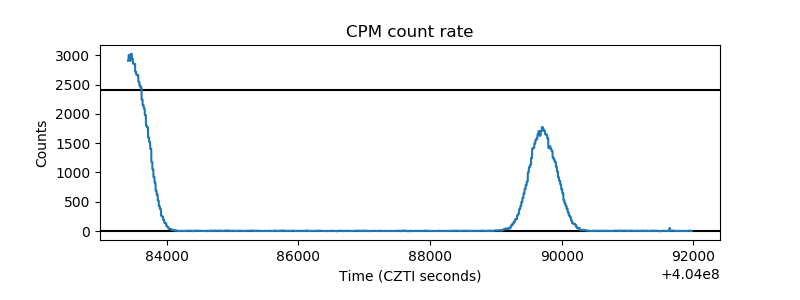 |
| CZT Counter | 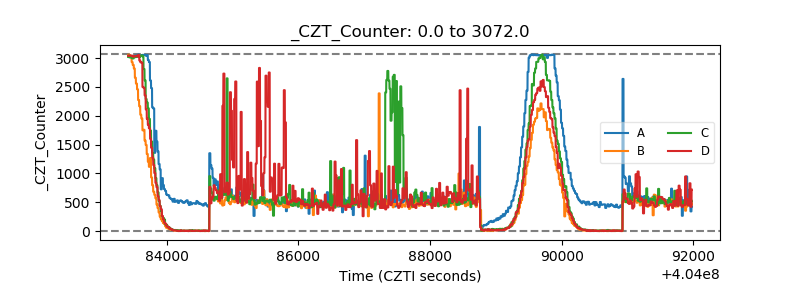 |
| +2.5 Volts monitor | 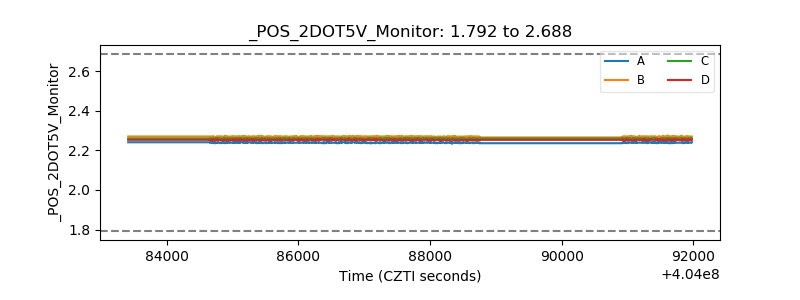 |
| +5 Volts monitor | 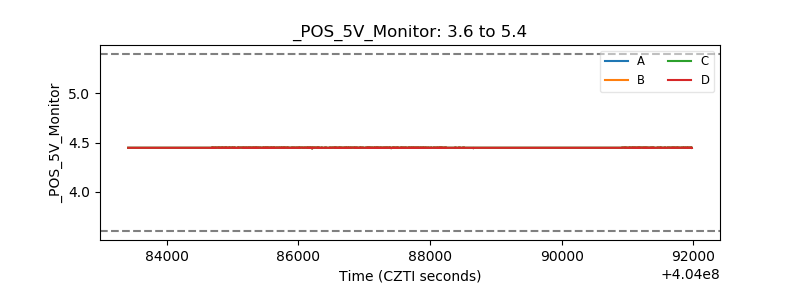 |
| _ROLL_ROT | 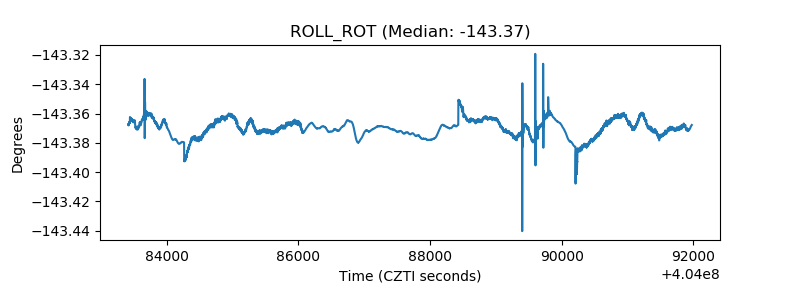 |
| _Roll_DEC | 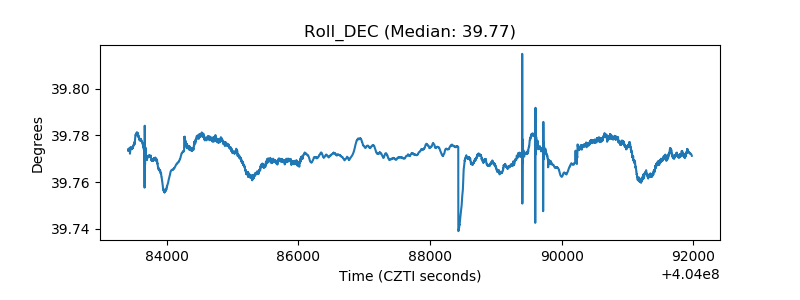 |
| _Roll_RA | 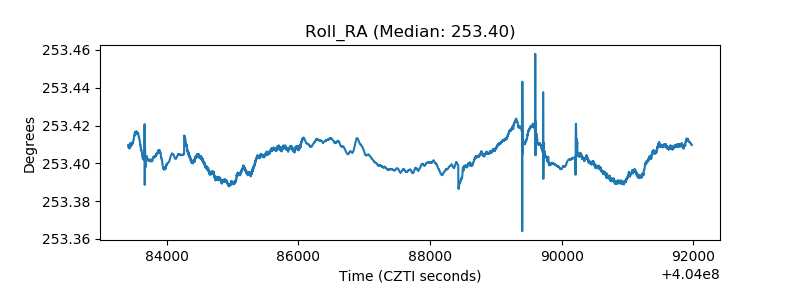 |
| Veto Counter | 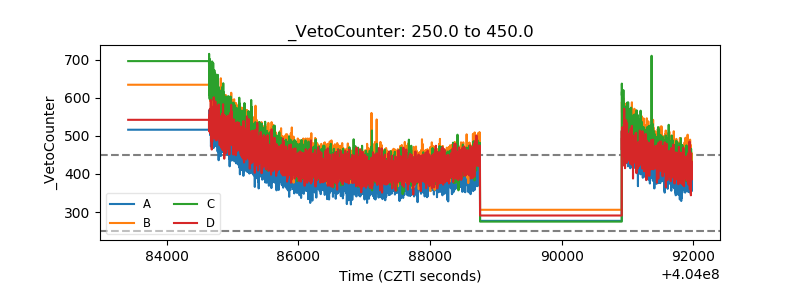 |