| Param | Original file | Final file |
|---|---|---|
| Filename | modeM0/AS1A07_145T01_9000005370_38204cztM0_level2.fits | modeM0/AS1A07_145T01_9000005370_38204cztM0_level2_quad_clean.evt |
| Size (bytes) | 301,487,040 | 91,065,600 |
| Size | 287.5 MB | 86.8 MB |
| Events in quadrant A | 2,807,632 | 608,931 |
| Events in quadrant B | 2,522,979 | 628,341 |
| Events in quadrant C | 2,596,965 | 602,080 |
| Events in quadrant D | 2,826,455 | 553,467 |
| Mode M9 | |||
|---|---|---|---|
| Quadrant | BADHDUFLAG | Total packets | Discarded packets |
| A | 0 | 32 | 0 |
| B | 0 | 32 | 0 |
| C | 0 | 32 | 0 |
| D | 0 | 33 | 0 |
| Mode SS | |||
|---|---|---|---|
| Quadrant | BADHDUFLAG | Total packets | Discarded packets |
| A | 0 | 106 | 0 |
| B | 0 | 106 | 0 |
| C | 0 | 106 | 0 |
| D | 0 | 106 | 0 |
| Mode M0 | |||
|---|---|---|---|
| Quadrant | BADHDUFLAG | Total packets | Discarded packets |
| A | 0 | 11461 | 3 |
| B | 0 | 10942 | 2 |
| C | 0 | 10877 | 2 |
| D | 0 | 11782 | 2 |
| Quadrant | Total seconds | Saturated seconds | Saturation percentage |
|---|---|---|---|
| A | 5208 | 10 | 0.192012% |
| B | 5208 | 26 | 0.499232% |
| C | 5208 | 17 | 0.326421% |
| D | 5208 | 60 | 1.152074% |
Noise dominated data is calculated using 1-second bins in cleaned event files. If a bin has >2000 counts, and if more than 50% of those come from <1% of pixels, then it is considered to be noise-dominated and hence unusable.
| Quadrant | # 1 sec bins | Bins with >0 counts | Bins with >2000 counts | High rate bins dominated by noise | Noise dominated (total time) | Noise dominated (detector-on time) | Marked lightcurve |
|---|---|---|---|---|---|---|---|
| A | 7121 | 5209 | 5 | 5 | 0.07% | 0.10% | 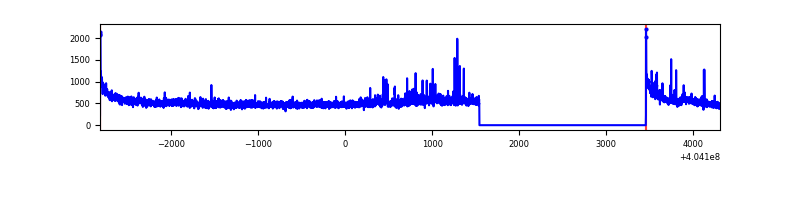 |
| B | 7121 | 5209 | 19 | 19 | 0.27% | 0.36% | 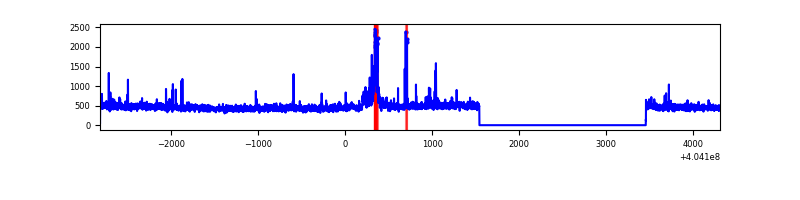 |
| C | 7121 | 5209 | 12 | 12 | 0.17% | 0.23% | 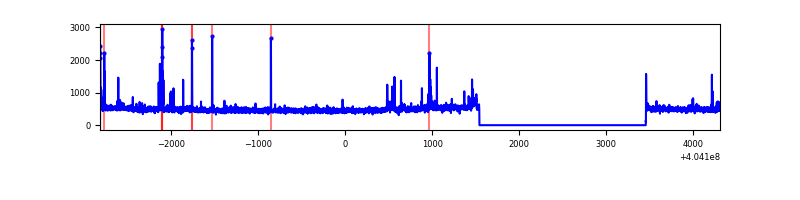 |
| D | 7121 | 5209 | 49 | 49 | 0.69% | 0.94% | 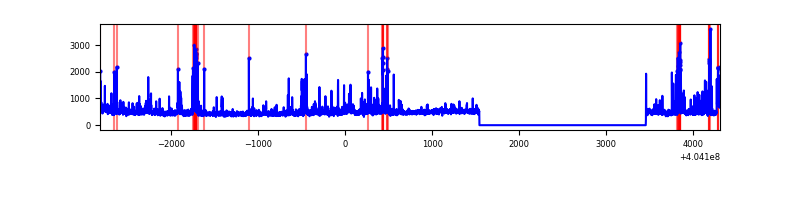 |
Top three noisy pixels from each quadrant. If the there are fewer than three noisy pixels in the level2.evt file, extra rows are filled as -1
| Pixel properties | Quadrant properties | ||||||
|---|---|---|---|---|---|---|---|
| Quadrant | DetID | PixID | Counts | Sigma | Mean | Median | Sigma |
| A | 10 | 83 | 365975 | 3046.67 | 590 | 576 | 119.9 |
| A | 12 | 189 | 80881 | 669.58 | 590 | 576 | 119.9 |
| A | 9 | 143 | 30507 | 249.56 | 590 | 576 | 119.9 |
| B | 5 | 184 | 120993 | 1052.92 | 590 | 575 | 114.4 |
| B | 0 | 229 | 39486 | 340.23 | 590 | 575 | 114.4 |
| B | 5 | 172 | 19196 | 162.82 | 590 | 575 | 114.4 |
| C | 15 | 214 | 217867 | 1616.66 | 574 | 579 | 134.4 |
| C | 14 | 254 | 85125 | 629.04 | 574 | 579 | 134.4 |
| C | 2 | 16 | 26461 | 192.57 | 574 | 579 | 134.4 |
| D | 13 | 171 | 245338 | 1770.0 | 572 | 556 | 138.3 |
| D | 2 | 16 | 69835 | 500.95 | 572 | 556 | 138.3 |
| D | 13 | 249 | 68350 | 490.21 | 572 | 556 | 138.3 |
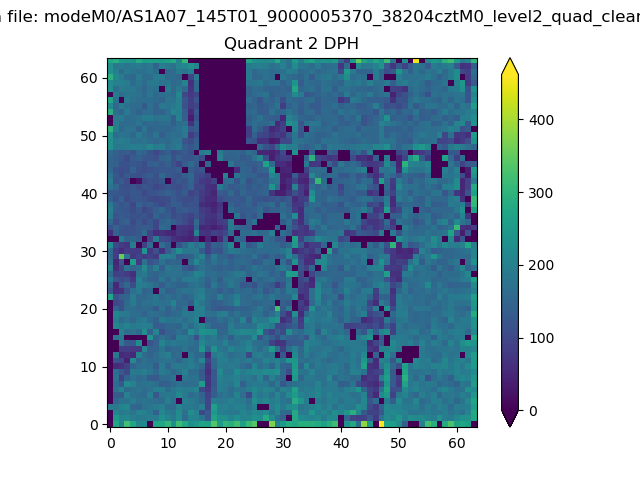
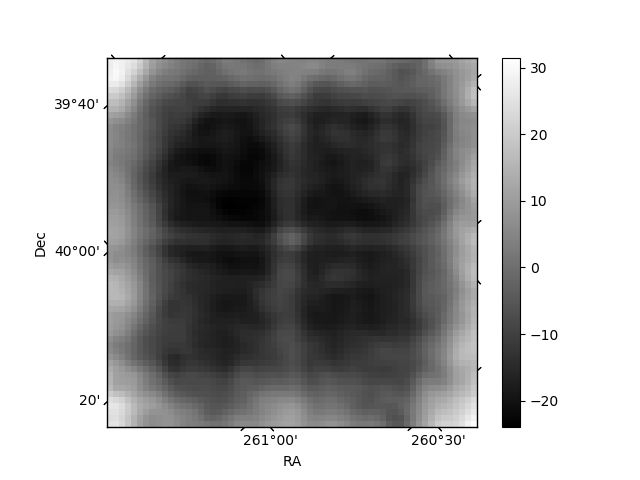
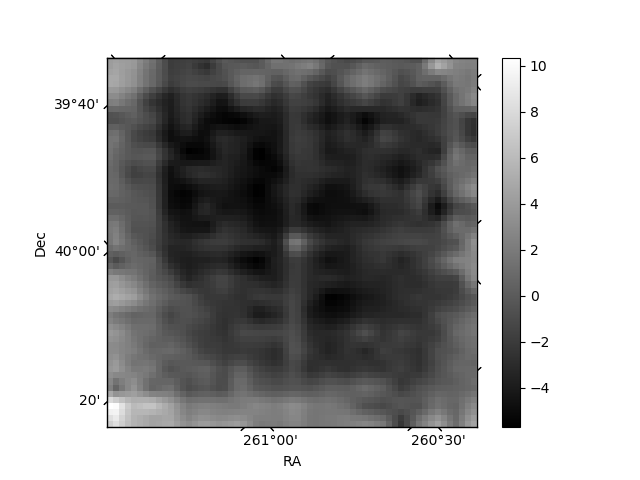
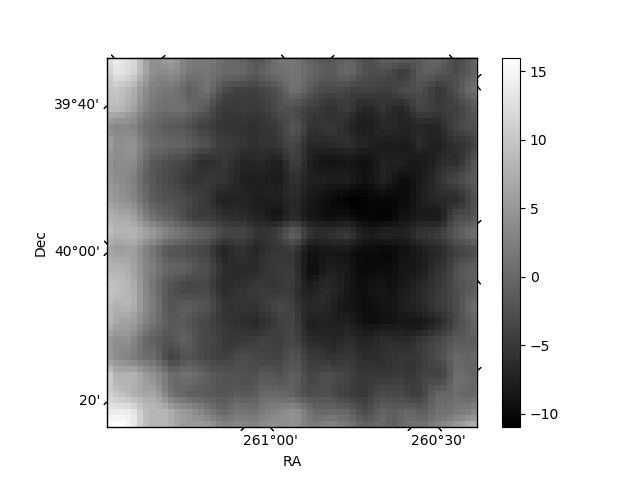
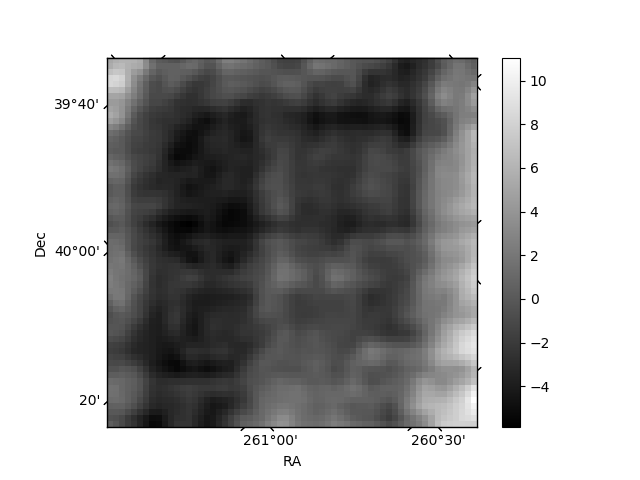
Histogram calculated using DETX and DETY for each event in the final _common_clean file
| Quadrant A | 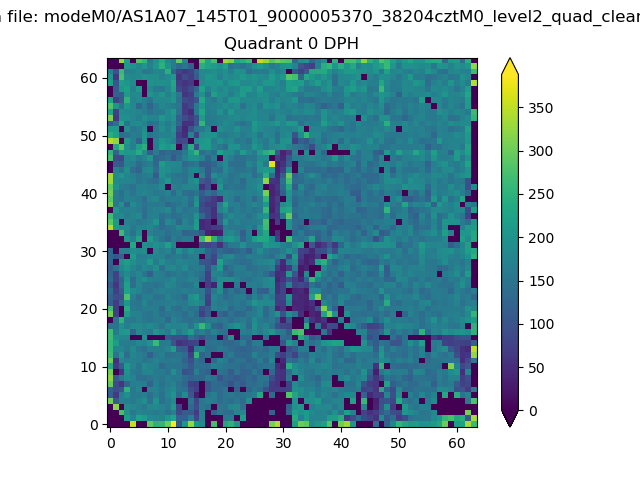 |
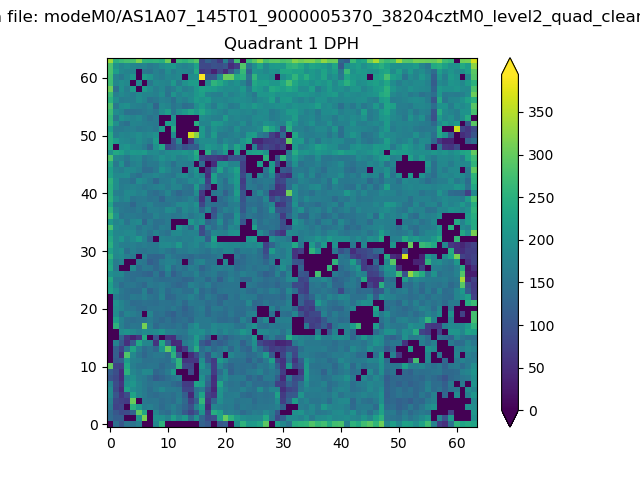 |
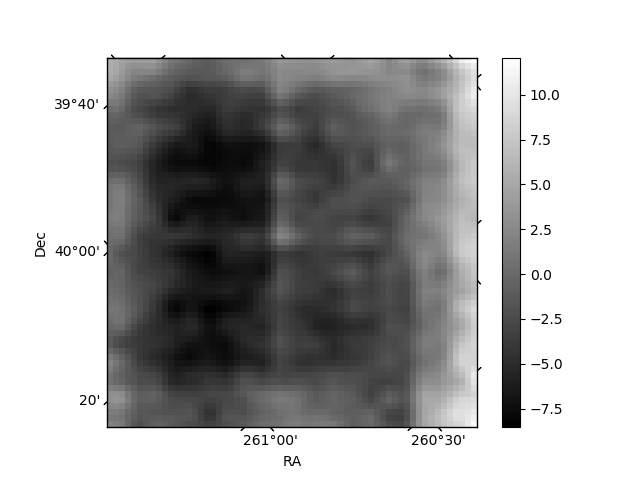
Quadrant B |
|---|---|---|---|
| Quadrant D | 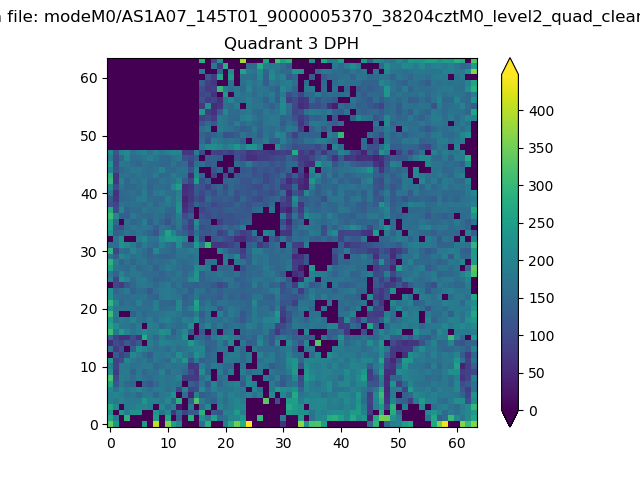 |
 |
Quadrant C |
| Plot type | Count rate plots | Images |
|---|---|---|
| Comparison with Poisson distribution Blue bars denote a histogram of data divided into 1 sec bins. Red curve is a Poisson curve with rate = median count rate of data. |
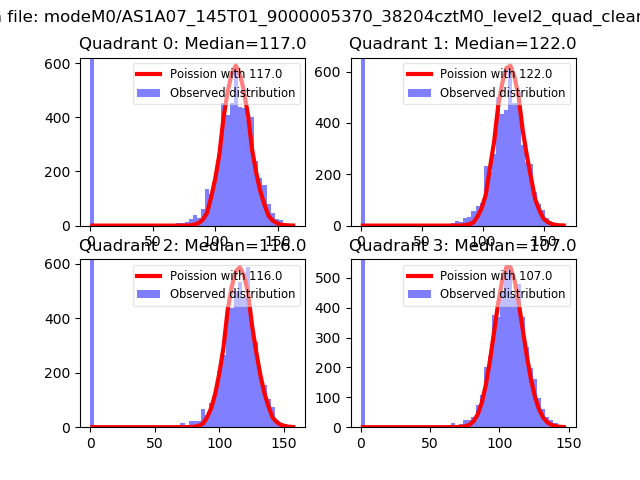 |
 |
| Quadrant-wise count rates Data is divided into 100 sec bins |
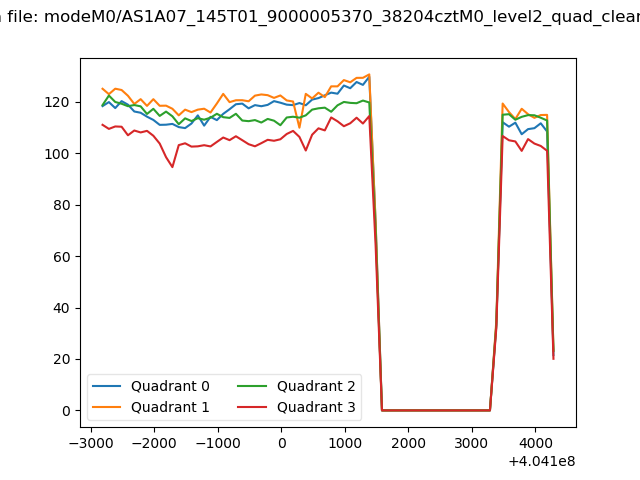 |
|
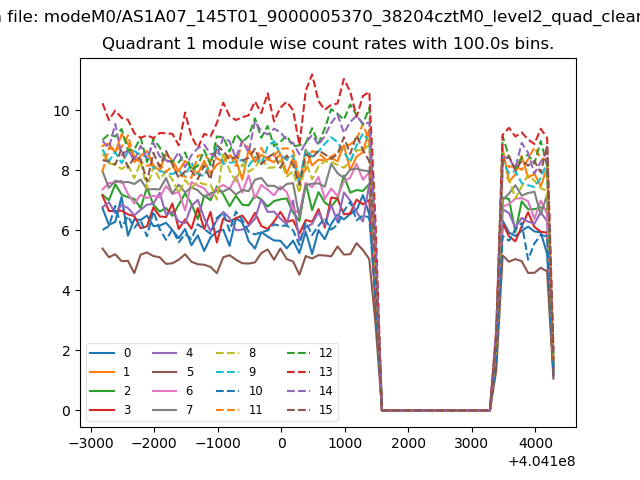
| Module-wise count rates for Quadrant A Data is divided into 100 sec bins |
 |
 |
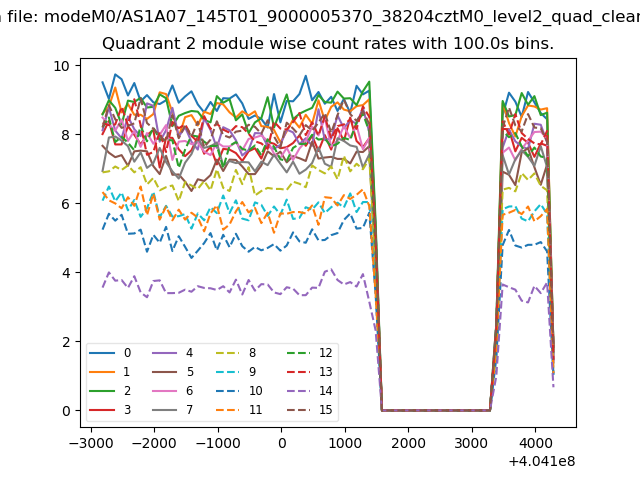
| Module-wise count rates for Quadrant B Data is divided into 100 sec bins |
 |
 |
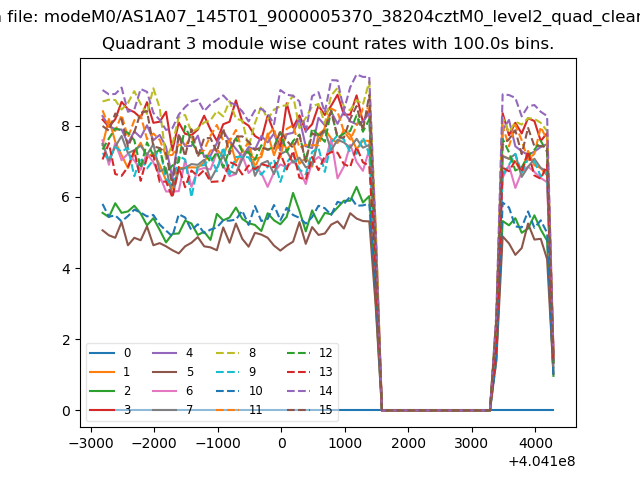
| Module-wise count rates for Quadrant C Data is divided into 100 sec bins |
 |
 |
| Module-wise count rates for Quadrant D Data is divided into 100 sec bins |
 |
 |
| Parameter | Plot |
|---|---|
| CZT HV Monitor |  |
| D_VDD | 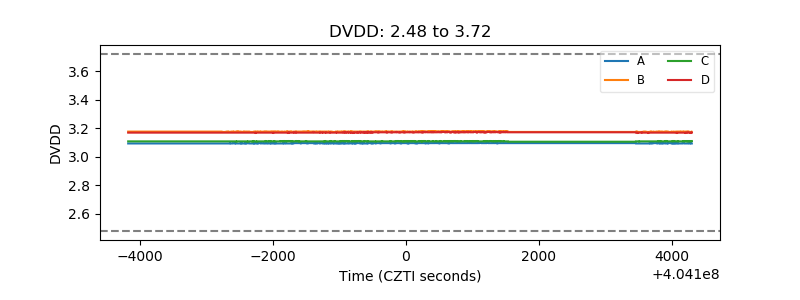 |
| Temperature 1 | 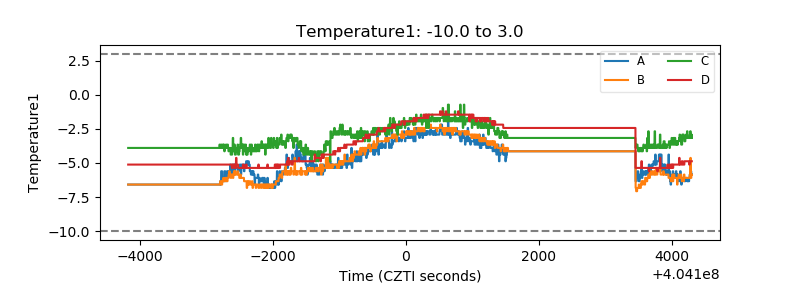 |
| Veto HV Monitor | 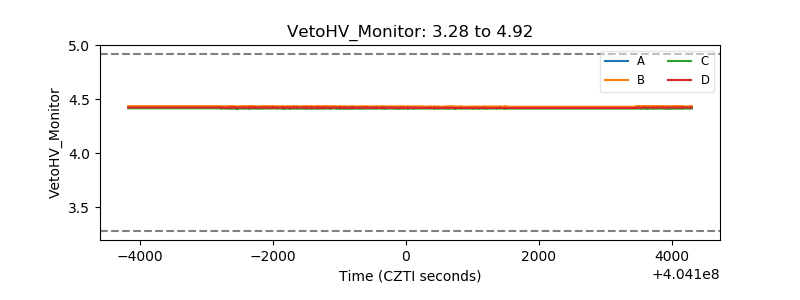 |
| Veto LLD | 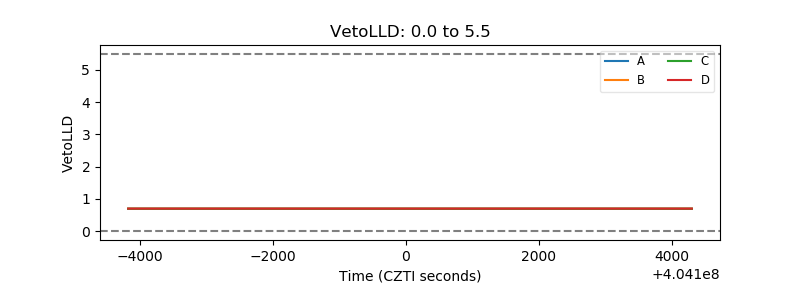 |
| Alpha Counter | 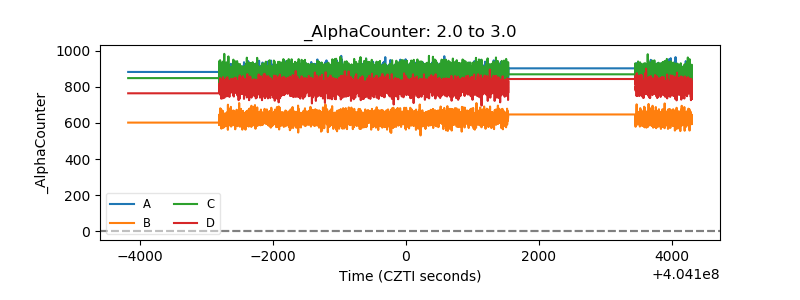 |
| _CPM_Rate | 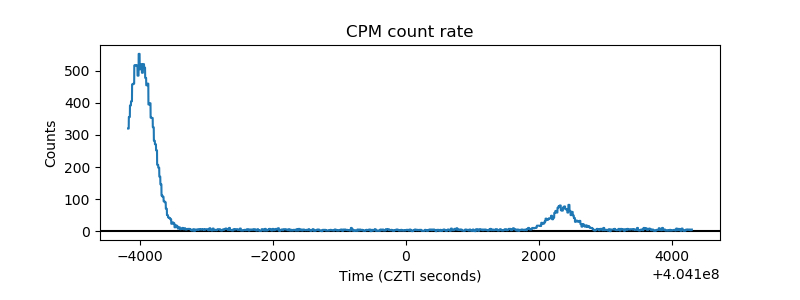 |
| CZT Counter | 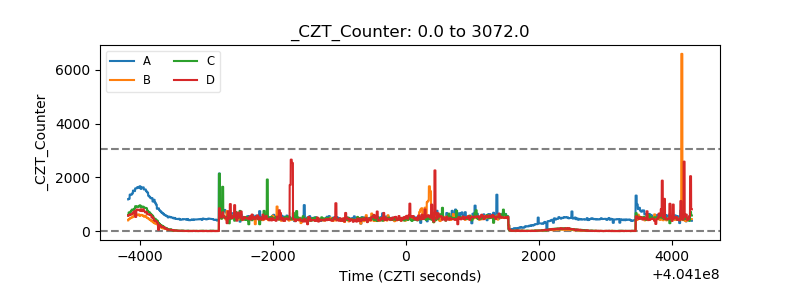 |
| +2.5 Volts monitor | 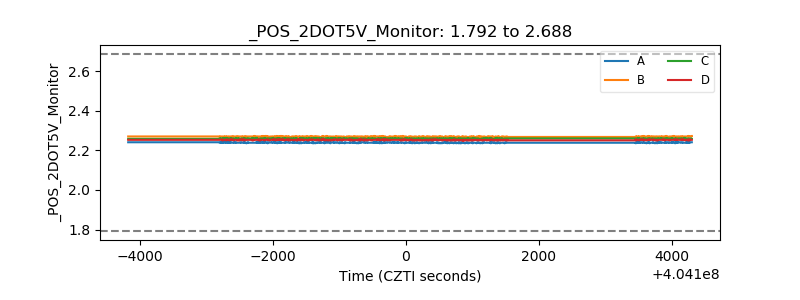 |
| +5 Volts monitor | 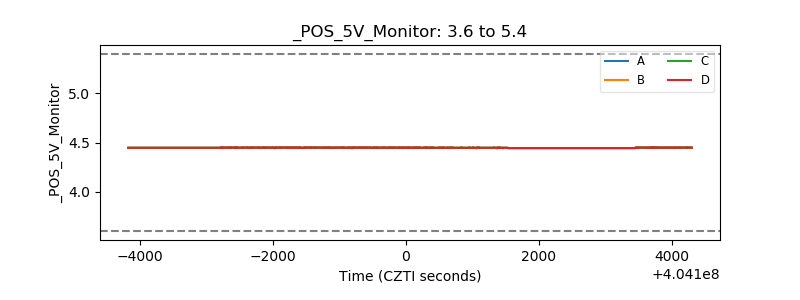 |
| _ROLL_ROT | 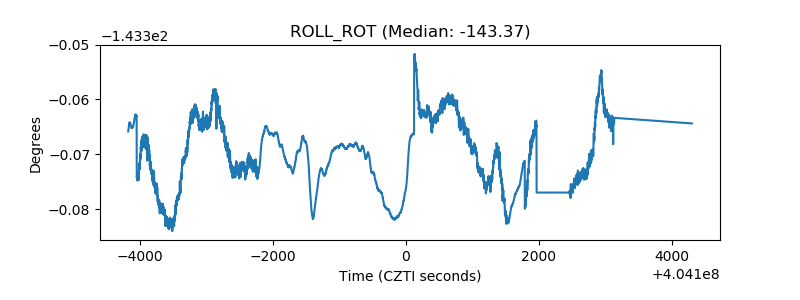 |
| _Roll_DEC | 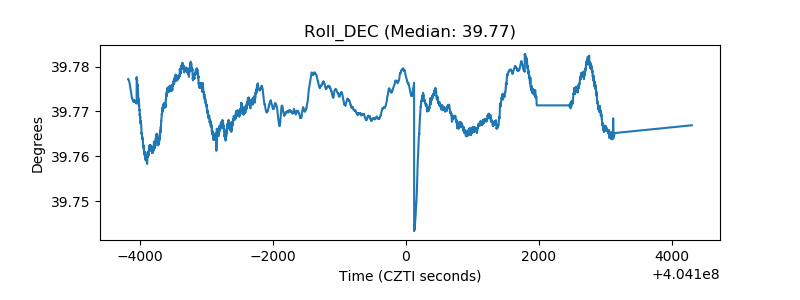 |
| _Roll_RA | 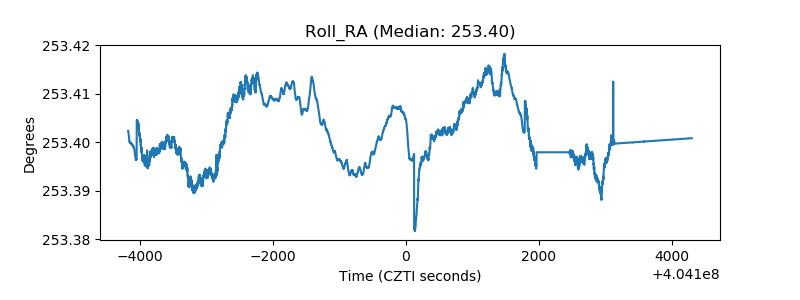 |
| Veto Counter | 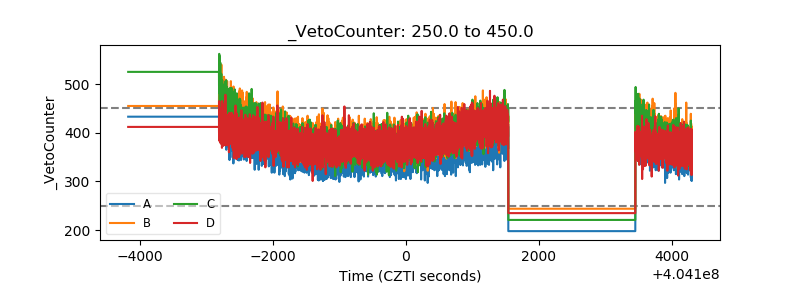 |