| Param | Original file | Final file |
|---|---|---|
| Filename | modeM0/AS1A07_145T01_9000005370_38206cztM0_level2.fits | modeM0/AS1A07_145T01_9000005370_38206cztM0_level2_quad_clean.evt |
| Size (bytes) | 590,952,960 | 168,526,080 |
| Size | 563.6 MB | 160.7 MB |
| Events in quadrant A | 5,120,784 | 1,143,879 |
| Events in quadrant B | 4,583,077 | 1,163,319 |
| Events in quadrant C | 4,787,268 | 1,106,344 |
| Events in quadrant D | 6,605,215 | 994,501 |
| Mode M9 | |||
|---|---|---|---|
| Quadrant | BADHDUFLAG | Total packets | Discarded packets |
| A | 0 | 29 | 0 |
| B | 0 | 29 | 0 |
| C | 0 | 29 | 0 |
| D | 0 | 29 | 0 |
| Mode SS | |||
|---|---|---|---|
| Quadrant | BADHDUFLAG | Total packets | Discarded packets |
| A | 0 | 204 | 2 |
| B | 0 | 204 | 0 |
| C | 0 | 204 | 0 |
| D | 0 | 204 | 0 |
| Mode M0 | |||
|---|---|---|---|
| Quadrant | BADHDUFLAG | Total packets | Discarded packets |
| A | 0 | 20968 | 3 |
| B | 0 | 20489 | 2 |
| C | 0 | 20510 | 4 |
| D | 0 | 26336 | 6 |
| Quadrant | Total seconds | Saturated seconds | Saturation percentage |
|---|---|---|---|
| A | 10032 | 16 | 0.159490% |
| B | 10032 | 20 | 0.199362% |
| C | 10031 | 10 | 0.099691% |
| D | 10030 | 482 | 4.805583% |
Noise dominated data is calculated using 1-second bins in cleaned event files. If a bin has >2000 counts, and if more than 50% of those come from <1% of pixels, then it is considered to be noise-dominated and hence unusable.
| Quadrant | # 1 sec bins | Bins with >0 counts | Bins with >2000 counts | High rate bins dominated by noise | Noise dominated (total time) | Noise dominated (detector-on time) | Marked lightcurve |
|---|---|---|---|---|---|---|---|
| A | 12926 | 10034 | 3 | 3 | 0.02% | 0.03% | 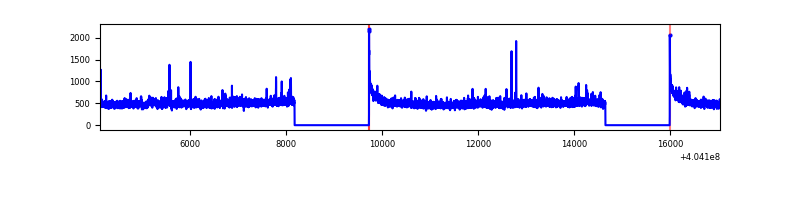 |
| B | 12926 | 10034 | 15 | 15 | 0.12% | 0.15% | 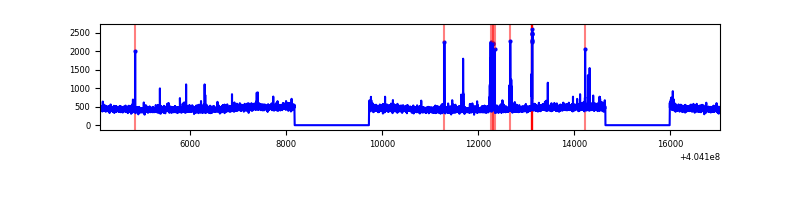 |
| C | 12926 | 10034 | 1 | 1 | 0.01% | 0.01% | 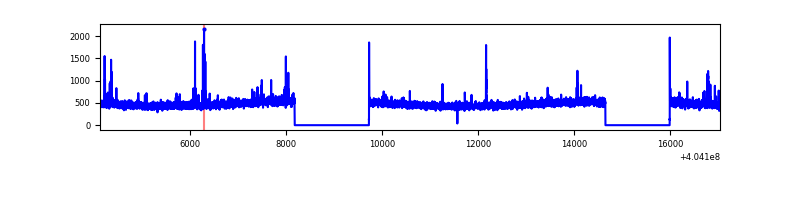 |
| D | 12926 | 10034 | 418 | 418 | 3.23% | 4.17% | 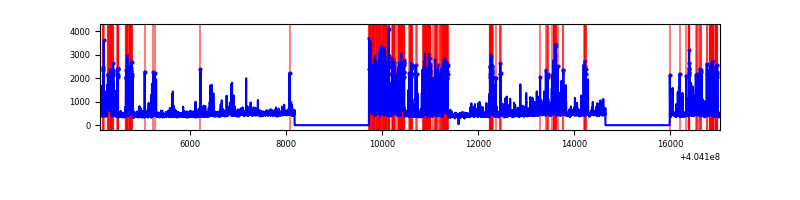 |
Top three noisy pixels from each quadrant. If the there are fewer than three noisy pixels in the level2.evt file, extra rows are filled as -1
| Pixel properties | Quadrant properties | ||||||
|---|---|---|---|---|---|---|---|
| Quadrant | DetID | PixID | Counts | Sigma | Mean | Median | Sigma |
| A | 10 | 83 | 586009 | 2574.65 | 1123 | 1099 | 227.2 |
| A | 12 | 189 | 92826 | 403.76 | 1123 | 1099 | 227.2 |
| A | 15 | 223 | 44323 | 190.26 | 1123 | 1099 | 227.2 |
| B | 15 | 85 | 100121 | 465.62 | 1116 | 1086 | 212.7 |
| B | 5 | 172 | 40912 | 187.24 | 1116 | 1086 | 212.7 |
| B | 0 | 230 | 28272 | 127.82 | 1116 | 1086 | 212.7 |
| C | 15 | 214 | 408089 | 1605.2 | 1091 | 1099 | 253.5 |
| C | 14 | 254 | 60704 | 235.09 | 1091 | 1099 | 253.5 |
| C | 2 | 16 | 38344 | 146.9 | 1091 | 1099 | 253.5 |
| D | 13 | 171 | 1666965 | 6342.4 | 1080 | 1049 | 262.7 |
| D | 10 | 118 | 255315 | 968.03 | 1080 | 1049 | 262.7 |
| D | 2 | 16 | 141523 | 534.8 | 1080 | 1049 | 262.7 |
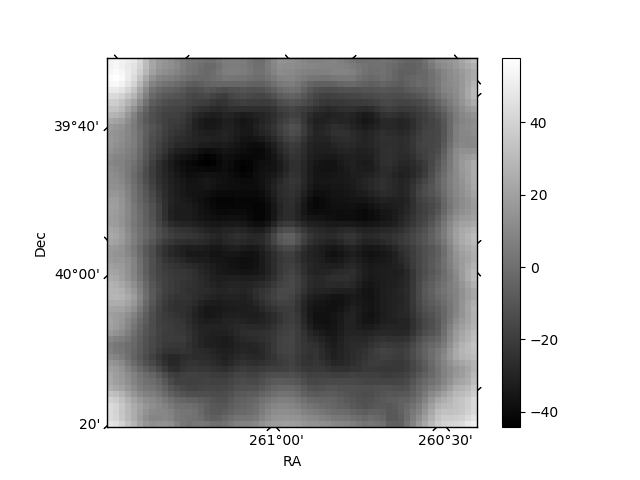
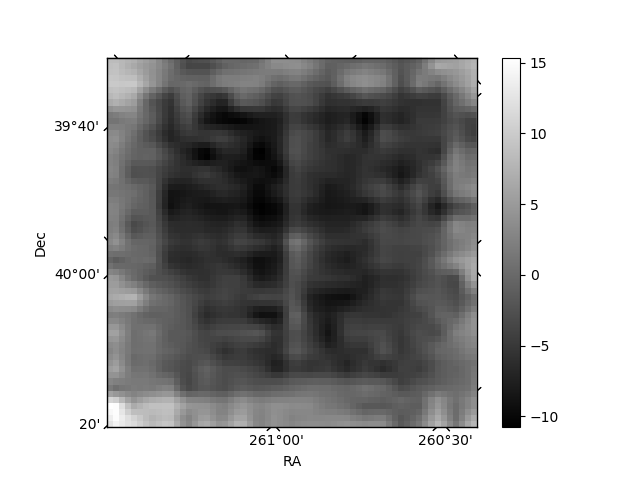
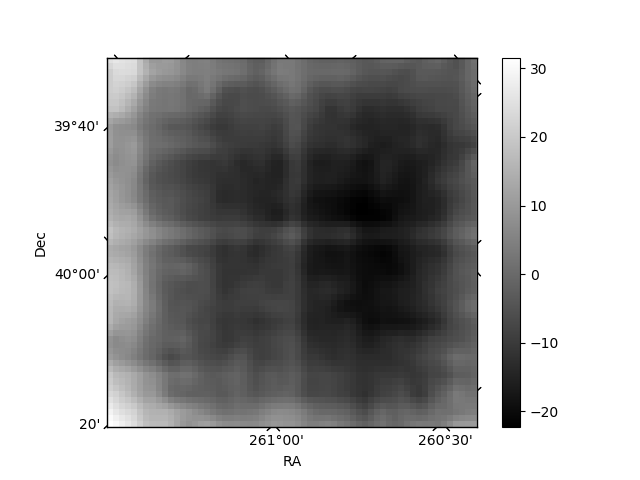
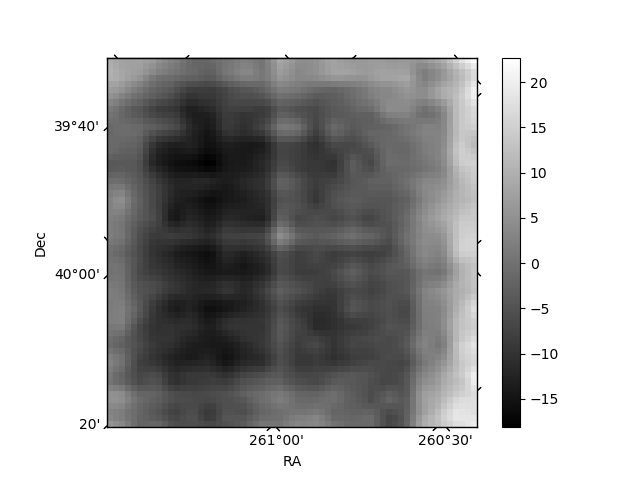
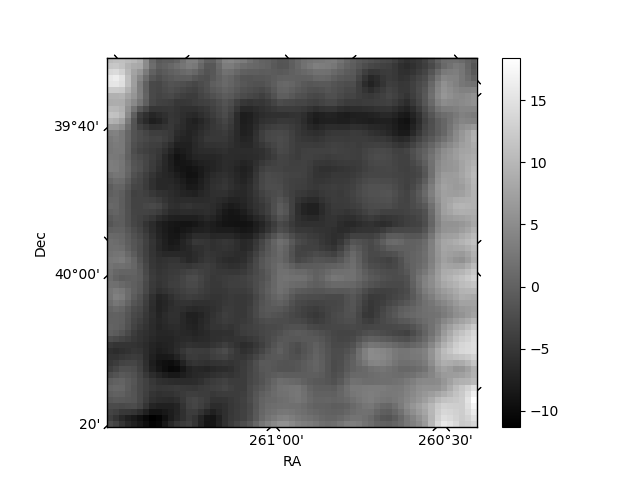
Histogram calculated using DETX and DETY for each event in the final _common_clean file
| Quadrant A | 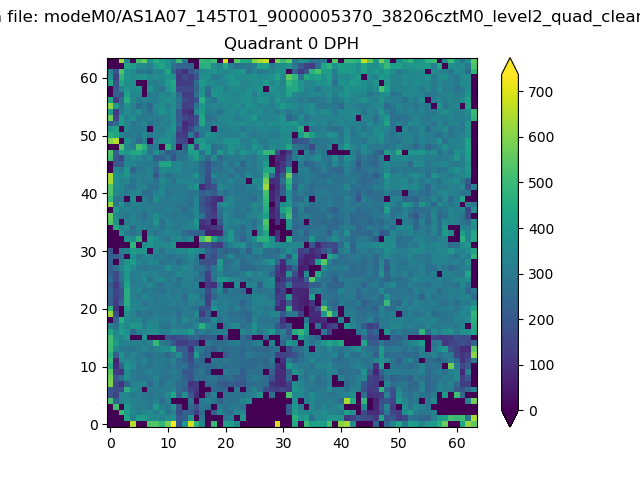 |
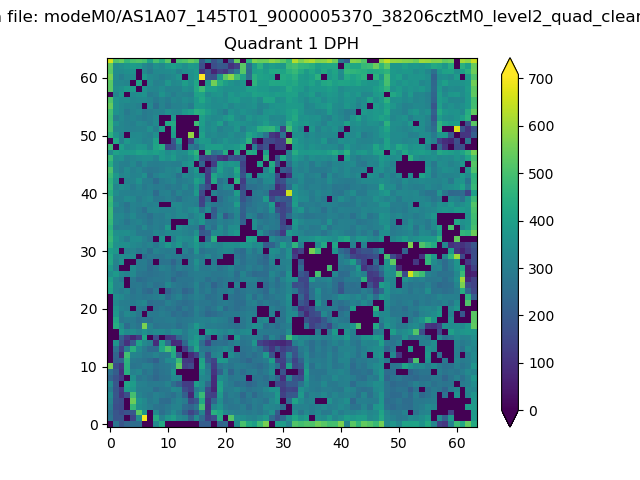 |
Quadrant B |
|---|---|---|---|
| Quadrant D | 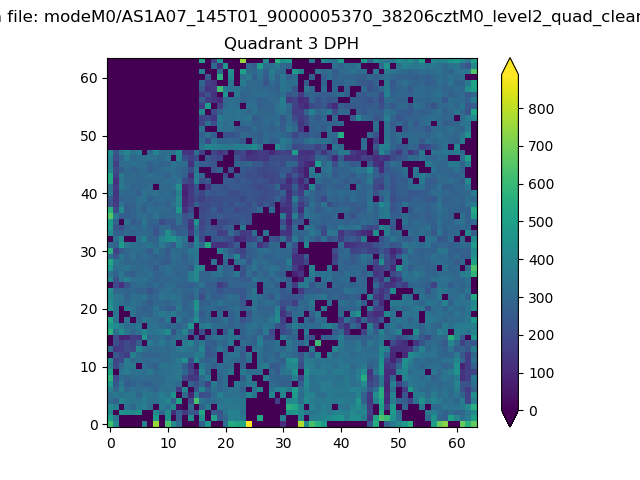 |
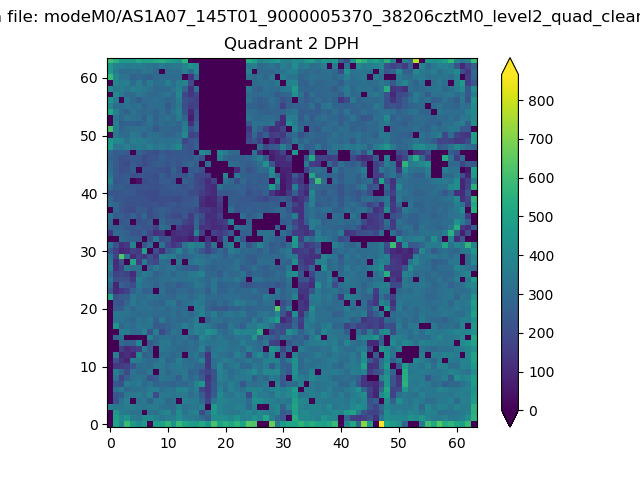 |
Quadrant C |
| Plot type | Count rate plots | Images |
|---|---|---|
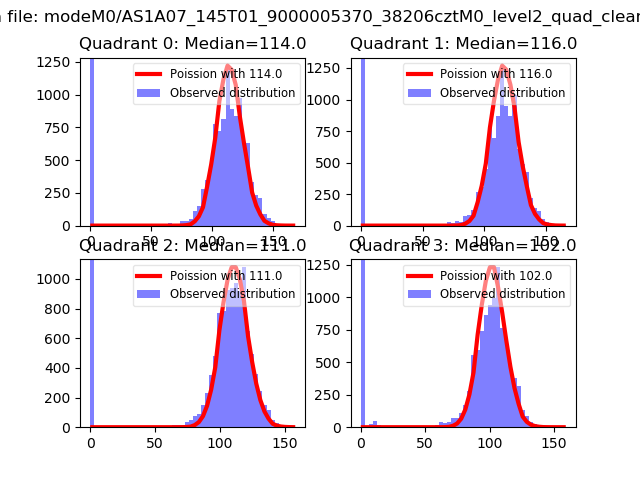
| Comparison with Poisson distribution Blue bars denote a histogram of data divided into 1 sec bins. Red curve is a Poisson curve with rate = median count rate of data. |
 |
 |
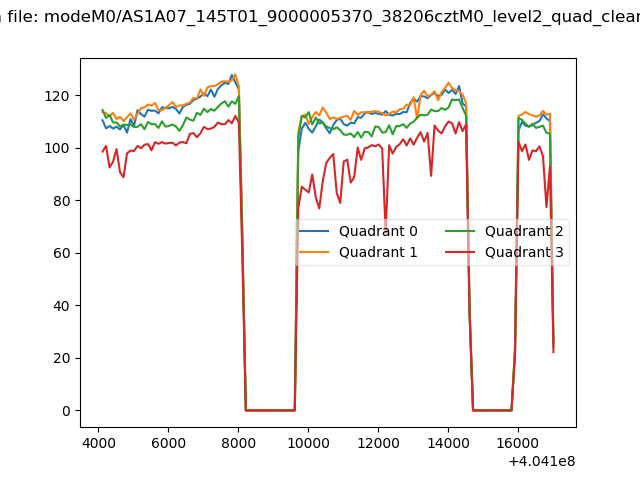
| Quadrant-wise count rates Data is divided into 100 sec bins |
 |
|
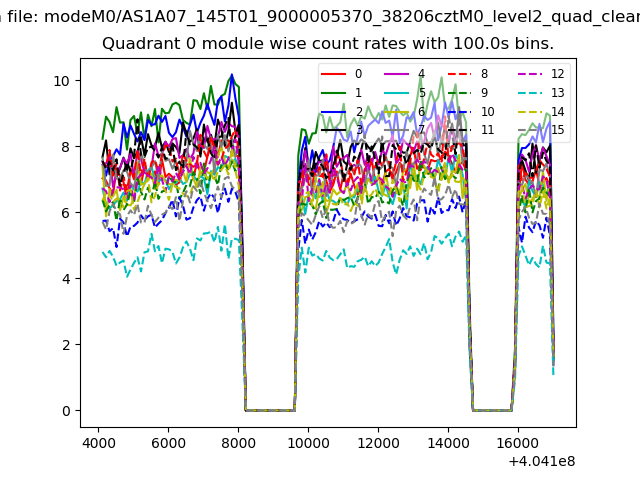
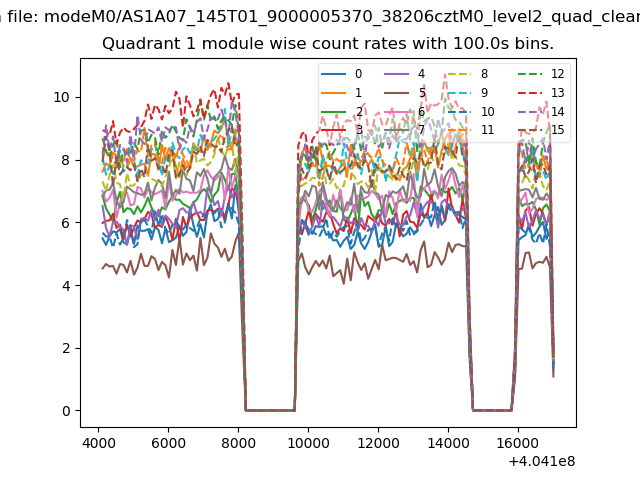
| Module-wise count rates for Quadrant A Data is divided into 100 sec bins |
 |
 |
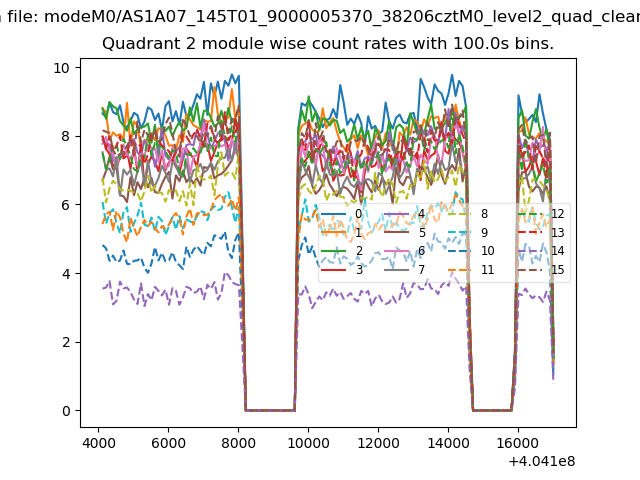
| Module-wise count rates for Quadrant B Data is divided into 100 sec bins |
 |
 |
| Module-wise count rates for Quadrant C Data is divided into 100 sec bins |
 |
 |
| Module-wise count rates for Quadrant D Data is divided into 100 sec bins |
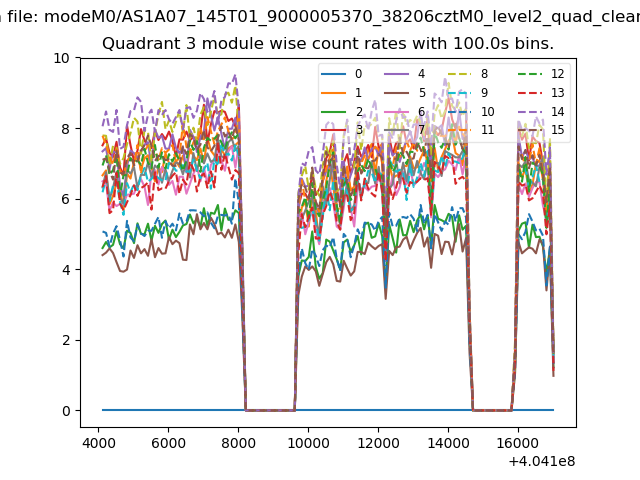 |
 |
| Parameter | Plot |
|---|---|
| CZT HV Monitor | 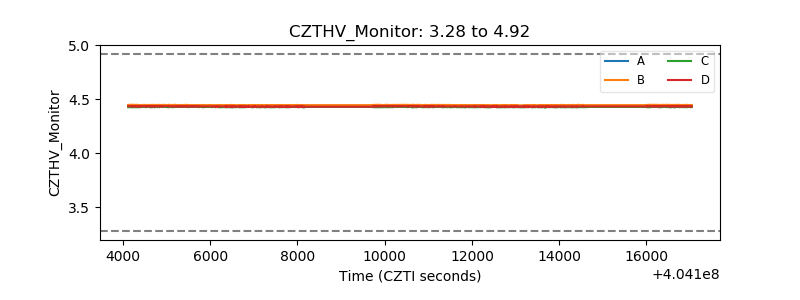 |
| D_VDD | 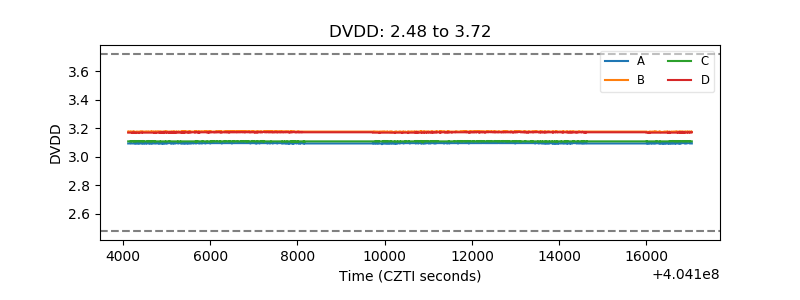 |
| Temperature 1 | 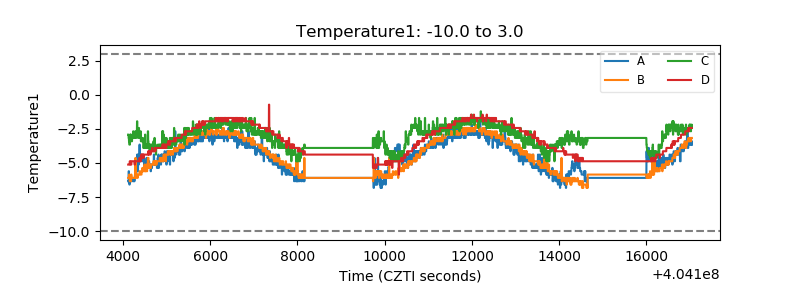 |
| Veto HV Monitor | 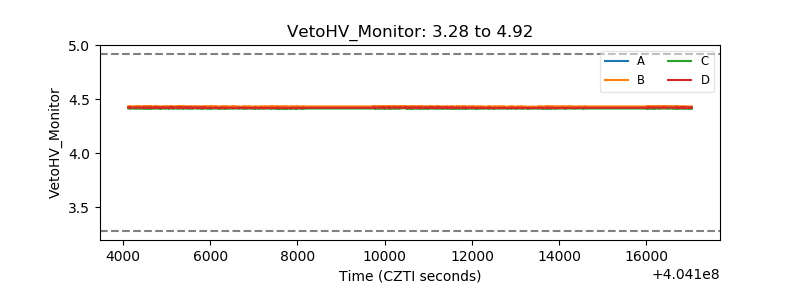 |
| Veto LLD | 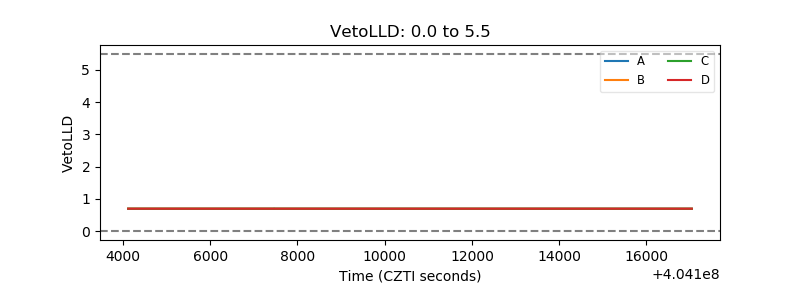 |
| Alpha Counter |  |
| _CPM_Rate | 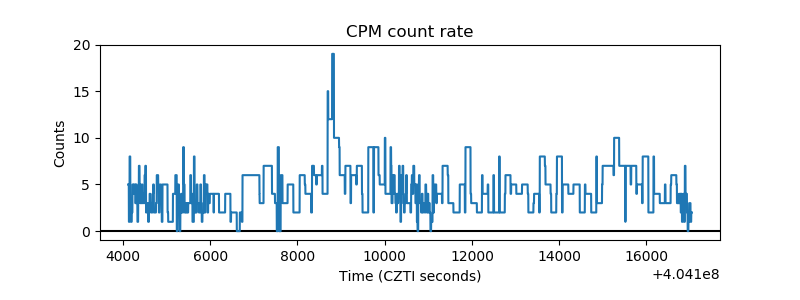 |
| CZT Counter | 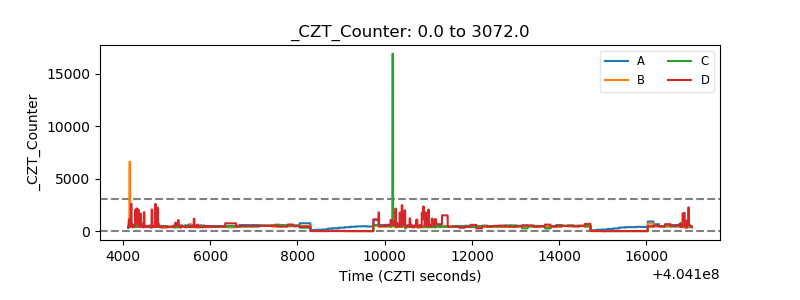 |
| +2.5 Volts monitor | 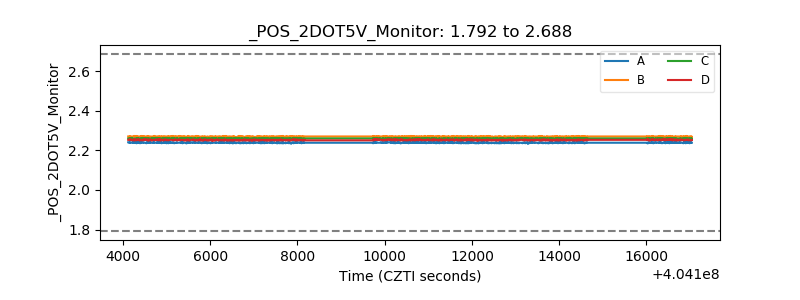 |
| +5 Volts monitor | 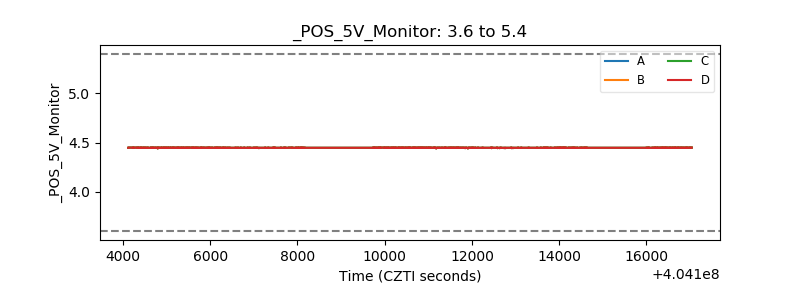 |
| _ROLL_ROT | 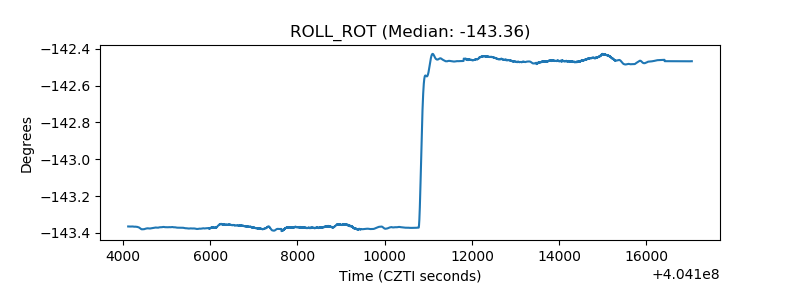 |
| _Roll_DEC | 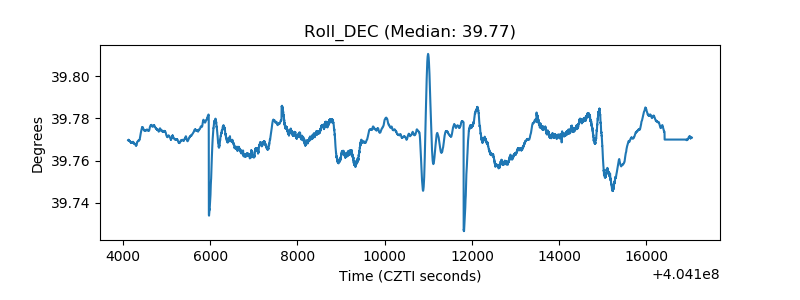 |
| _Roll_RA | 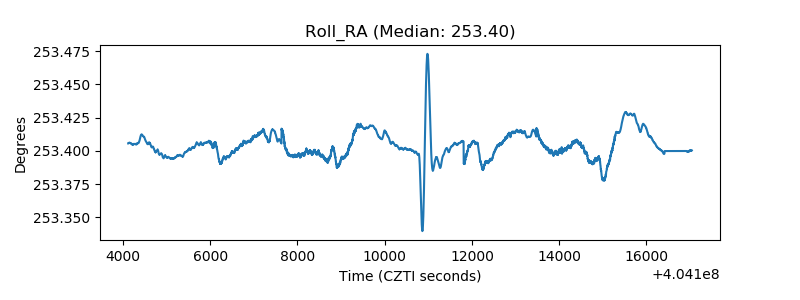 |
| Veto Counter | 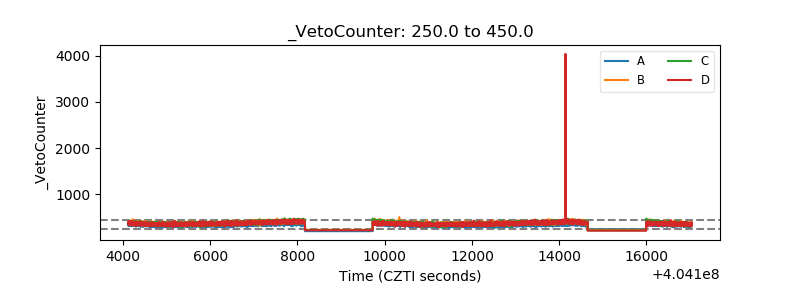 |