| Param | Original file | Final file |
|---|---|---|
| Filename | modeM0/AS1A07_145T01_9000005370_38207cztM0_level2.fits | modeM0/AS1A07_145T01_9000005370_38207cztM0_level2_quad_clean.evt |
| Size (bytes) | 686,894,400 | 194,630,400 |
| Size | 655.1 MB | 185.6 MB |
| Events in quadrant A | 6,025,531 | 1,317,796 |
| Events in quadrant B | 5,323,622 | 1,345,104 |
| Events in quadrant C | 5,628,382 | 1,276,729 |
| Events in quadrant D | 7,547,647 | 1,150,387 |
| Mode M9 | |||
|---|---|---|---|
| Quadrant | BADHDUFLAG | Total packets | Discarded packets |
| A | 0 | 36 | 0 |
| B | 0 | 36 | 0 |
| C | 0 | 36 | 0 |
| D | 0 | 36 | 0 |
| Mode SS | |||
|---|---|---|---|
| Quadrant | BADHDUFLAG | Total packets | Discarded packets |
| A | 0 | 234 | 0 |
| B | 0 | 234 | 0 |
| C | 0 | 234 | 0 |
| D | 0 | 234 | 0 |
| Mode M0 | |||
|---|---|---|---|
| Quadrant | BADHDUFLAG | Total packets | Discarded packets |
| A | 0 | 24826 | 4 |
| B | 0 | 23820 | 3 |
| C | 0 | 23995 | 3 |
| D | 0 | 30177 | 7 |
| Quadrant | Total seconds | Saturated seconds | Saturation percentage |
|---|---|---|---|
| A | 11619 | 27 | 0.232378% |
| B | 11619 | 30 | 0.258198% |
| C | 11619 | 24 | 0.206558% |
| D | 11618 | 574 | 4.940609% |
Noise dominated data is calculated using 1-second bins in cleaned event files. If a bin has >2000 counts, and if more than 50% of those come from <1% of pixels, then it is considered to be noise-dominated and hence unusable.
| Quadrant | # 1 sec bins | Bins with >0 counts | Bins with >2000 counts | High rate bins dominated by noise | Noise dominated (total time) | Noise dominated (detector-on time) | Marked lightcurve |
|---|---|---|---|---|---|---|---|
| A | 19139 | 11622 | 4 | 4 | 0.02% | 0.03% | 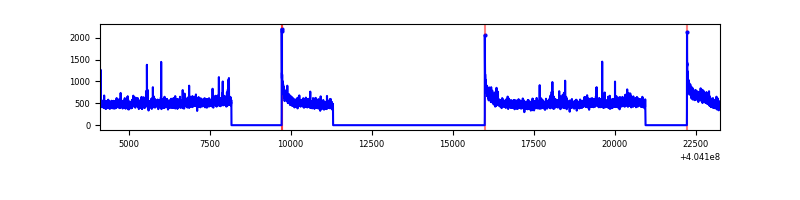 |
| B | 19139 | 11622 | 17 | 17 | 0.09% | 0.15% | 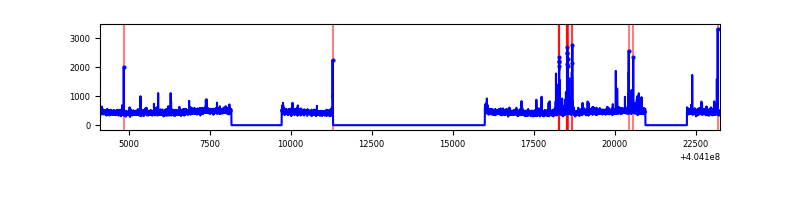 |
| C | 19139 | 11622 | 6 | 6 | 0.03% | 0.05% | 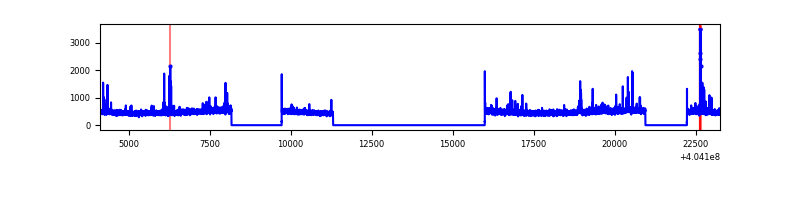 |
| D | 19139 | 11621 | 465 | 465 | 2.43% | 4.00% | 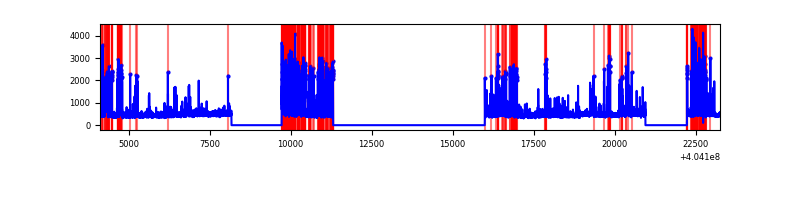 |
Top three noisy pixels from each quadrant. If the there are fewer than three noisy pixels in the level2.evt file, extra rows are filled as -1
| Pixel properties | Quadrant properties | ||||||
|---|---|---|---|---|---|---|---|
| Quadrant | DetID | PixID | Counts | Sigma | Mean | Median | Sigma |
| A | 10 | 83 | 723110 | 2730.5 | 1301 | 1272 | 264.4 |
| A | 12 | 189 | 105201 | 393.13 | 1301 | 1272 | 264.4 |
| A | 0 | 247 | 78121 | 290.69 | 1301 | 1272 | 264.4 |
| B | 5 | 172 | 95565 | 380.13 | 1292 | 1255 | 248.1 |
| B | 0 | 229 | 58915 | 232.41 | 1292 | 1255 | 248.1 |
| B | 12 | 111 | 31258 | 120.93 | 1292 | 1255 | 248.1 |
| C | 15 | 214 | 479565 | 1633.01 | 1261 | 1267 | 292.9 |
| C | 14 | 254 | 159466 | 540.12 | 1261 | 1267 | 292.9 |
| C | 2 | 16 | 34891 | 114.8 | 1261 | 1267 | 292.9 |
| D | 13 | 171 | 2006539 | 6614.37 | 1247 | 1214 | 303.2 |
| D | 2 | 16 | 193127 | 633.01 | 1247 | 1214 | 303.2 |
| D | 10 | 118 | 104703 | 341.35 | 1247 | 1214 | 303.2 |
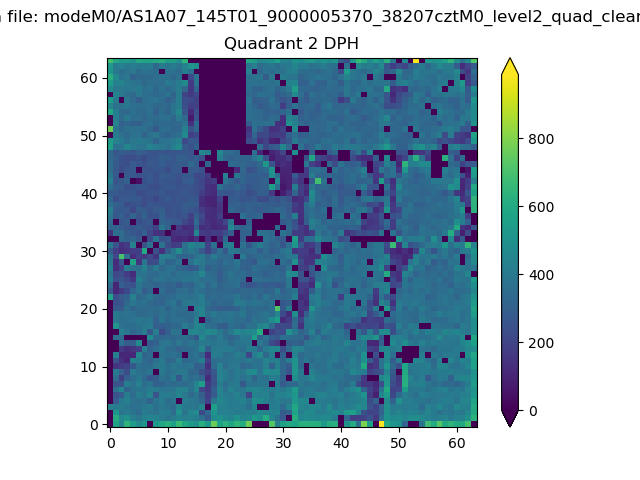
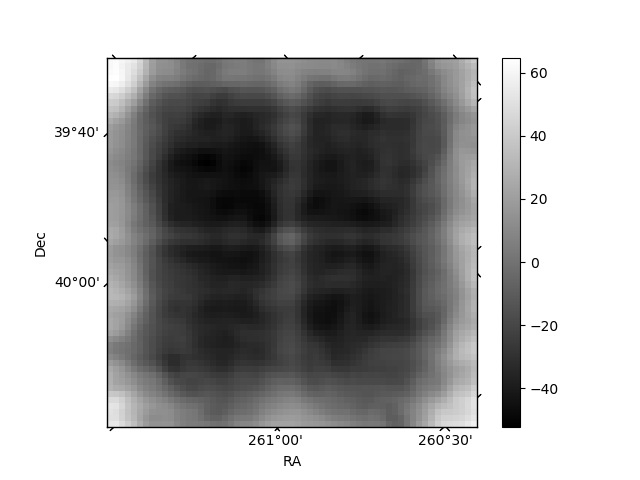
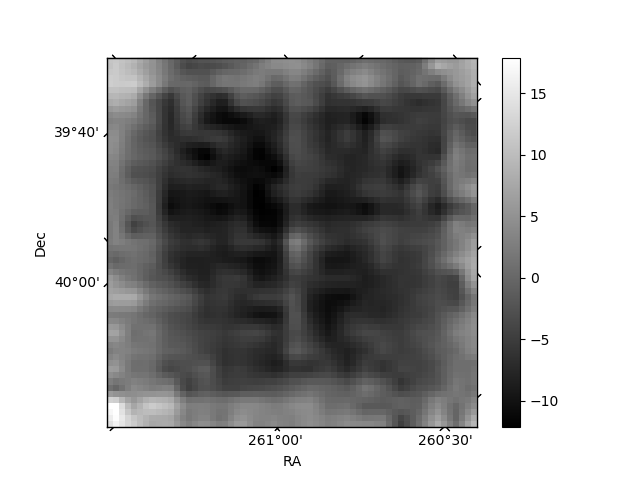
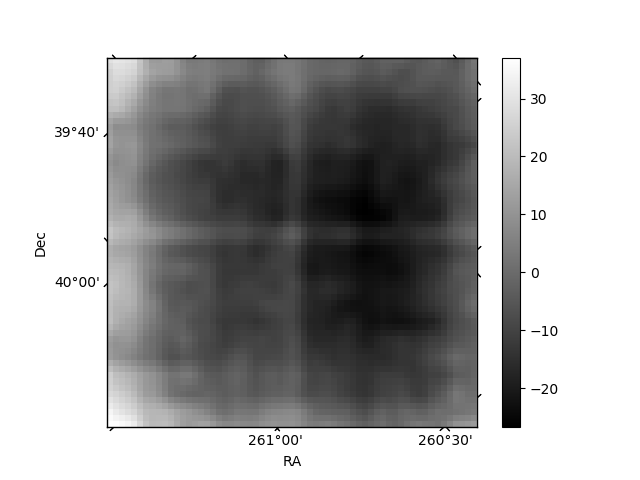
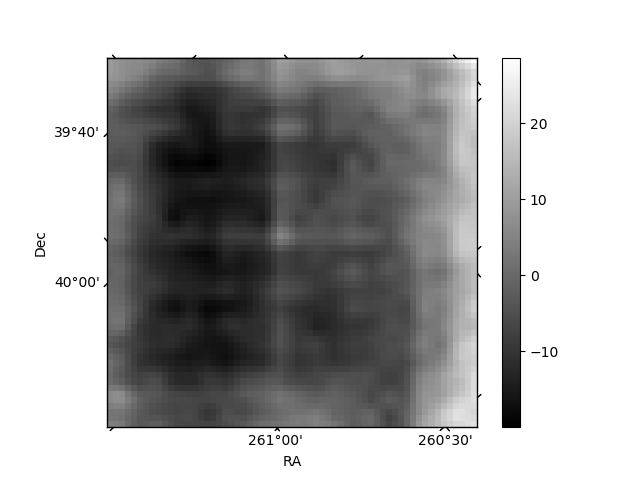
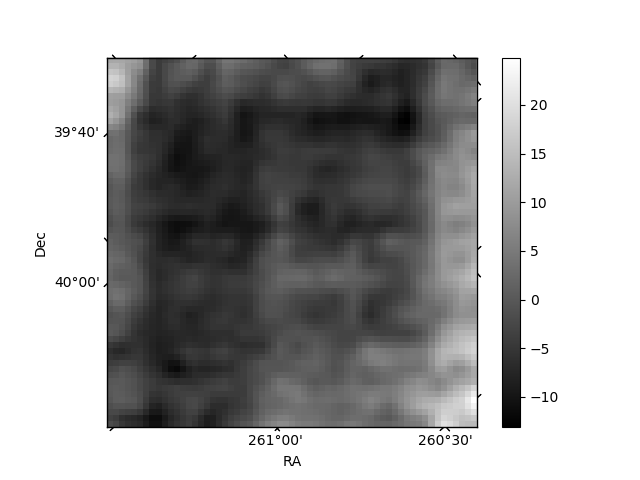
Histogram calculated using DETX and DETY for each event in the final _common_clean file
| Quadrant A | 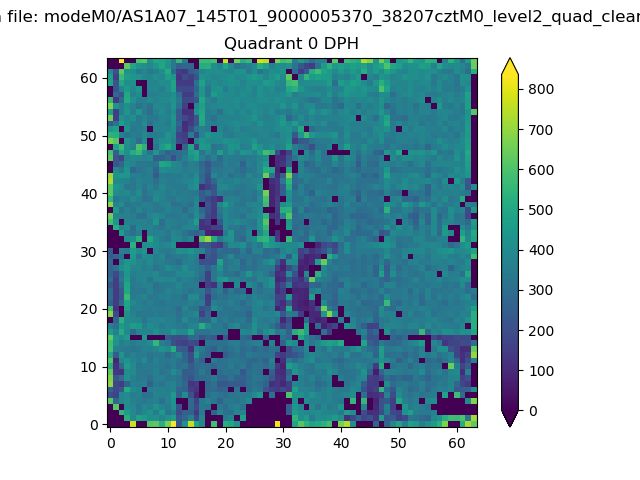 |
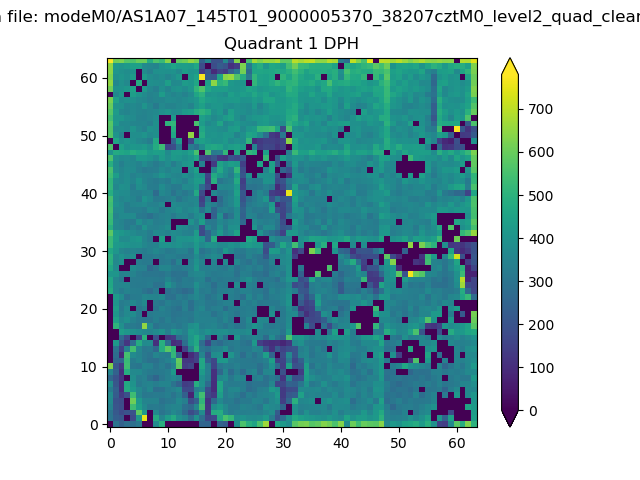 |
Quadrant B |
|---|---|---|---|
| Quadrant D | 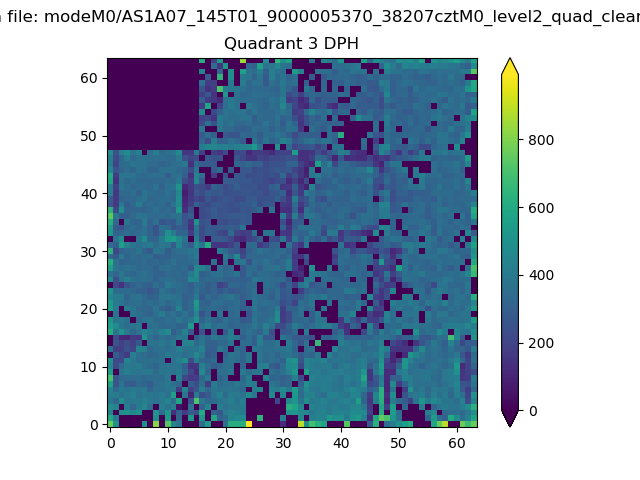 |
 |
Quadrant C |
| Plot type | Count rate plots | Images |
|---|---|---|
| Comparison with Poisson distribution Blue bars denote a histogram of data divided into 1 sec bins. Red curve is a Poisson curve with rate = median count rate of data. |
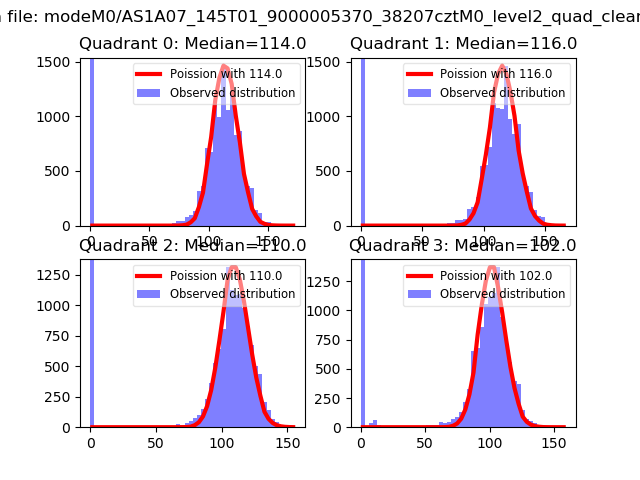 |
 |
| Quadrant-wise count rates Data is divided into 100 sec bins |
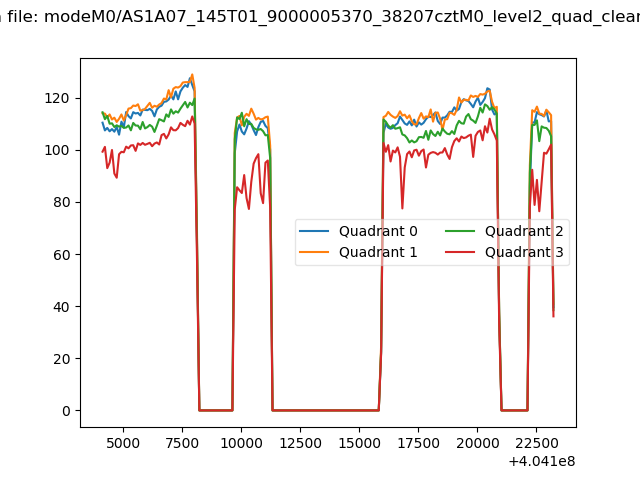 |
|
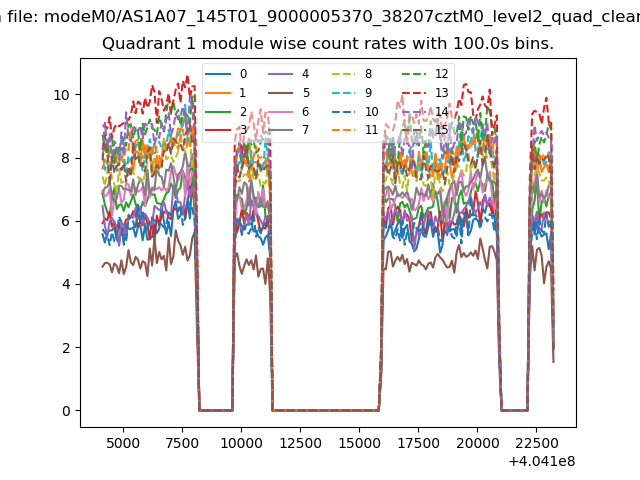
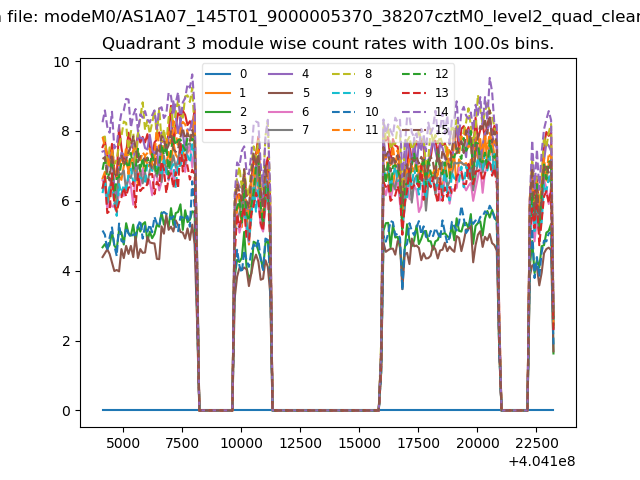
| Module-wise count rates for Quadrant A Data is divided into 100 sec bins |
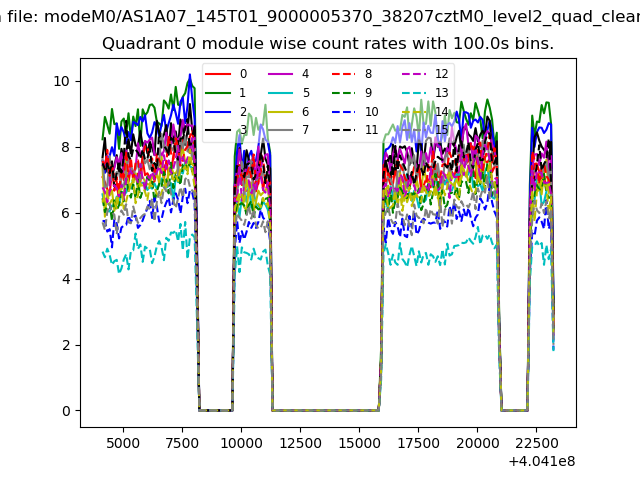 |
 |
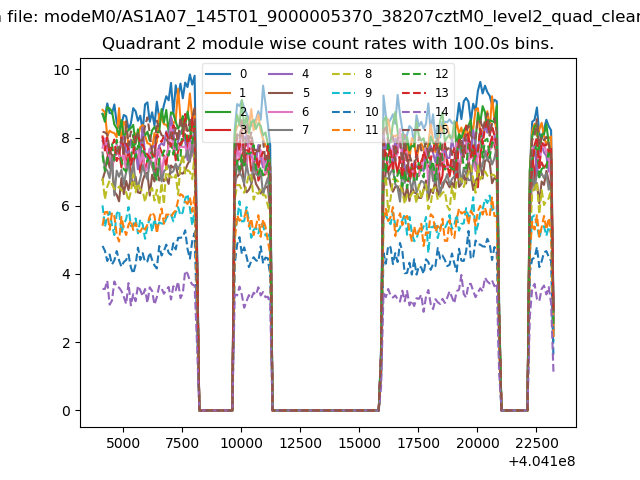
| Module-wise count rates for Quadrant B Data is divided into 100 sec bins |
 |
 |
| Module-wise count rates for Quadrant C Data is divided into 100 sec bins |
 |
 |
| Module-wise count rates for Quadrant D Data is divided into 100 sec bins |
 |
 |
| Parameter | Plot |
|---|---|
| CZT HV Monitor | 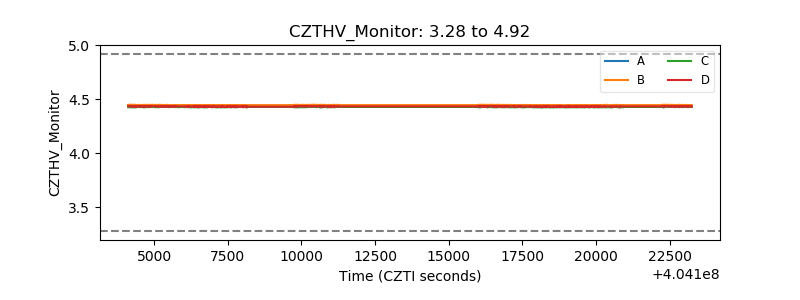 |
| D_VDD | 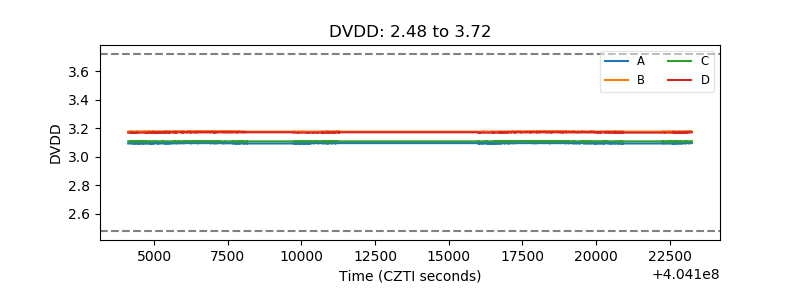 |
| Temperature 1 | 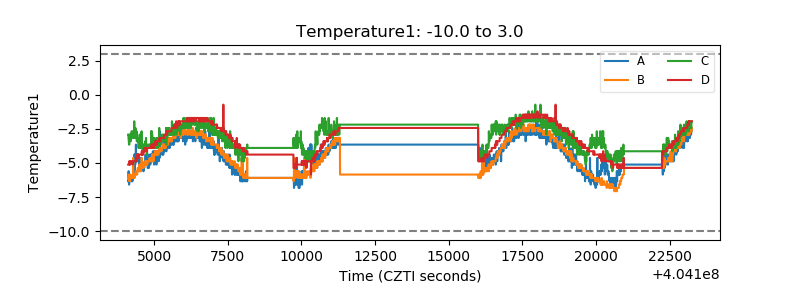 |
| Veto HV Monitor | 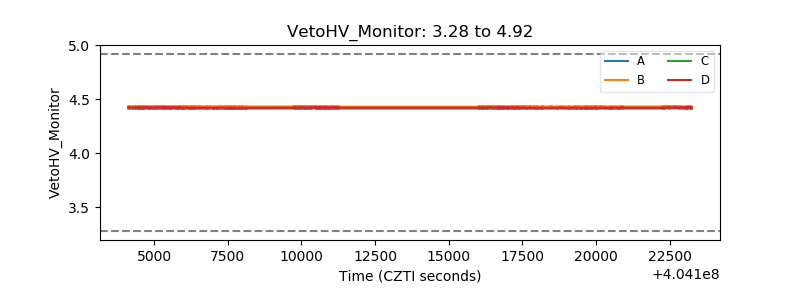 |
| Veto LLD | 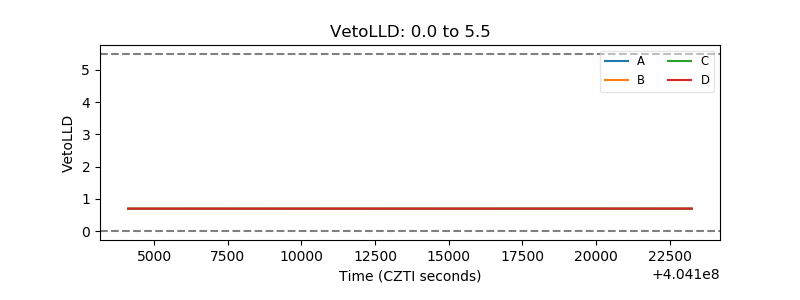 |
| Alpha Counter | 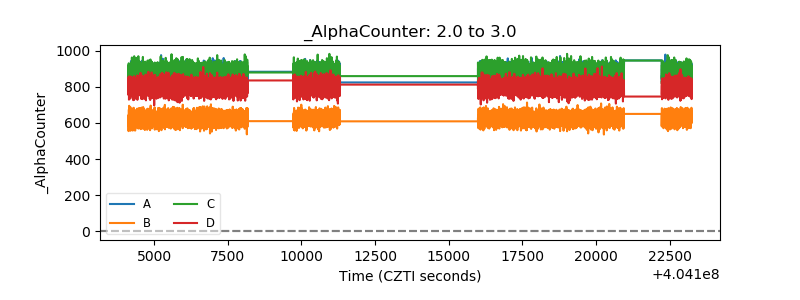 |
| _CPM_Rate | 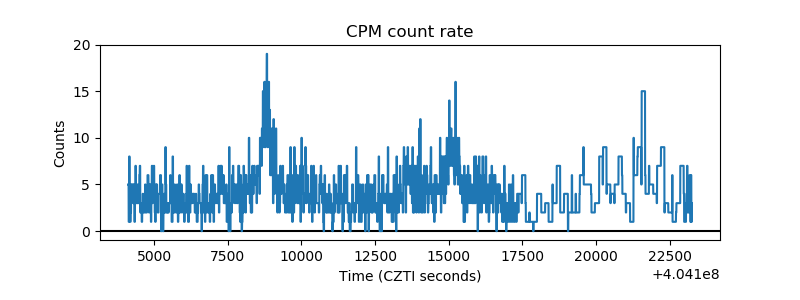 |
| CZT Counter | 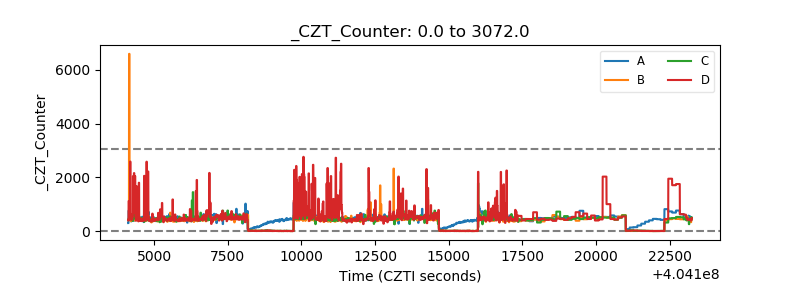 |
| +2.5 Volts monitor | 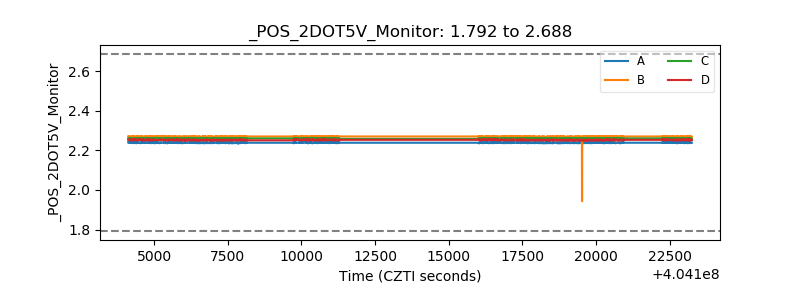 |
| +5 Volts monitor | 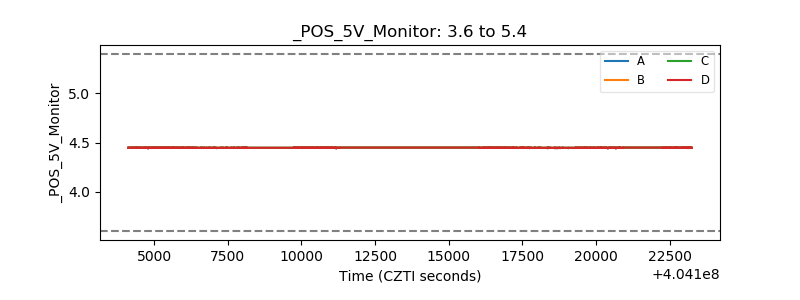 |
| _ROLL_ROT | 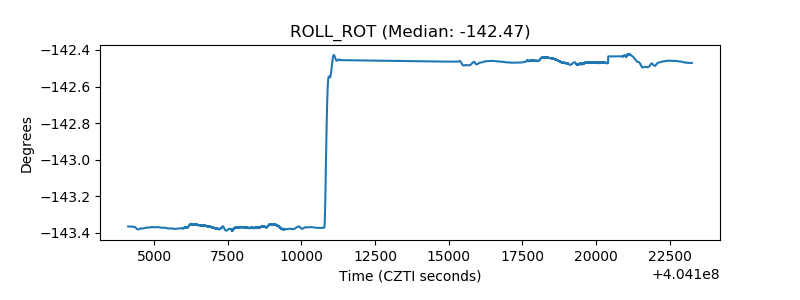 |
| _Roll_DEC | 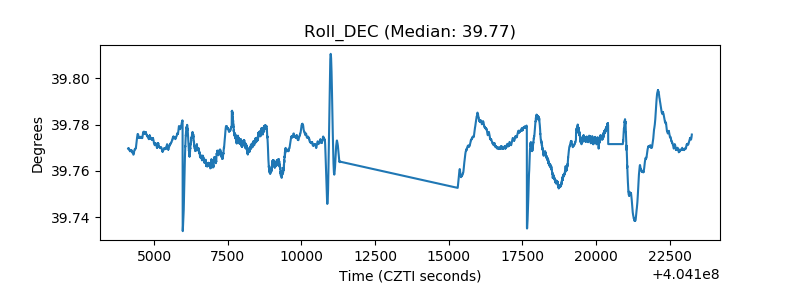 |
| _Roll_RA | 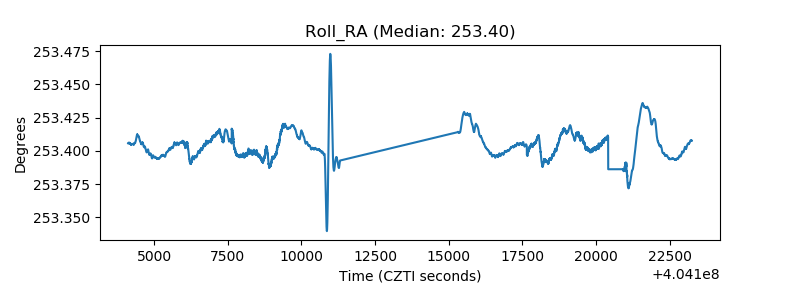 |
| Veto Counter | 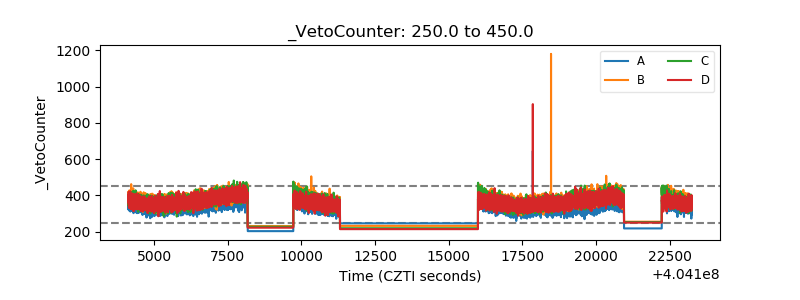 |