| Param | Original file | Final file |
|---|---|---|
| Filename | modeM0/AS1A07_145T01_9000005370_38210cztM0_level2.fits | modeM0/AS1A07_145T01_9000005370_38210cztM0_level2_quad_clean.evt |
| Size (bytes) | 350,222,400 | 95,647,680 |
| Size | 334.0 MB | 91.2 MB |
| Events in quadrant A | 2,984,950 | 649,767 |
| Events in quadrant B | 2,656,327 | 660,075 |
| Events in quadrant C | 3,228,311 | 613,921 |
| Events in quadrant D | 3,647,790 | 571,521 |
| Mode M9 | |||
|---|---|---|---|
| Quadrant | BADHDUFLAG | Total packets | Discarded packets |
| A | 0 | 16 | 0 |
| B | 0 | 16 | 0 |
| C | 0 | 16 | 0 |
| D | 0 | 16 | 0 |
| Mode SS | |||
|---|---|---|---|
| Quadrant | BADHDUFLAG | Total packets | Discarded packets |
| A | 0 | 116 | 0 |
| B | 0 | 116 | 0 |
| C | 0 | 116 | 0 |
| D | 0 | 116 | 0 |
| Mode M0 | |||
|---|---|---|---|
| Quadrant | BADHDUFLAG | Total packets | Discarded packets |
| A | 0 | 12370 | 3 |
| B | 0 | 11777 | 2 |
| C | 0 | 13172 | 2 |
| D | 0 | 14508 | 2 |
| Quadrant | Total seconds | Saturated seconds | Saturation percentage |
|---|---|---|---|
| A | 5733 | 16 | 0.279086% |
| B | 5733 | 31 | 0.540729% |
| C | 5733 | 136 | 2.372231% |
| D | 5734 | 211 | 3.679805% |
Noise dominated data is calculated using 1-second bins in cleaned event files. If a bin has >2000 counts, and if more than 50% of those come from <1% of pixels, then it is considered to be noise-dominated and hence unusable.
| Quadrant | # 1 sec bins | Bins with >0 counts | Bins with >2000 counts | High rate bins dominated by noise | Noise dominated (total time) | Noise dominated (detector-on time) | Marked lightcurve |
|---|---|---|---|---|---|---|---|
| A | 7286 | 5734 | 2 | 2 | 0.03% | 0.03% | 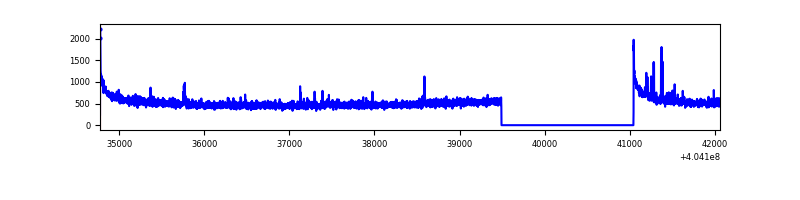 |
| B | 7286 | 5734 | 17 | 17 | 0.23% | 0.30% | 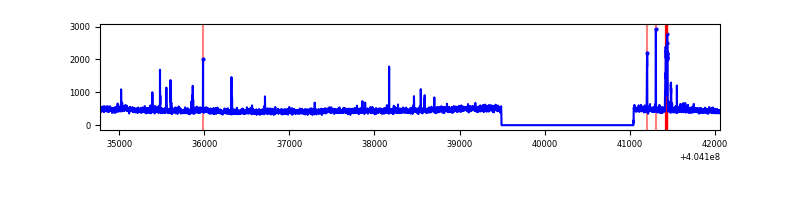 |
| C | 7286 | 5734 | 109 | 109 | 1.50% | 1.90% | 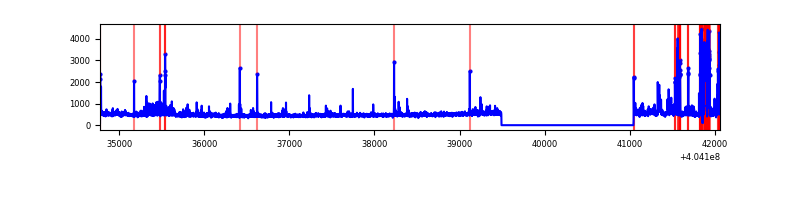 |
| D | 7287 | 5735 | 166 | 166 | 2.28% | 2.89% | 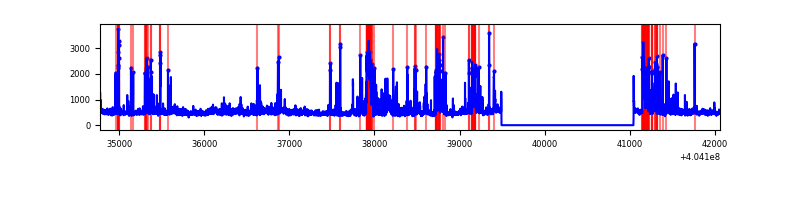 |
Top three noisy pixels from each quadrant. If the there are fewer than three noisy pixels in the level2.evt file, extra rows are filled as -1
| Pixel properties | Quadrant properties | ||||||
|---|---|---|---|---|---|---|---|
| Quadrant | DetID | PixID | Counts | Sigma | Mean | Median | Sigma |
| A | 10 | 83 | 409795 | 3136.35 | 639 | 624 | 130.5 |
| A | 12 | 189 | 48648 | 368.11 | 639 | 624 | 130.5 |
| A | 9 | 143 | 33945 | 255.41 | 639 | 624 | 130.5 |
| B | 0 | 186 | 63727 | 513.67 | 636 | 617 | 122.9 |
| B | 0 | 183 | 31791 | 253.73 | 636 | 617 | 122.9 |
| B | 15 | 85 | 16983 | 133.2 | 636 | 617 | 122.9 |
| C | 9 | 236 | 423649 | 2924.66 | 614 | 616 | 144.6 |
| C | 15 | 214 | 235555 | 1624.26 | 614 | 616 | 144.6 |
| C | 14 | 254 | 91826 | 630.58 | 614 | 616 | 144.6 |
| D | 13 | 138 | 245284 | 1616.32 | 620 | 601 | 151.4 |
| D | 10 | 118 | 241754 | 1593.0 | 620 | 601 | 151.4 |
| D | 13 | 249 | 228840 | 1507.7 | 620 | 601 | 151.4 |
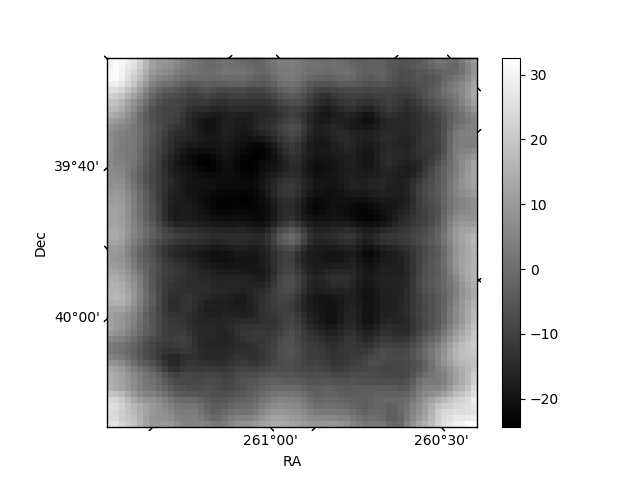
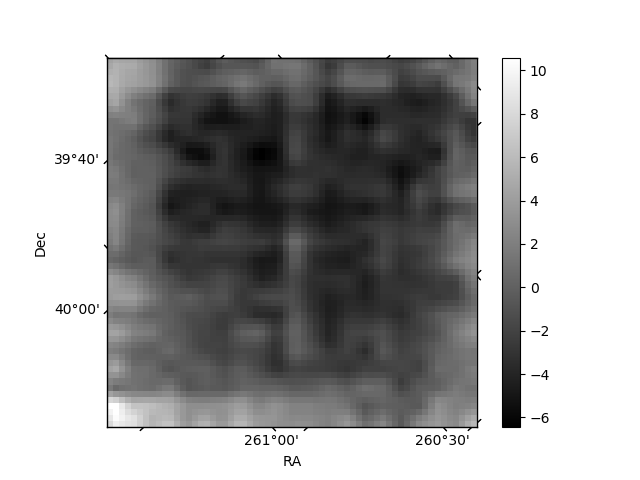
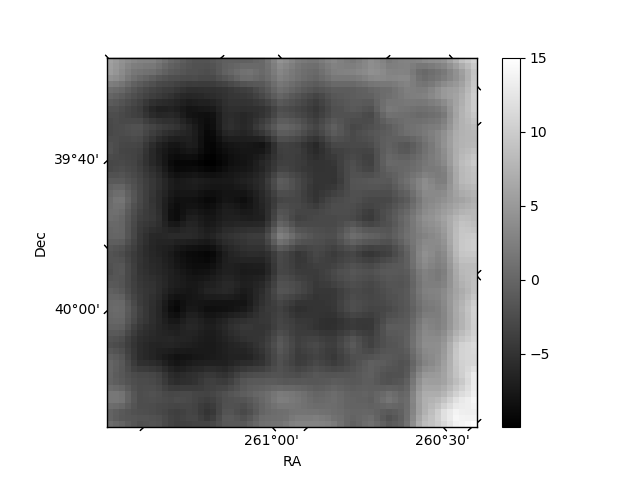
Histogram calculated using DETX and DETY for each event in the final _common_clean file
| Quadrant A | 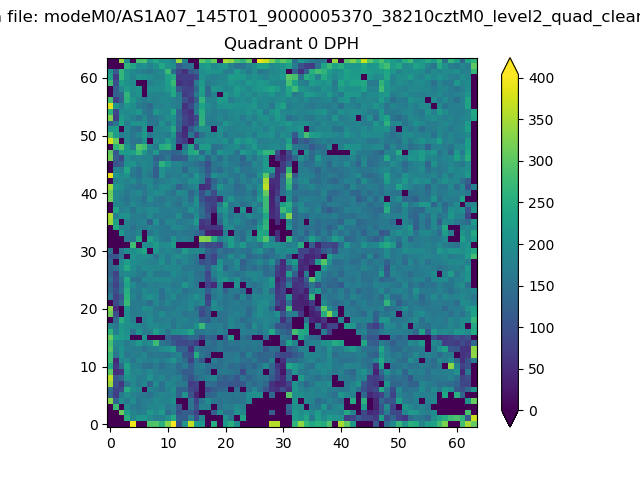 |
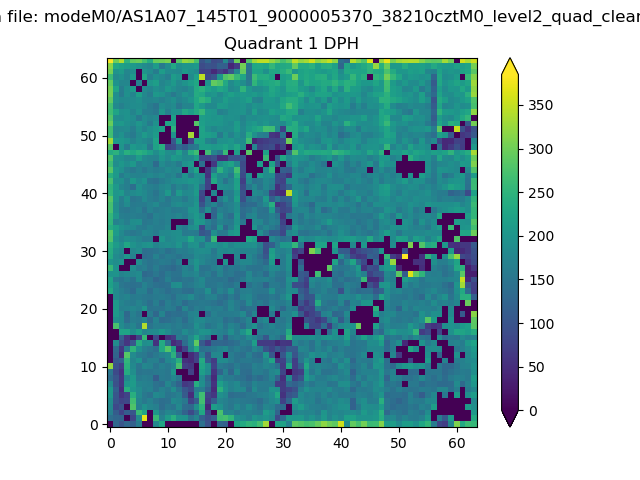 |
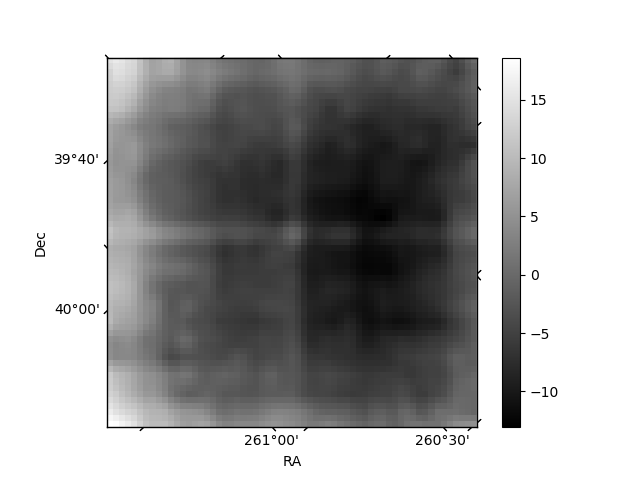
Quadrant B |
|---|---|---|---|
| Quadrant D | 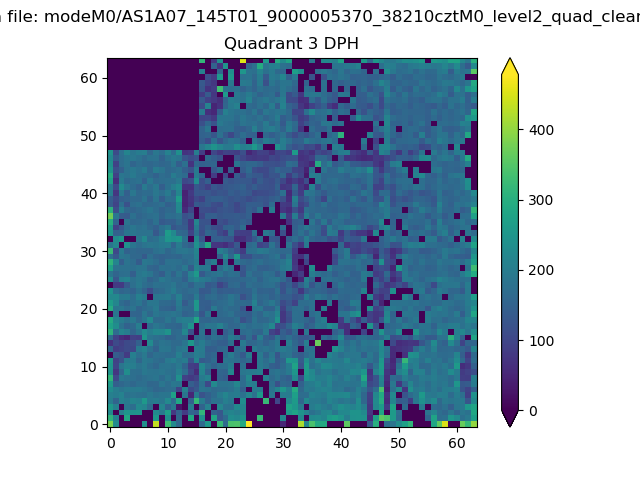 |
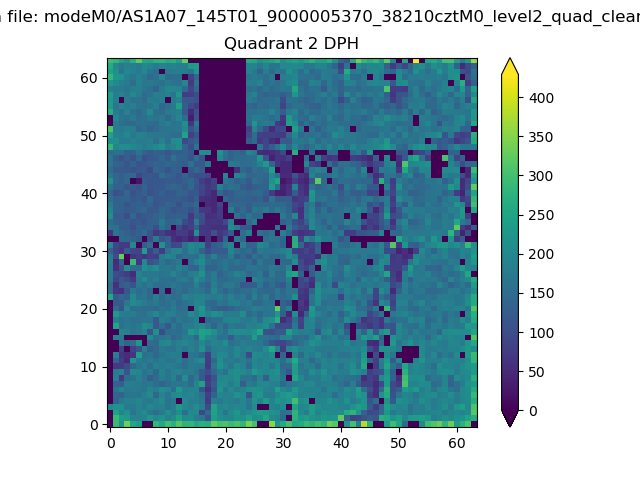 |
Quadrant C |
| Plot type | Count rate plots | Images |
|---|---|---|
| Comparison with Poisson distribution Blue bars denote a histogram of data divided into 1 sec bins. Red curve is a Poisson curve with rate = median count rate of data. |
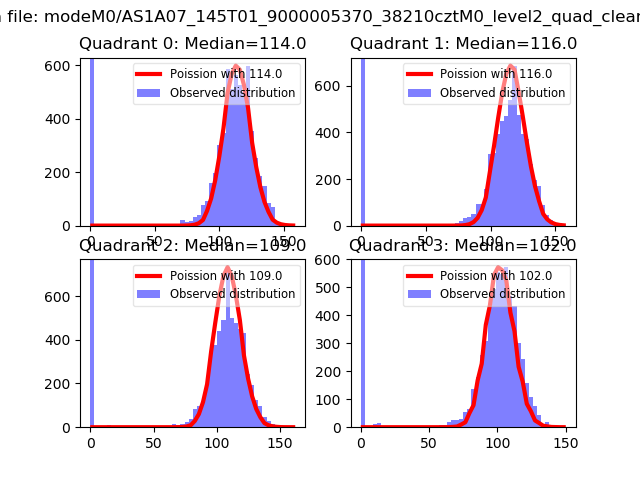 |
 |
| Quadrant-wise count rates Data is divided into 100 sec bins |
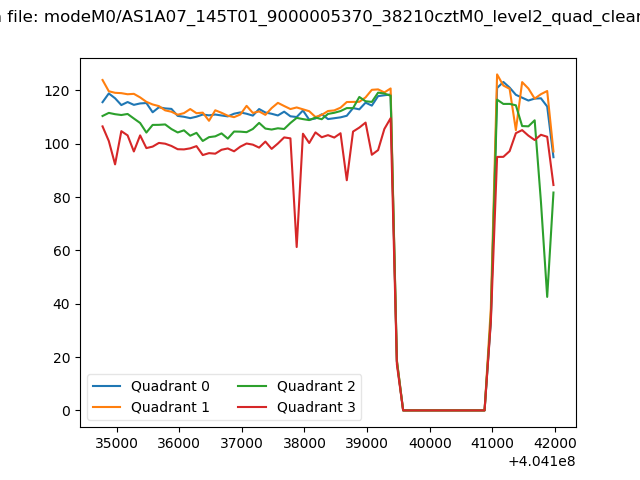 |
|
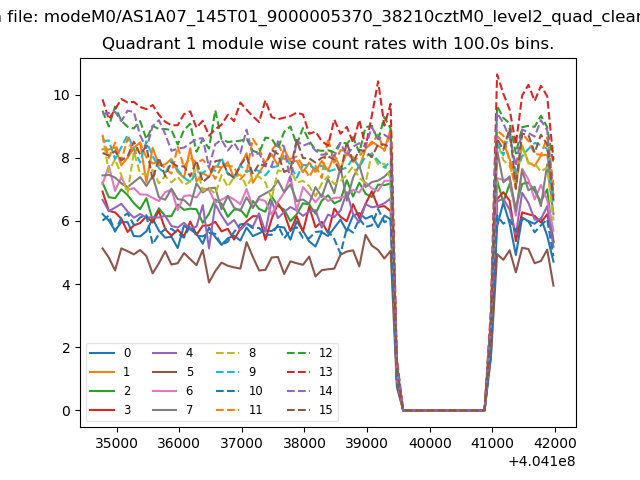
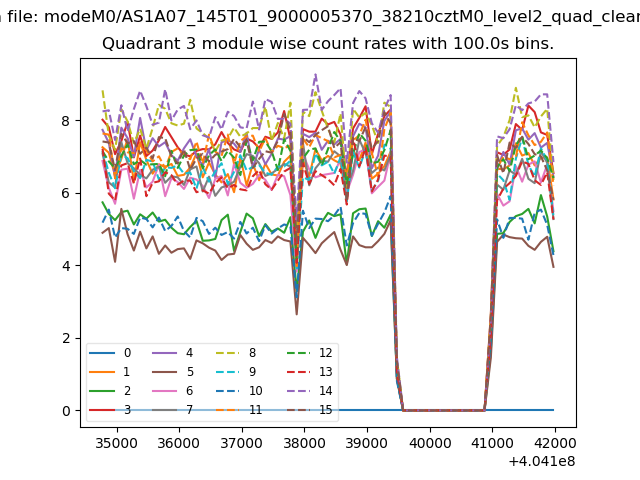
| Module-wise count rates for Quadrant A Data is divided into 100 sec bins |
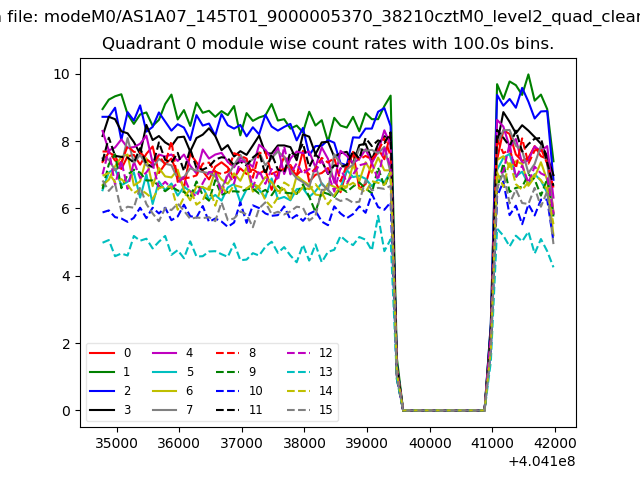 |
 |
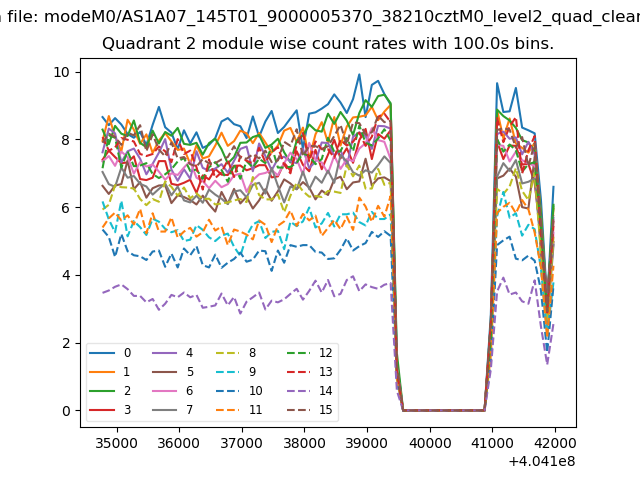
| Module-wise count rates for Quadrant B Data is divided into 100 sec bins |
 |
 |
| Module-wise count rates for Quadrant C Data is divided into 100 sec bins |
 |
 |
| Module-wise count rates for Quadrant D Data is divided into 100 sec bins |
 |
 |
| Parameter | Plot |
|---|---|
| CZT HV Monitor | 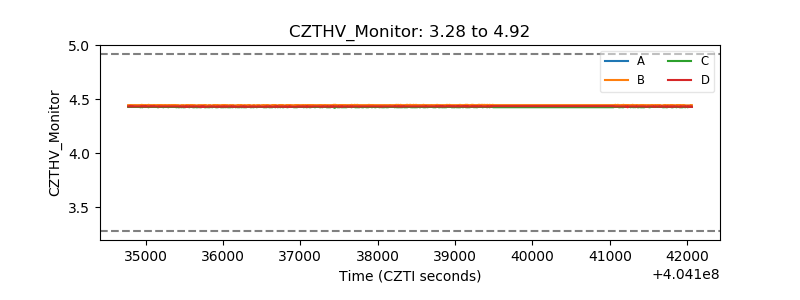 |
| D_VDD | 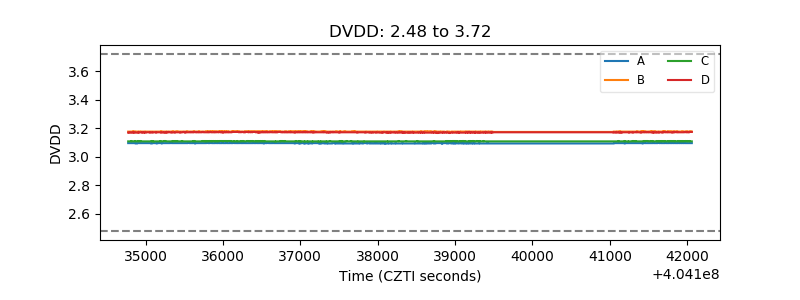 |
| Temperature 1 | 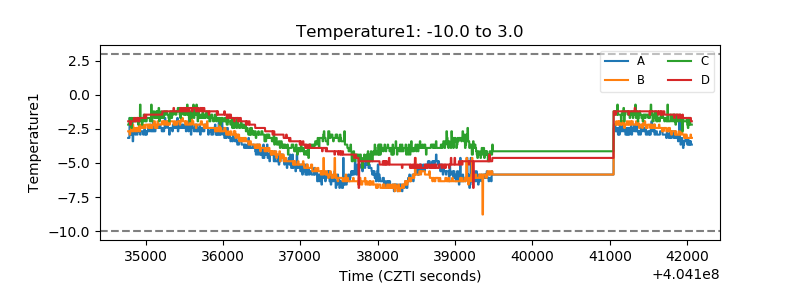 |
| Veto HV Monitor | 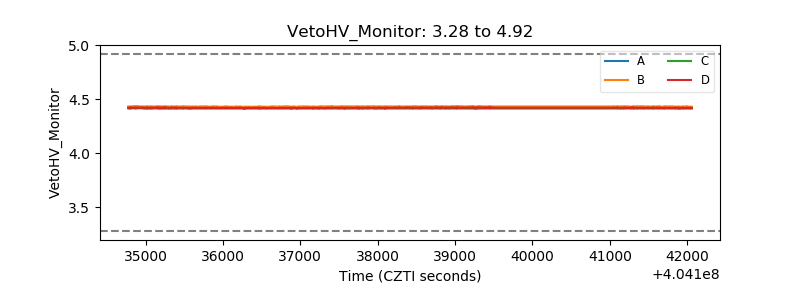 |
| Veto LLD | 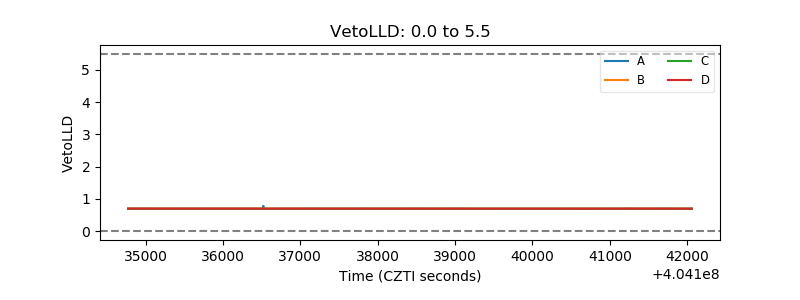 |
| Alpha Counter | 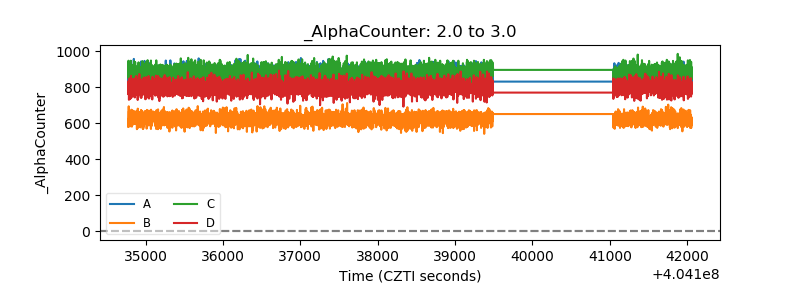 |
| _CPM_Rate | 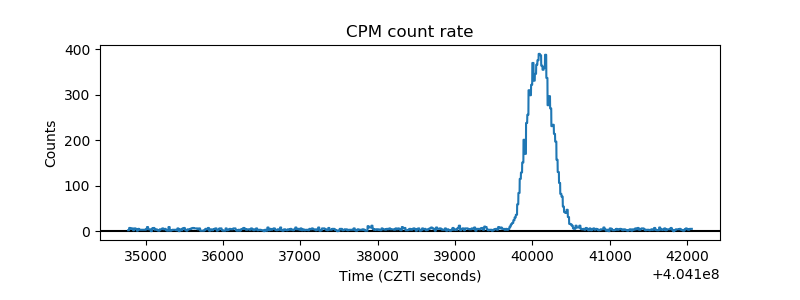 |
| CZT Counter | 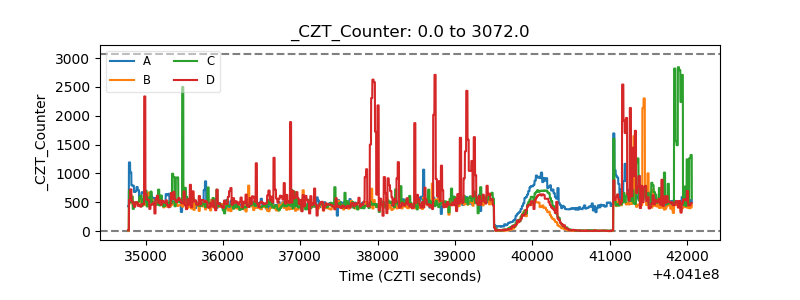 |
| +2.5 Volts monitor | 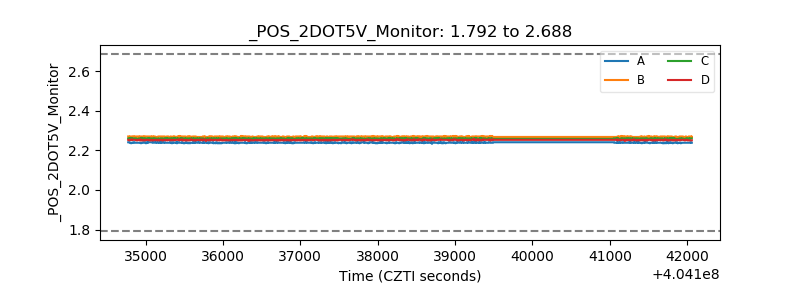 |
| +5 Volts monitor |  |
| _ROLL_ROT | 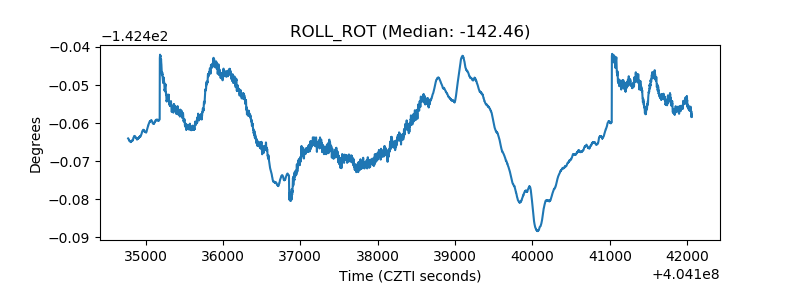 |
| _Roll_DEC | 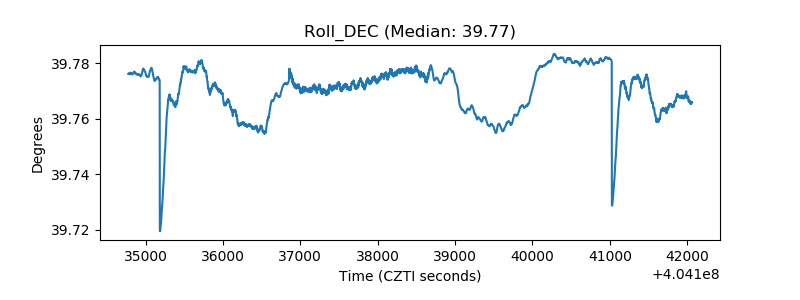 |
| _Roll_RA | 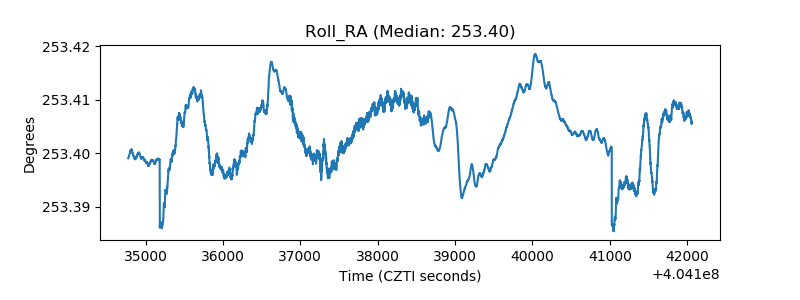 |
| Veto Counter | 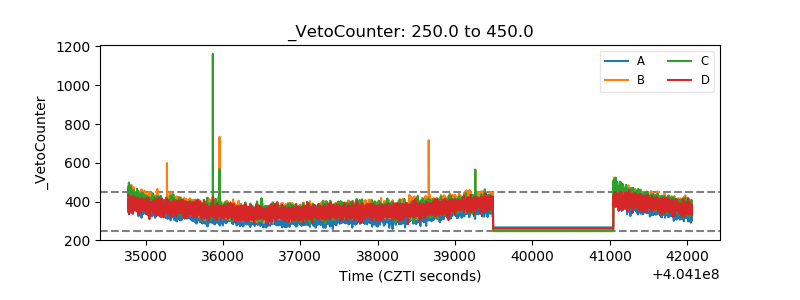 |