| Param | Original file | Final file |
|---|---|---|
| Filename | modeM0/AS1A07_145T01_9000005370_38211cztM0_level2.fits | modeM0/AS1A07_145T01_9000005370_38211cztM0_level2_quad_clean.evt |
| Size (bytes) | 346,656,960 | 91,152,000 |
| Size | 330.6 MB | 86.9 MB |
| Events in quadrant A | 3,168,924 | 615,440 |
| Events in quadrant B | 2,678,150 | 628,740 |
| Events in quadrant C | 3,341,801 | 584,675 |
| Events in quadrant D | 3,220,678 | 551,073 |
| Mode M9 | |||
|---|---|---|---|
| Quadrant | BADHDUFLAG | Total packets | Discarded packets |
| A | 0 | 16 | 0 |
| B | 0 | 16 | 0 |
| C | 0 | 16 | 0 |
| D | 0 | 17 | 0 |
| Mode SS | |||
|---|---|---|---|
| Quadrant | BADHDUFLAG | Total packets | Discarded packets |
| A | 0 | 112 | 0 |
| B | 0 | 112 | 0 |
| C | 0 | 112 | 0 |
| D | 0 | 112 | 0 |
| Mode M0 | |||
|---|---|---|---|
| Quadrant | BADHDUFLAG | Total packets | Discarded packets |
| A | 0 | 12784 | 3 |
| B | 0 | 11612 | 2 |
| C | 0 | 13223 | 2 |
| D | 0 | 13097 | 2 |
| Quadrant | Total seconds | Saturated seconds | Saturation percentage |
|---|---|---|---|
| A | 5424 | 88 | 1.622419% |
| B | 5424 | 72 | 1.327434% |
| C | 5424 | 226 | 4.166667% |
| D | 5424 | 148 | 2.728614% |
Noise dominated data is calculated using 1-second bins in cleaned event files. If a bin has >2000 counts, and if more than 50% of those come from <1% of pixels, then it is considered to be noise-dominated and hence unusable.
| Quadrant | # 1 sec bins | Bins with >0 counts | Bins with >2000 counts | High rate bins dominated by noise | Noise dominated (total time) | Noise dominated (detector-on time) | Marked lightcurve |
|---|---|---|---|---|---|---|---|
| A | 7096 | 5425 | 59 | 59 | 0.83% | 1.09% | 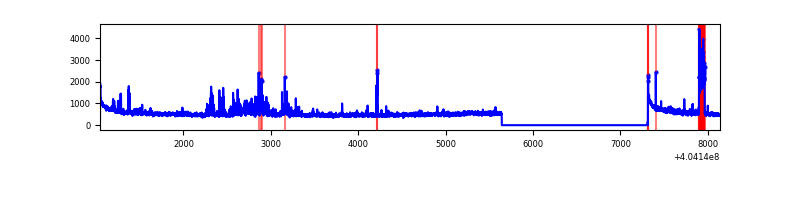 |
| B | 7096 | 5424 | 51 | 51 | 0.72% | 0.94% | 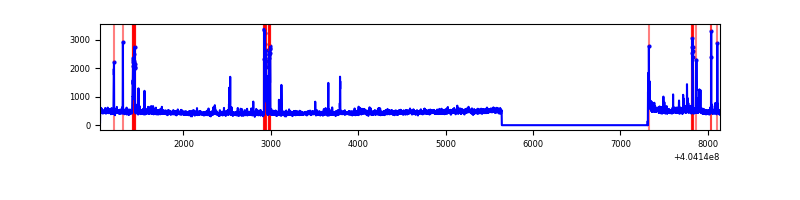 |
| C | 7096 | 5425 | 172 | 172 | 2.42% | 3.17% | 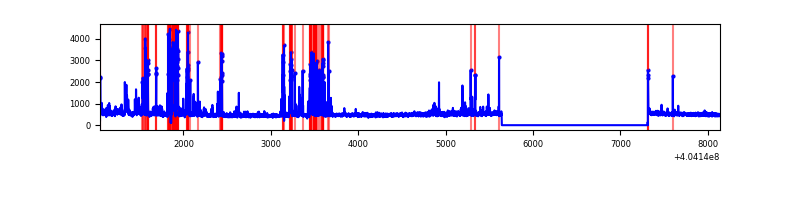 |
| D | 7096 | 5425 | 115 | 115 | 1.62% | 2.12% | 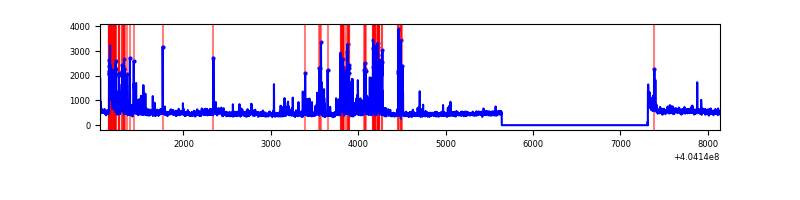 |
Top three noisy pixels from each quadrant. If the there are fewer than three noisy pixels in the level2.evt file, extra rows are filled as -1
| Pixel properties | Quadrant properties | ||||||
|---|---|---|---|---|---|---|---|
| Quadrant | DetID | PixID | Counts | Sigma | Mean | Median | Sigma |
| A | 10 | 83 | 392766 | 3208.83 | 605 | 593 | 122.2 |
| A | 13 | 248 | 302607 | 2471.13 | 605 | 593 | 122.2 |
| A | 9 | 143 | 65714 | 532.83 | 605 | 593 | 122.2 |
| B | 0 | 229 | 128408 | 1094.09 | 605 | 588 | 116.8 |
| B | 15 | 85 | 60141 | 509.75 | 605 | 588 | 116.8 |
| B | 0 | 186 | 49311 | 417.05 | 605 | 588 | 116.8 |
| C | 9 | 236 | 626759 | 4576.28 | 583 | 586 | 136.8 |
| C | 15 | 214 | 224027 | 1632.98 | 583 | 586 | 136.8 |
| C | 14 | 254 | 158015 | 1150.54 | 583 | 586 | 136.8 |
| D | 2 | 16 | 204368 | 1403.44 | 594 | 578 | 145.2 |
| D | 10 | 118 | 191401 | 1314.14 | 594 | 578 | 145.2 |
| D | 7 | 55 | 166880 | 1145.27 | 594 | 578 | 145.2 |
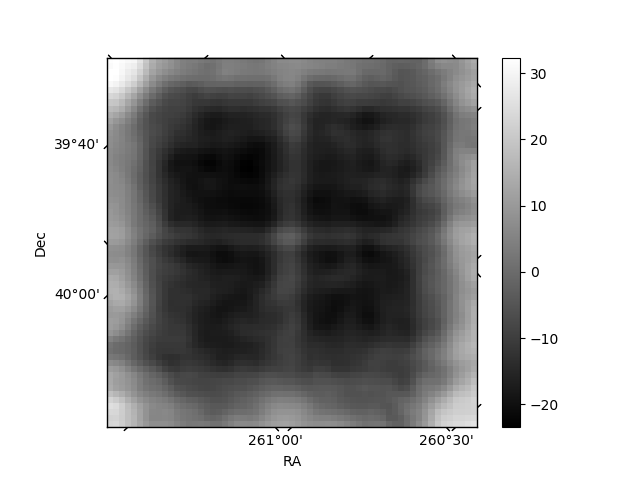
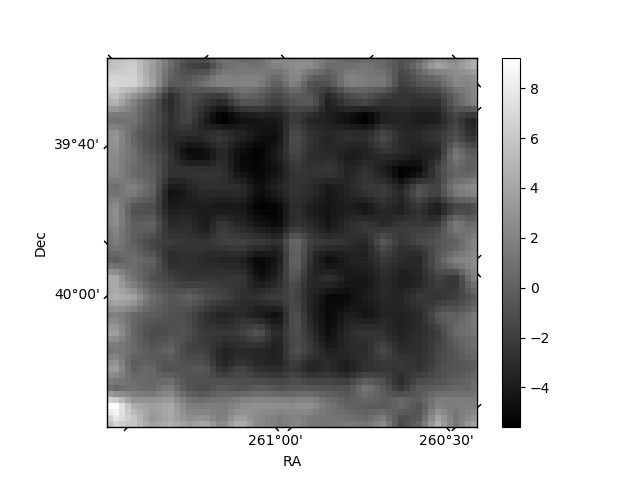
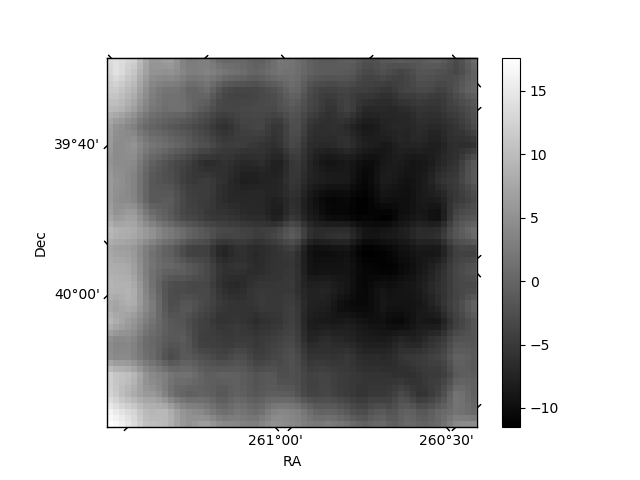
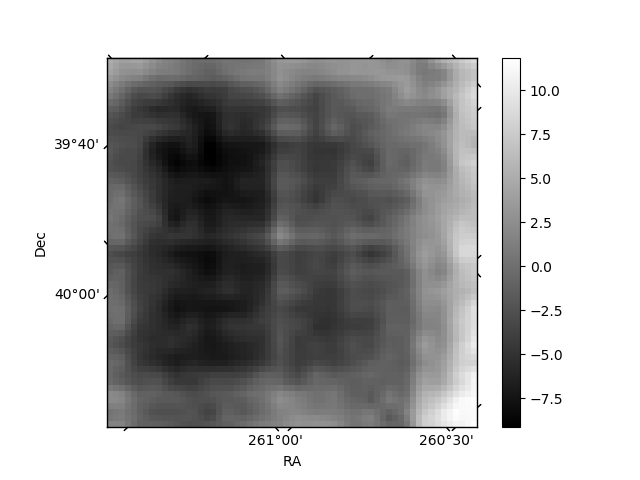
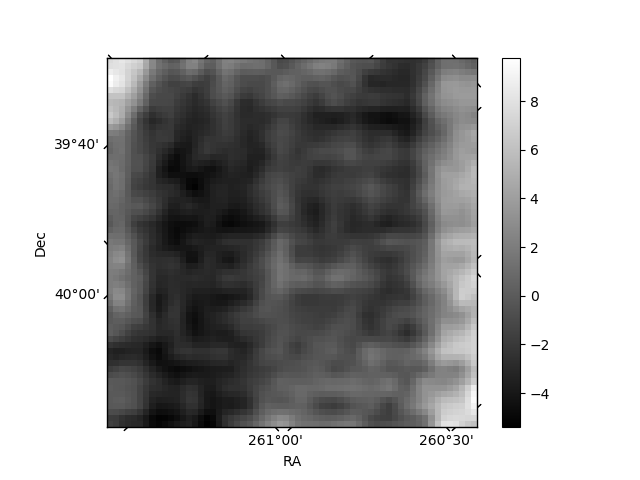
Histogram calculated using DETX and DETY for each event in the final _common_clean file
| Quadrant A | 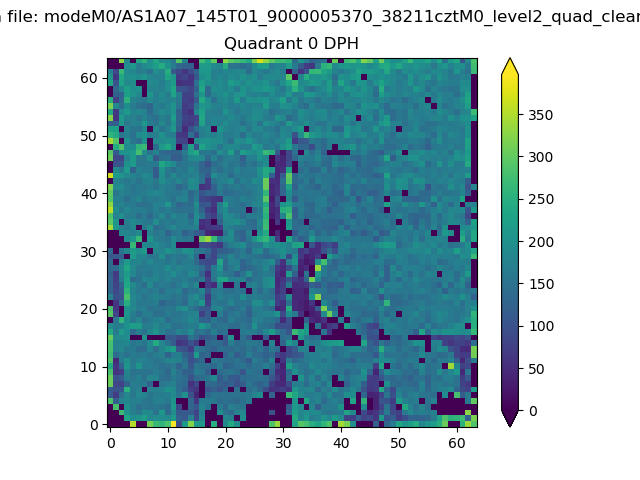 |
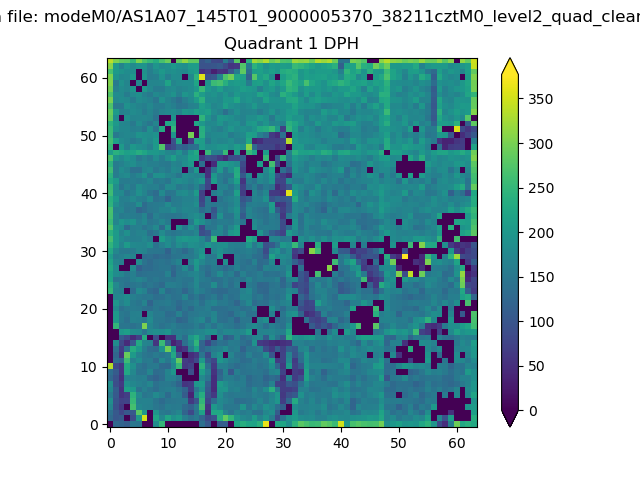 |
Quadrant B |
|---|---|---|---|
| Quadrant D | 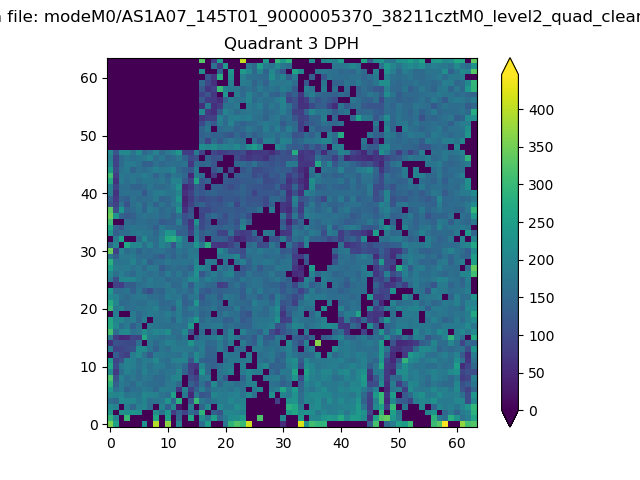 |
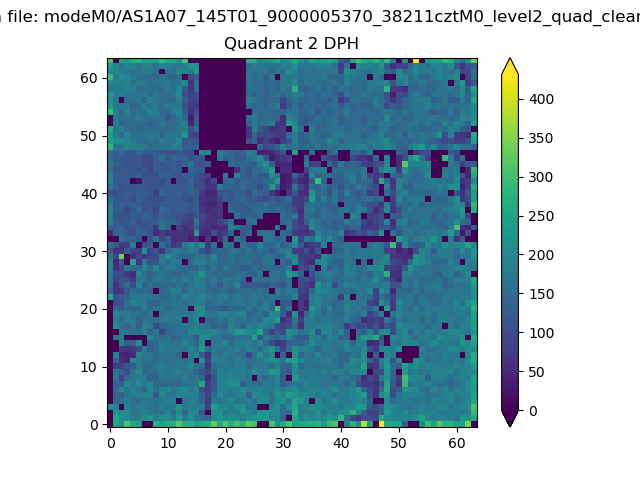 |
Quadrant C |
| Plot type | Count rate plots | Images |
|---|---|---|
| Comparison with Poisson distribution Blue bars denote a histogram of data divided into 1 sec bins. Red curve is a Poisson curve with rate = median count rate of data. |
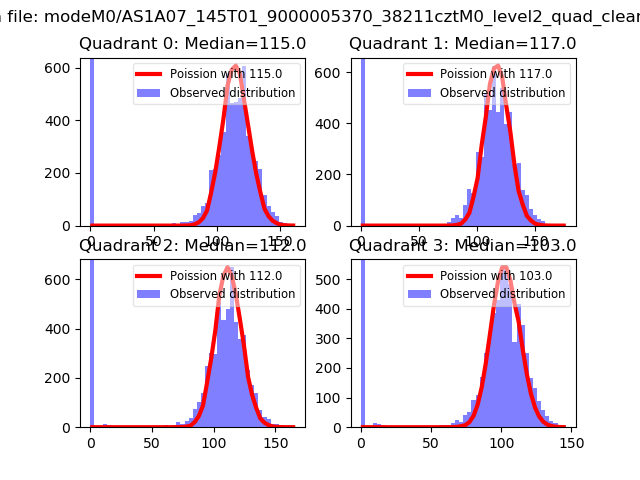 |
 |
| Quadrant-wise count rates Data is divided into 100 sec bins |
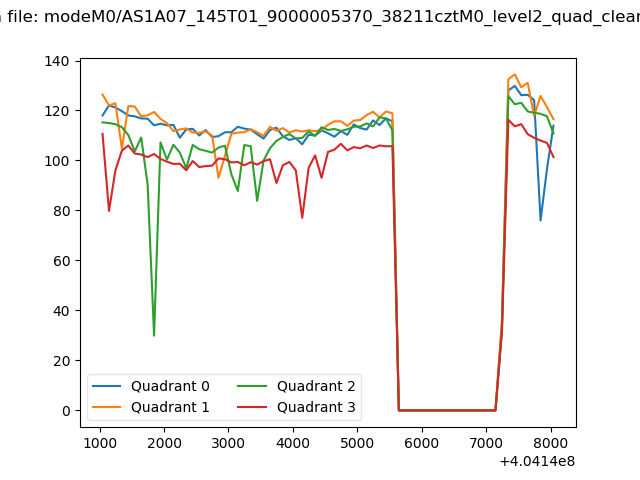 |
|
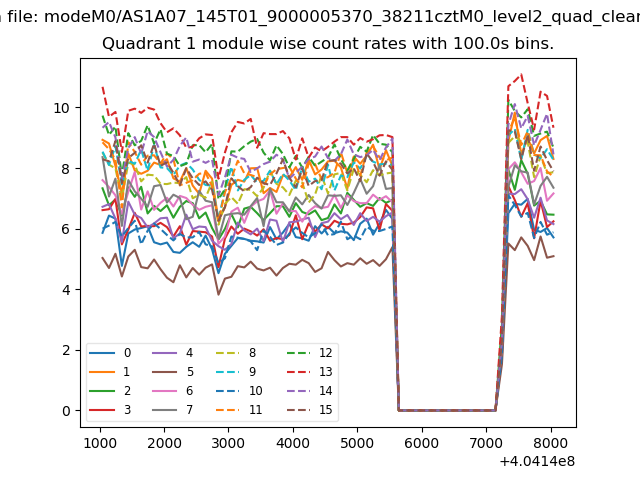
| Module-wise count rates for Quadrant A Data is divided into 100 sec bins |
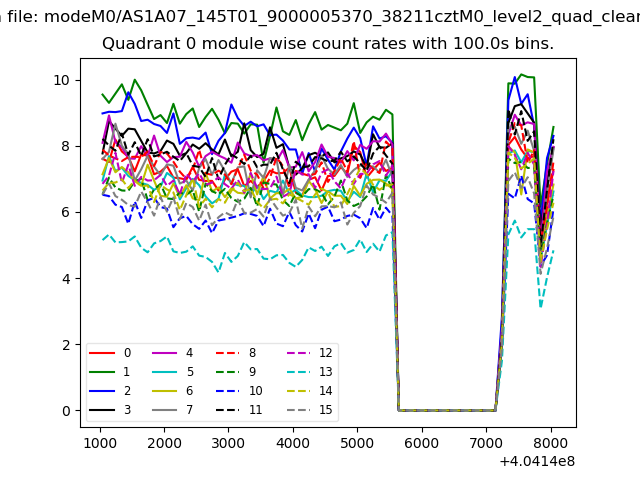 |
 |
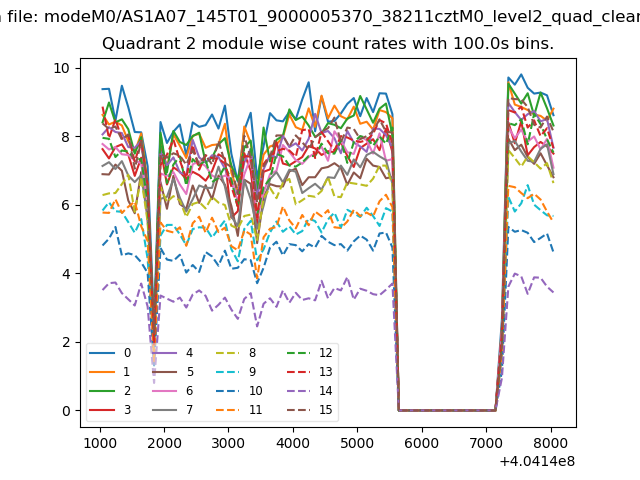
| Module-wise count rates for Quadrant B Data is divided into 100 sec bins |
 |
 |
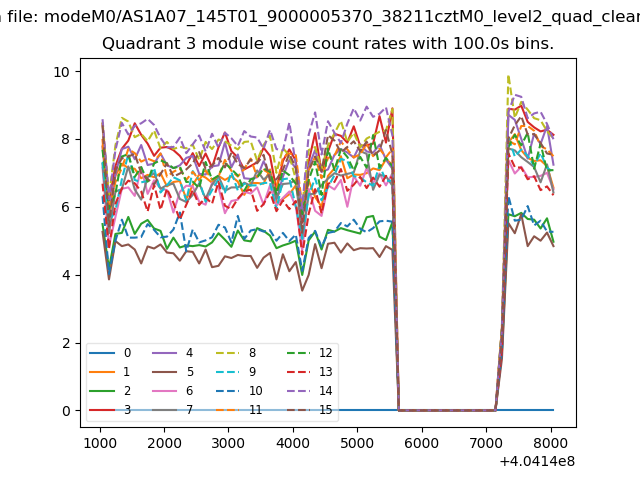
| Module-wise count rates for Quadrant C Data is divided into 100 sec bins |
 |
 |
| Module-wise count rates for Quadrant D Data is divided into 100 sec bins |
 |
 |
| Parameter | Plot |
|---|---|
| CZT HV Monitor | 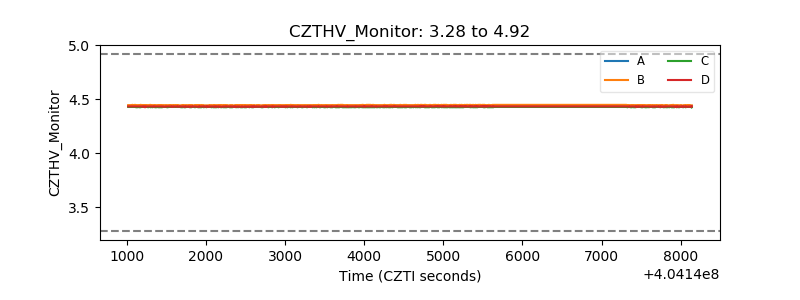 |
| D_VDD | 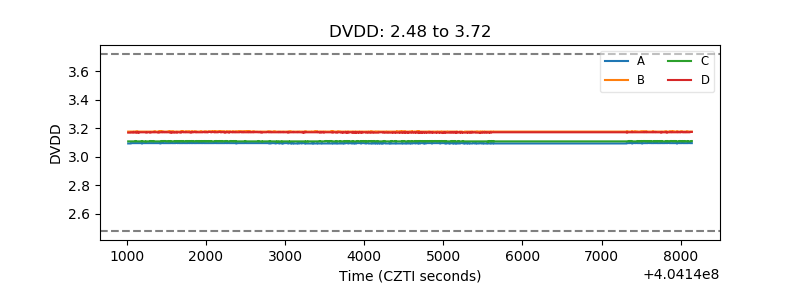 |
| Temperature 1 | 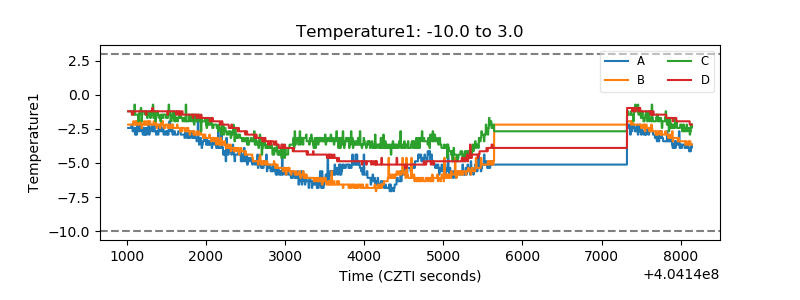 |
| Veto HV Monitor | 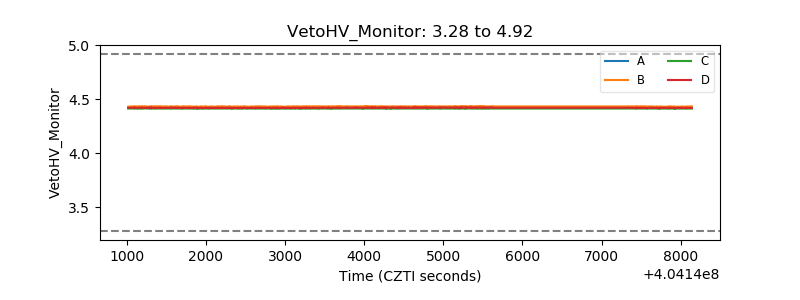 |
| Veto LLD | 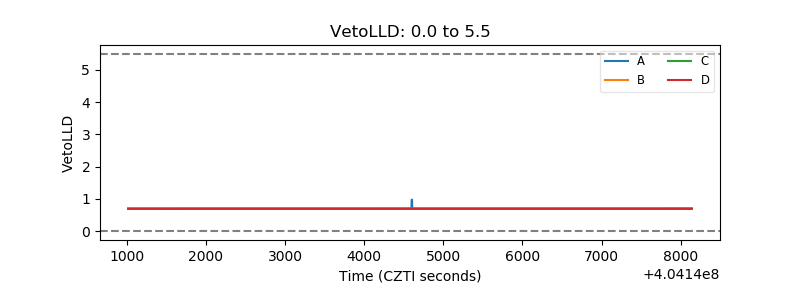 |
| Alpha Counter | 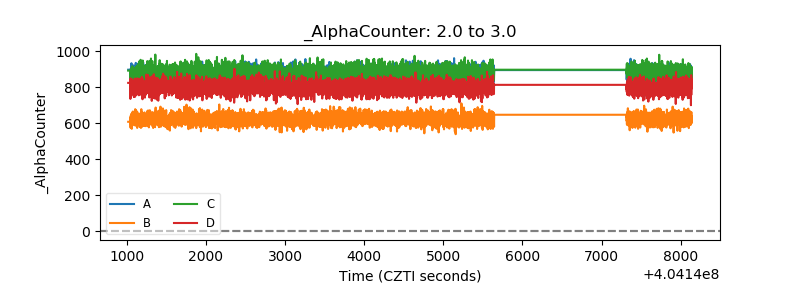 |
| _CPM_Rate | 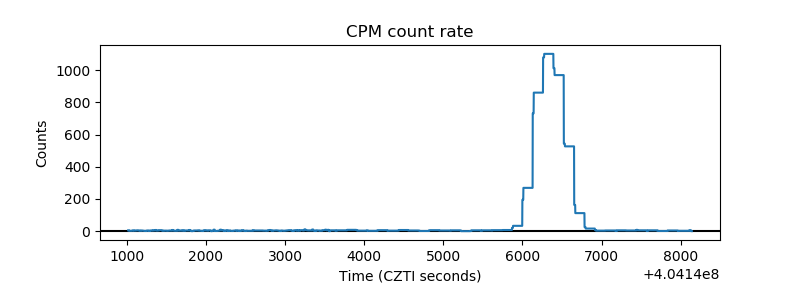 |
| CZT Counter | 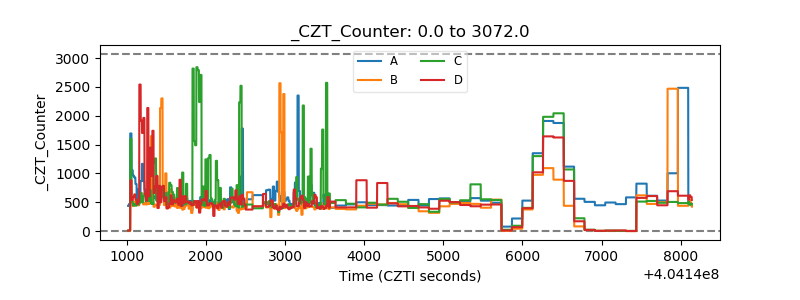 |
| +2.5 Volts monitor | 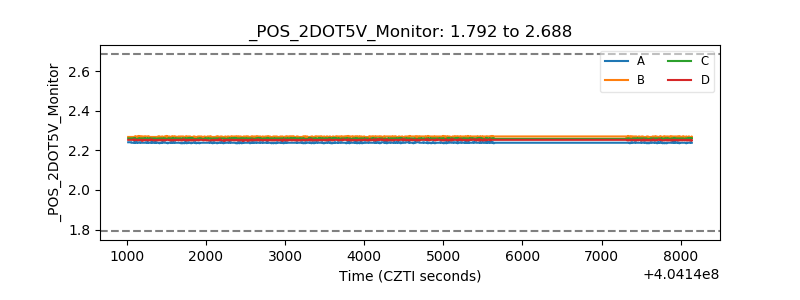 |
| +5 Volts monitor | 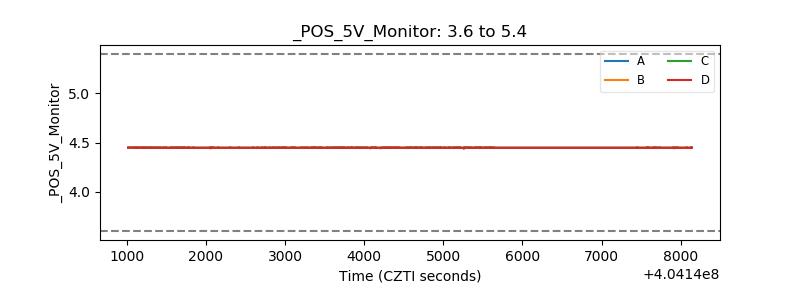 |
| _ROLL_ROT | 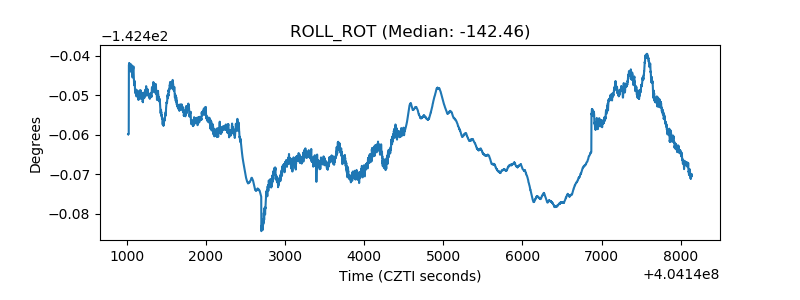 |
| _Roll_DEC | 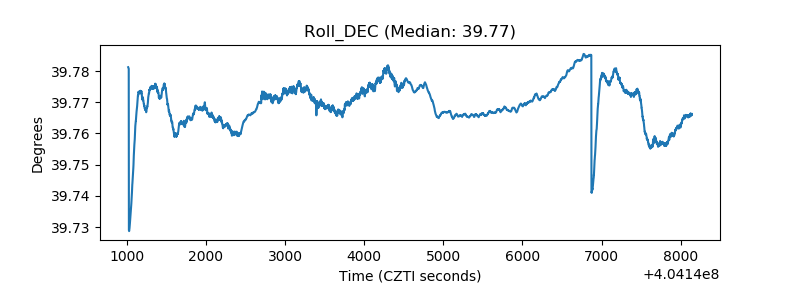 |
| _Roll_RA | 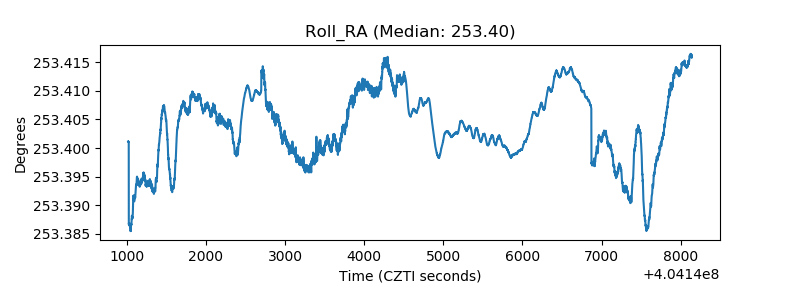 |
| Veto Counter | 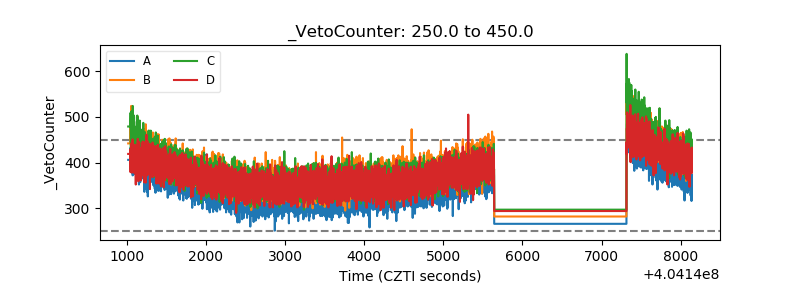 |