| Param | Original file | Final file |
|---|---|---|
| Filename | modeM0/AS1A07_145T01_9000005370_38213cztM0_level2.fits | modeM0/AS1A07_145T01_9000005370_38213cztM0_level2_quad_clean.evt |
| Size (bytes) | 324,636,480 | 94,553,280 |
| Size | 309.6 MB | 90.2 MB |
| Events in quadrant A | 3,030,442 | 630,806 |
| Events in quadrant B | 2,627,874 | 655,555 |
| Events in quadrant C | 2,976,963 | 622,116 |
| Events in quadrant D | 2,961,789 | 576,954 |
| Mode M9 | |||
|---|---|---|---|
| Quadrant | BADHDUFLAG | Total packets | Discarded packets |
| A | 0 | 19 | 0 |
| B | 0 | 19 | 0 |
| C | 0 | 19 | 0 |
| D | 0 | 20 | 0 |
| Mode SS | |||
|---|---|---|---|
| Quadrant | BADHDUFLAG | Total packets | Discarded packets |
| A | 0 | 112 | 0 |
| B | 0 | 112 | 0 |
| C | 0 | 112 | 0 |
| D | 0 | 112 | 0 |
| Mode M0 | |||
|---|---|---|---|
| Quadrant | BADHDUFLAG | Total packets | Discarded packets |
| A | 0 | 12317 | 3 |
| B | 0 | 11346 | 2 |
| C | 0 | 12085 | 2 |
| D | 0 | 12378 | 2 |
| Quadrant | Total seconds | Saturated seconds | Saturation percentage |
|---|---|---|---|
| A | 5389 | 80 | 1.484505% |
| B | 5389 | 27 | 0.501021% |
| C | 5389 | 56 | 1.039154% |
| D | 5389 | 42 | 0.779365% |
Noise dominated data is calculated using 1-second bins in cleaned event files. If a bin has >2000 counts, and if more than 50% of those come from <1% of pixels, then it is considered to be noise-dominated and hence unusable.
| Quadrant | # 1 sec bins | Bins with >0 counts | Bins with >2000 counts | High rate bins dominated by noise | Noise dominated (total time) | Noise dominated (detector-on time) | Marked lightcurve |
|---|---|---|---|---|---|---|---|
| A | 7212 | 5390 | 62 | 62 | 0.86% | 1.15% | 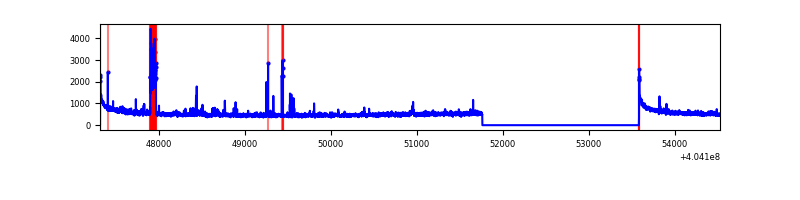 |
| B | 7212 | 5389 | 12 | 12 | 0.17% | 0.22% | 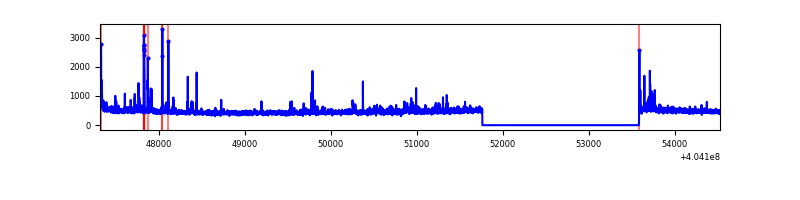 |
| C | 7212 | 5390 | 45 | 45 | 0.62% | 0.83% | 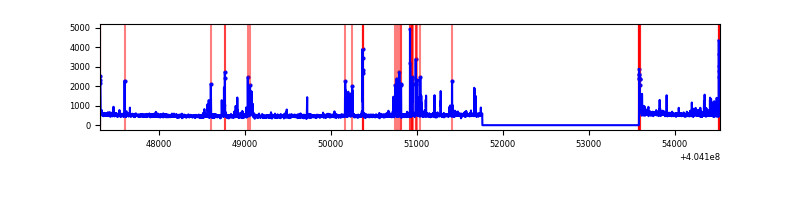 |
| D | 7212 | 5390 | 37 | 37 | 0.51% | 0.69% | 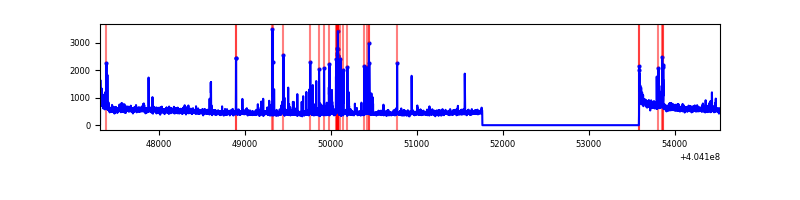 |
Top three noisy pixels from each quadrant. If the there are fewer than three noisy pixels in the level2.evt file, extra rows are filled as -1
| Pixel properties | Quadrant properties | ||||||
|---|---|---|---|---|---|---|---|
| Quadrant | DetID | PixID | Counts | Sigma | Mean | Median | Sigma |
| A | 10 | 83 | 392831 | 3177.39 | 610 | 599 | 123.4 |
| A | 13 | 248 | 170677 | 1377.77 | 610 | 599 | 123.4 |
| A | 12 | 189 | 53312 | 427.02 | 610 | 599 | 123.4 |
| B | 15 | 85 | 64024 | 533.58 | 615 | 598 | 118.9 |
| B | 0 | 183 | 42753 | 354.63 | 615 | 598 | 118.9 |
| B | 0 | 229 | 28443 | 234.25 | 615 | 598 | 118.9 |
| C | 15 | 214 | 226961 | 1592.39 | 606 | 611 | 142.1 |
| C | 9 | 236 | 164901 | 1155.79 | 606 | 611 | 142.1 |
| C | 14 | 254 | 111915 | 783.03 | 606 | 611 | 142.1 |
| D | 2 | 16 | 221264 | 1495.51 | 606 | 591 | 147.6 |
| D | 13 | 249 | 94726 | 637.96 | 606 | 591 | 147.6 |
| D | 10 | 203 | 79020 | 531.52 | 606 | 591 | 147.6 |
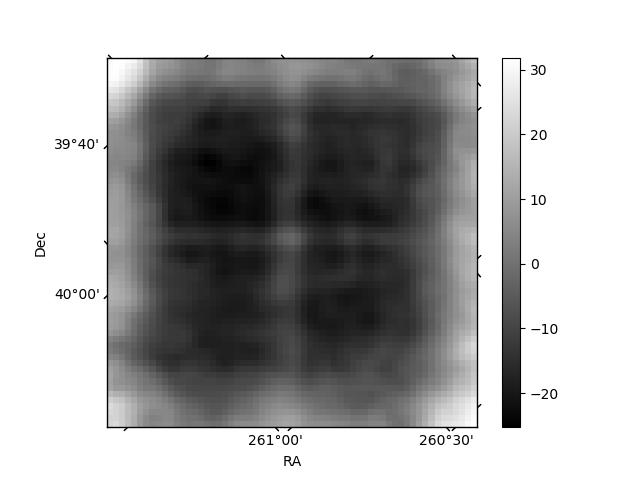
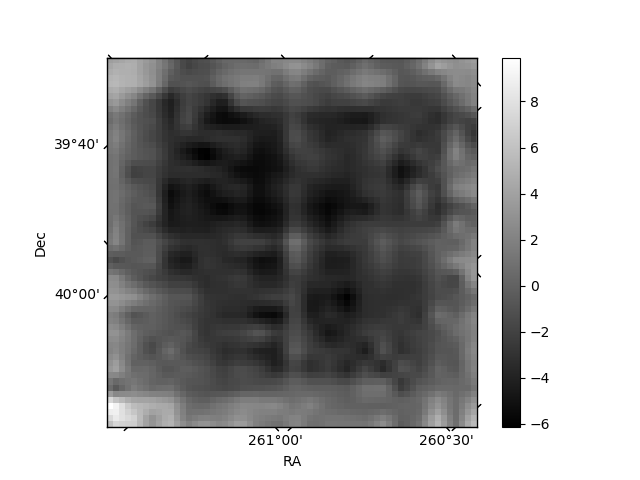
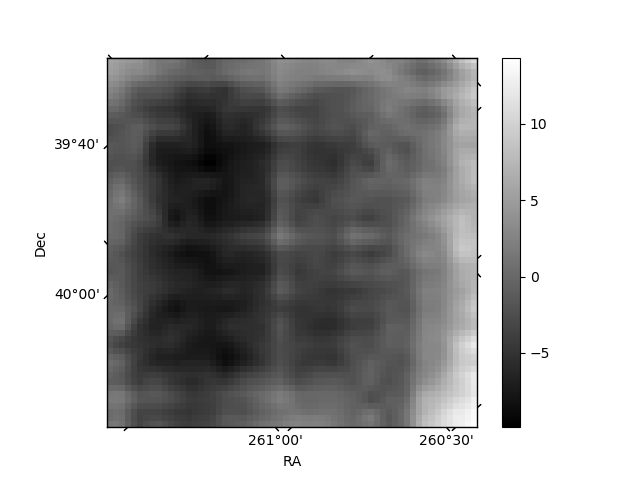
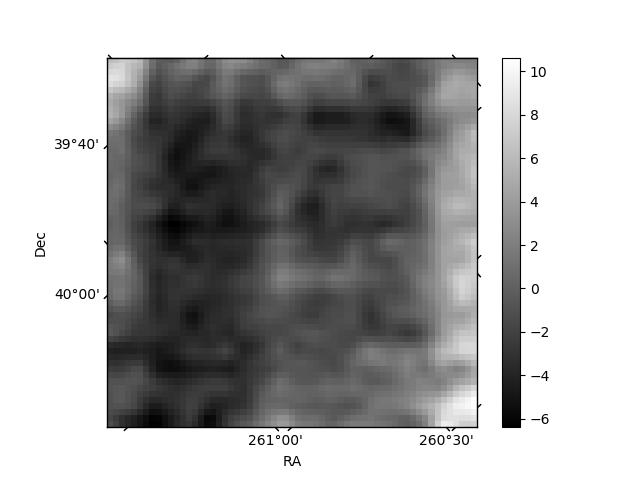
Histogram calculated using DETX and DETY for each event in the final _common_clean file
| Quadrant A | 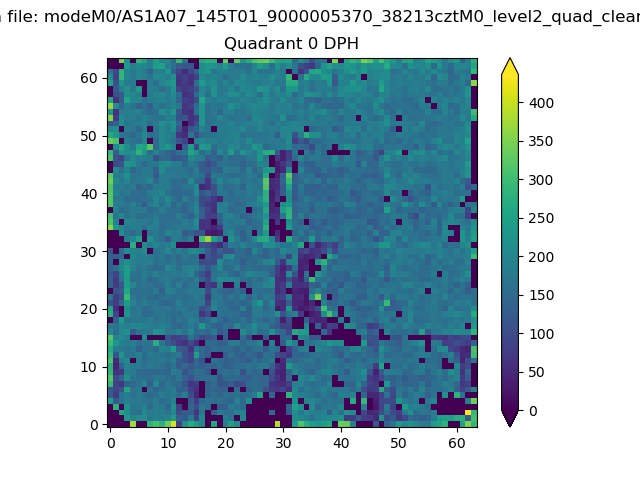 |
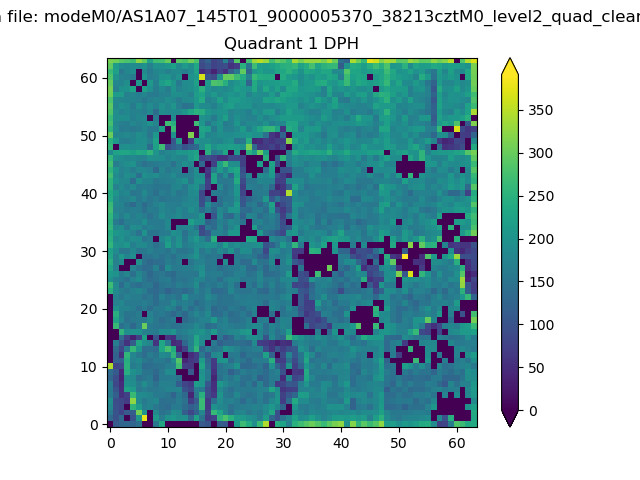 |
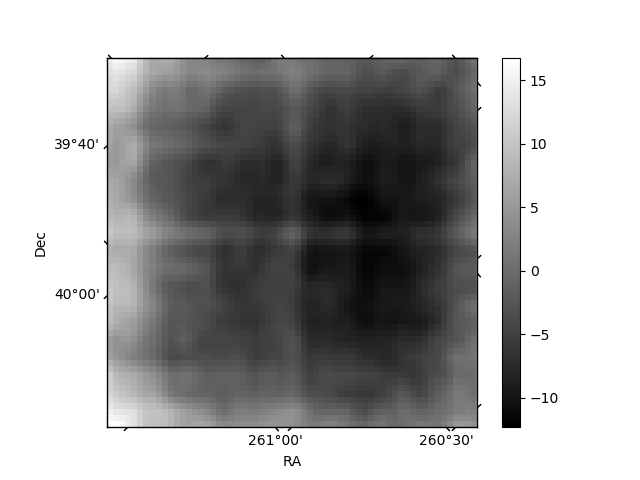
Quadrant B |
|---|---|---|---|
| Quadrant D | 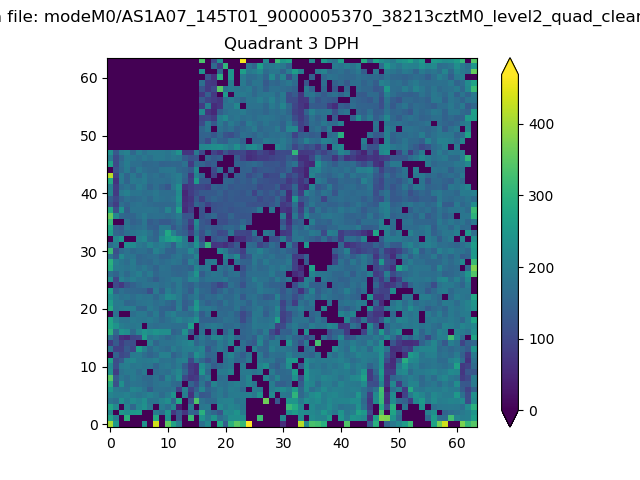 |
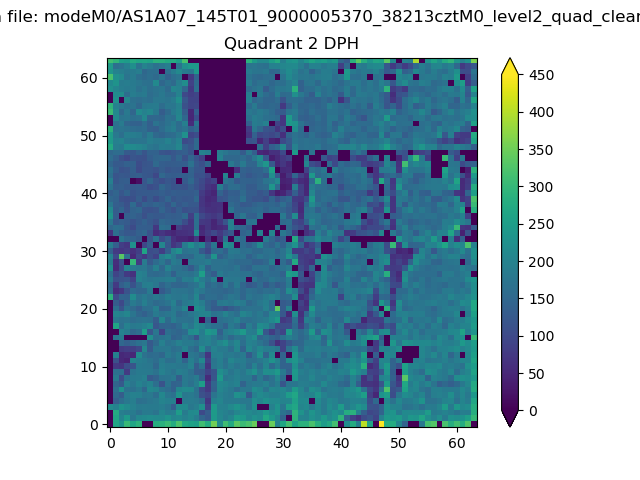 |
Quadrant C |
| Plot type | Count rate plots | Images |
|---|---|---|
| Comparison with Poisson distribution Blue bars denote a histogram of data divided into 1 sec bins. Red curve is a Poisson curve with rate = median count rate of data. |
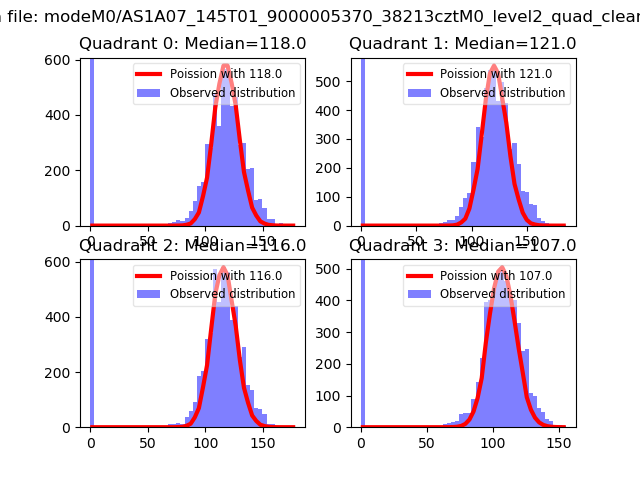 |
 |
| Quadrant-wise count rates Data is divided into 100 sec bins |
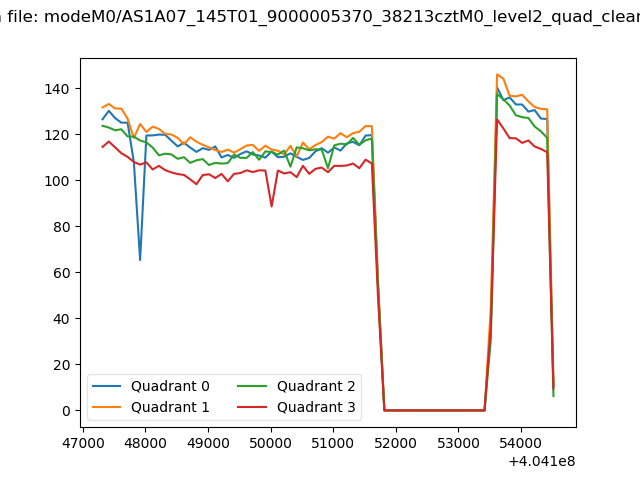 |
|
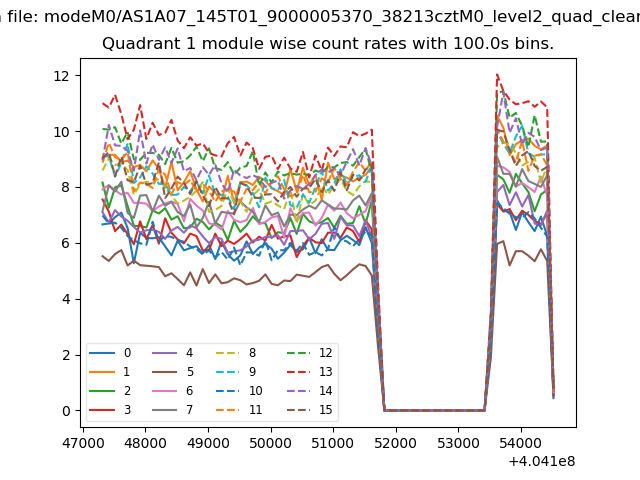
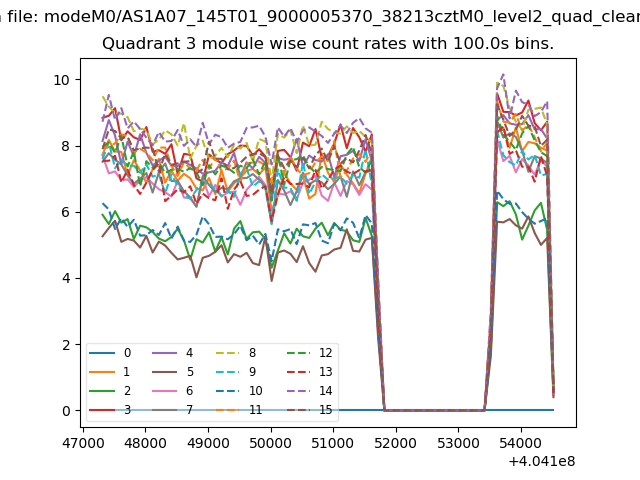
| Module-wise count rates for Quadrant A Data is divided into 100 sec bins |
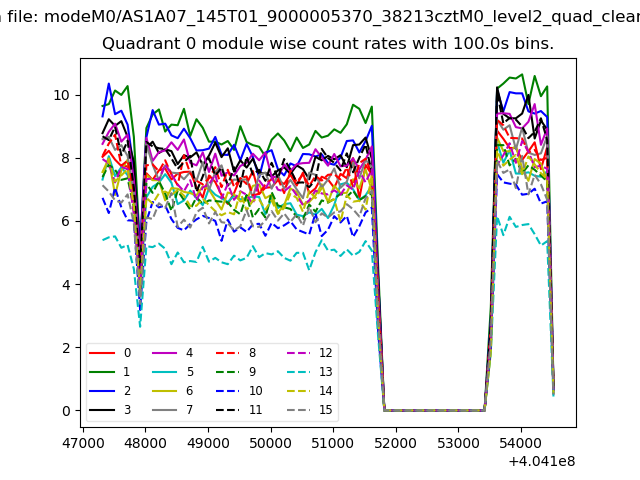 |
 |
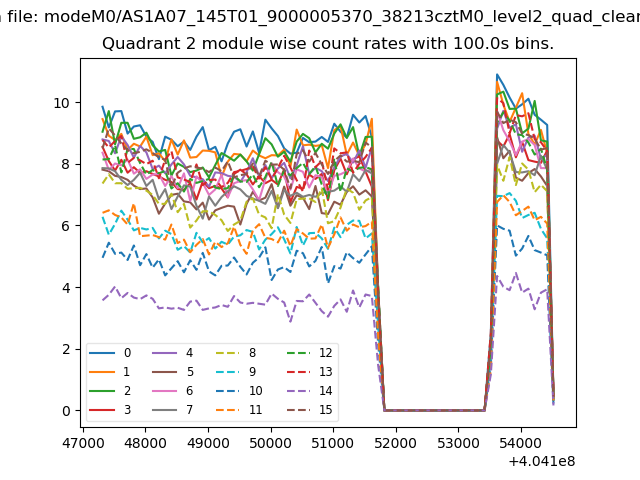
| Module-wise count rates for Quadrant B Data is divided into 100 sec bins |
 |
 |
| Module-wise count rates for Quadrant C Data is divided into 100 sec bins |
 |
 |
| Module-wise count rates for Quadrant D Data is divided into 100 sec bins |
 |
 |
| Parameter | Plot |
|---|---|
| CZT HV Monitor | 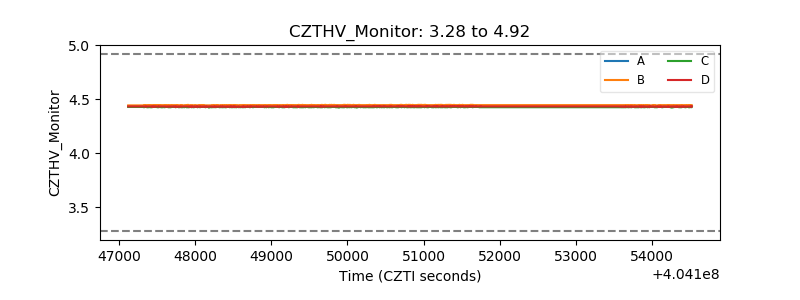 |
| D_VDD | 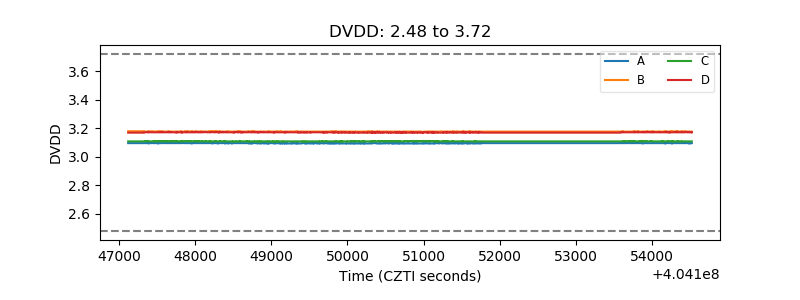 |
| Temperature 1 | 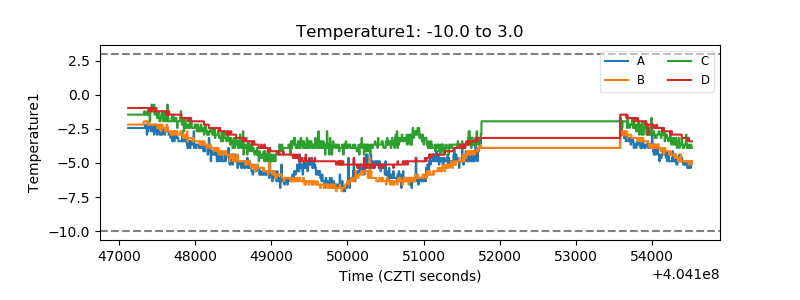 |
| Veto HV Monitor | 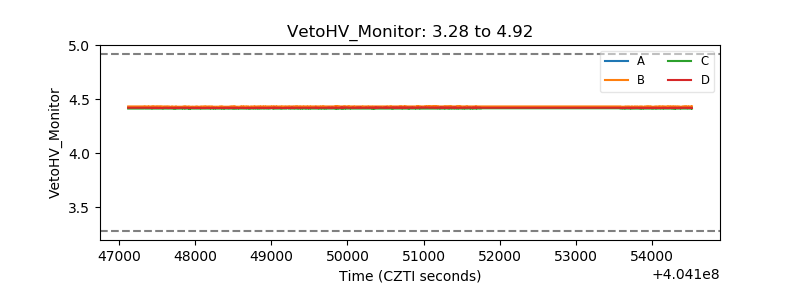 |
| Veto LLD | 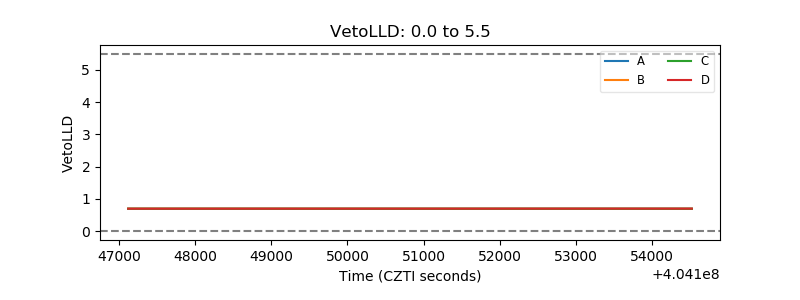 |
| Alpha Counter | 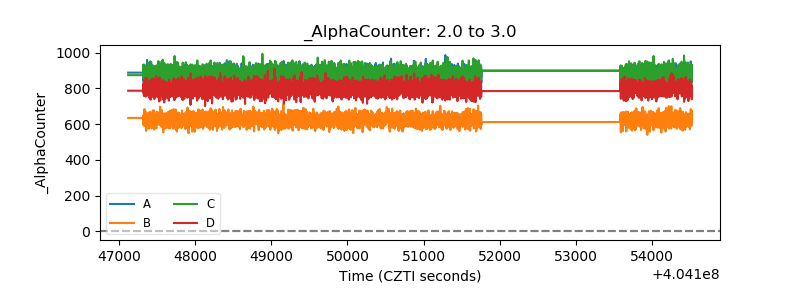 |
| _CPM_Rate | 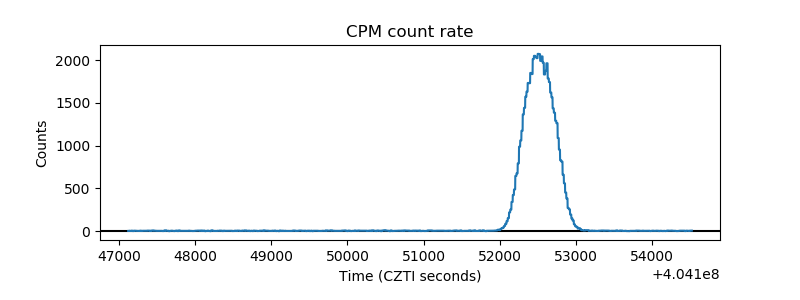 |
| CZT Counter | 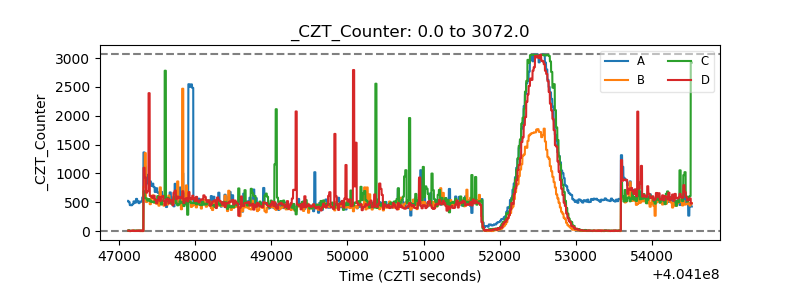 |
| +2.5 Volts monitor | 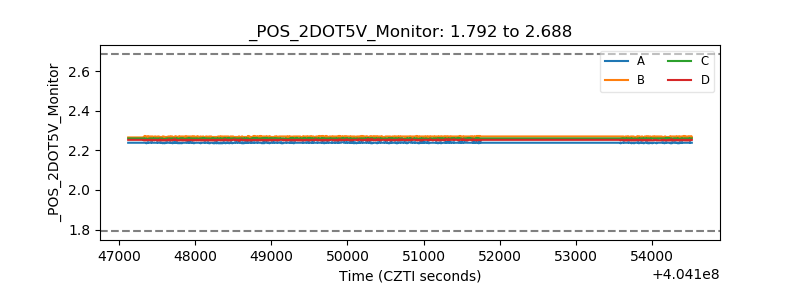 |
| +5 Volts monitor | 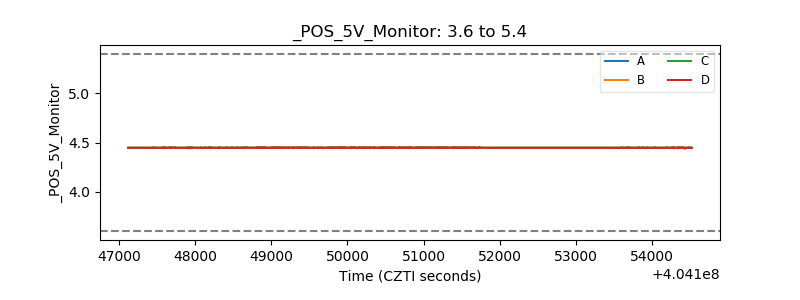 |
| _ROLL_ROT | 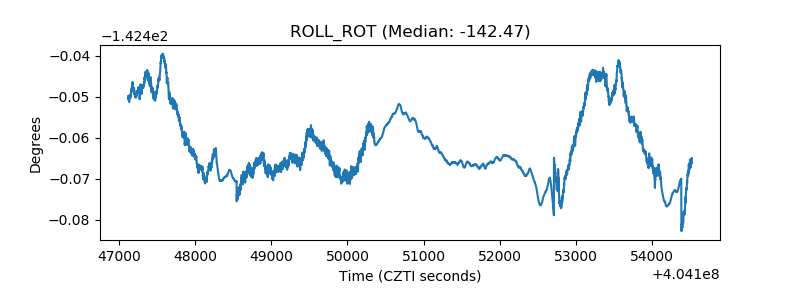 |
| _Roll_DEC | 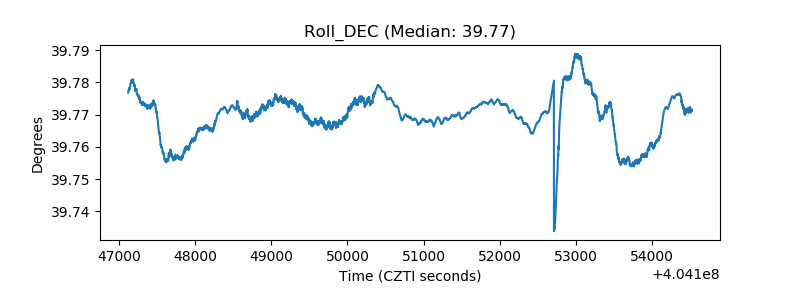 |
| _Roll_RA | 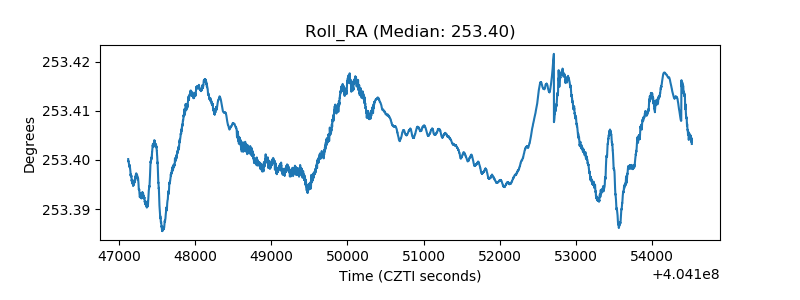 |
| Veto Counter | 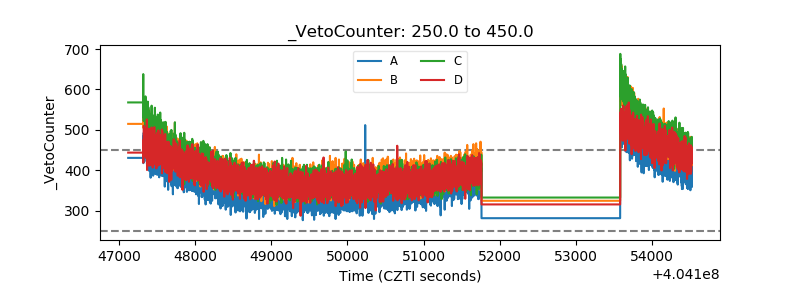 |