| Param | Original file | Final file |
|---|---|---|
| Filename | modeM0/AS1A07_145T01_9000005370_38214cztM0_level2.fits | modeM0/AS1A07_145T01_9000005370_38214cztM0_level2_quad_clean.evt |
| Size (bytes) | 326,496,960 | 94,769,280 |
| Size | 311.4 MB | 90.4 MB |
| Events in quadrant A | 2,976,064 | 636,682 |
| Events in quadrant B | 2,541,084 | 660,574 |
| Events in quadrant C | 3,186,579 | 623,751 |
| Events in quadrant D | 2,977,626 | 584,873 |
| Mode M9 | |||
|---|---|---|---|
| Quadrant | BADHDUFLAG | Total packets | Discarded packets |
| A | 0 | 22 | 0 |
| B | 0 | 22 | 0 |
| C | 0 | 22 | 0 |
| D | 0 | 23 | 0 |
| Mode SS | |||
|---|---|---|---|
| Quadrant | BADHDUFLAG | Total packets | Discarded packets |
| A | 0 | 106 | 0 |
| B | 0 | 106 | 0 |
| C | 0 | 106 | 0 |
| D | 0 | 106 | 0 |
| Mode M0 | |||
|---|---|---|---|
| Quadrant | BADHDUFLAG | Total packets | Discarded packets |
| A | 0 | 11991 | 3 |
| B | 0 | 10802 | 2 |
| C | 0 | 12542 | 2 |
| D | 0 | 12126 | 2 |
| Quadrant | Total seconds | Saturated seconds | Saturation percentage |
|---|---|---|---|
| A | 5192 | 29 | 0.558552% |
| B | 5192 | 14 | 0.269646% |
| C | 5192 | 134 | 2.580894% |
| D | 5192 | 29 | 0.558552% |
Noise dominated data is calculated using 1-second bins in cleaned event files. If a bin has >2000 counts, and if more than 50% of those come from <1% of pixels, then it is considered to be noise-dominated and hence unusable.
| Quadrant | # 1 sec bins | Bins with >0 counts | Bins with >2000 counts | High rate bins dominated by noise | Noise dominated (total time) | Noise dominated (detector-on time) | Marked lightcurve |
|---|---|---|---|---|---|---|---|
| A | 7134 | 5193 | 27 | 27 | 0.38% | 0.52% | 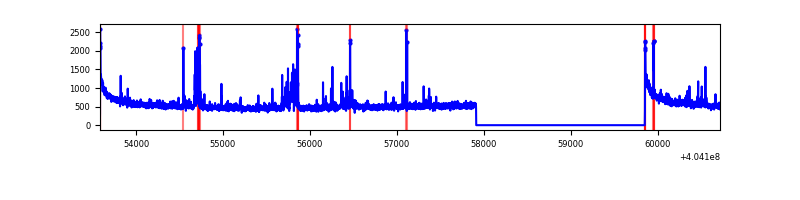 |
| B | 7134 | 5193 | 4 | 4 | 0.06% | 0.08% | 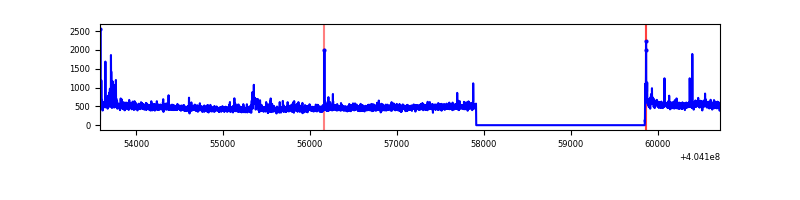 |
| C | 7134 | 5192 | 125 | 125 | 1.75% | 2.41% | 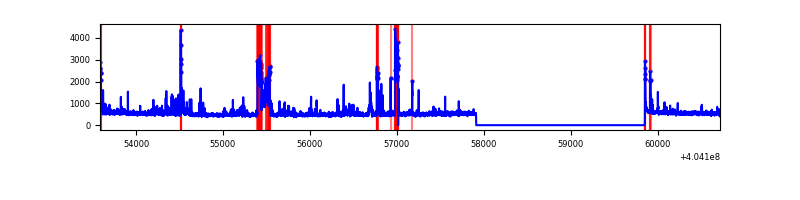 |
| D | 7134 | 5193 | 24 | 24 | 0.34% | 0.46% | 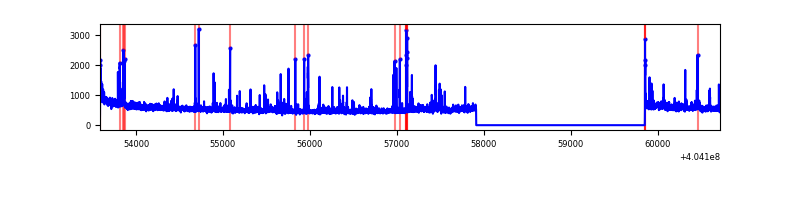 |
Top three noisy pixels from each quadrant. If the there are fewer than three noisy pixels in the level2.evt file, extra rows are filled as -1
| Pixel properties | Quadrant properties | ||||||
|---|---|---|---|---|---|---|---|
| Quadrant | DetID | PixID | Counts | Sigma | Mean | Median | Sigma |
| A | 10 | 83 | 377450 | 3070.64 | 608 | 595 | 122.7 |
| A | 13 | 248 | 190664 | 1548.7 | 608 | 595 | 122.7 |
| A | 9 | 143 | 23754 | 188.7 | 608 | 595 | 122.7 |
| B | 0 | 183 | 60249 | 503.89 | 614 | 598 | 118.4 |
| B | 5 | 172 | 16156 | 131.42 | 614 | 598 | 118.4 |
| B | 15 | 85 | 14407 | 116.65 | 614 | 598 | 118.4 |
| C | 14 | 254 | 449712 | 3214.89 | 600 | 605 | 139.7 |
| C | 15 | 214 | 215737 | 1540.0 | 600 | 605 | 139.7 |
| C | 5 | 250 | 59882 | 424.33 | 600 | 605 | 139.7 |
| D | 10 | 203 | 262335 | 1783.91 | 602 | 587 | 146.7 |
| D | 2 | 16 | 81466 | 551.22 | 602 | 587 | 146.7 |
| D | 13 | 138 | 81349 | 550.42 | 602 | 587 | 146.7 |
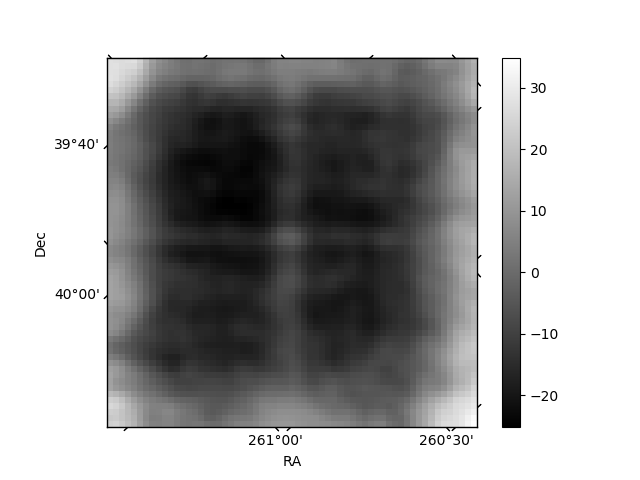
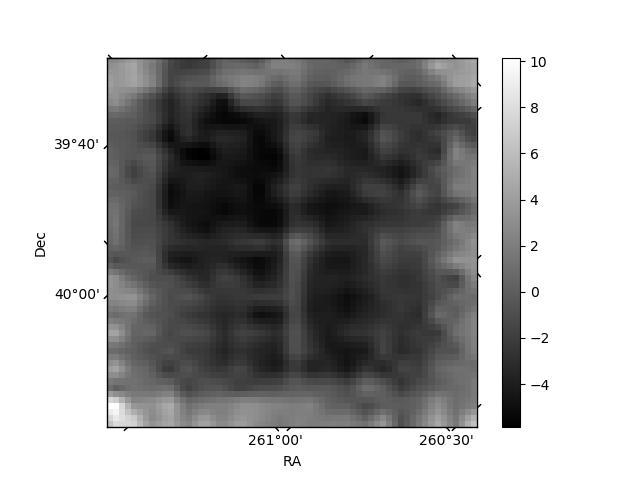
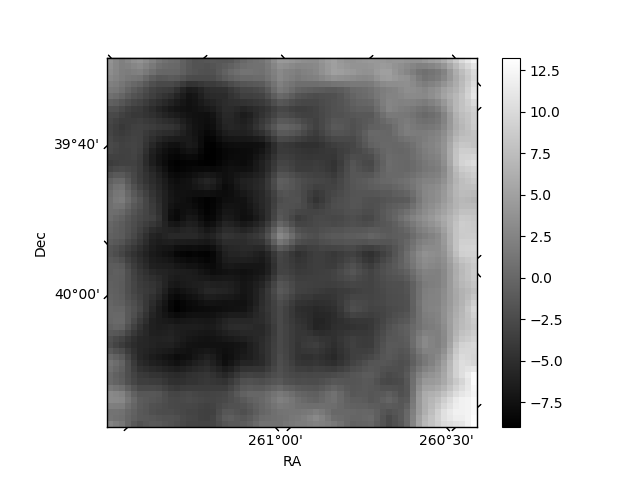
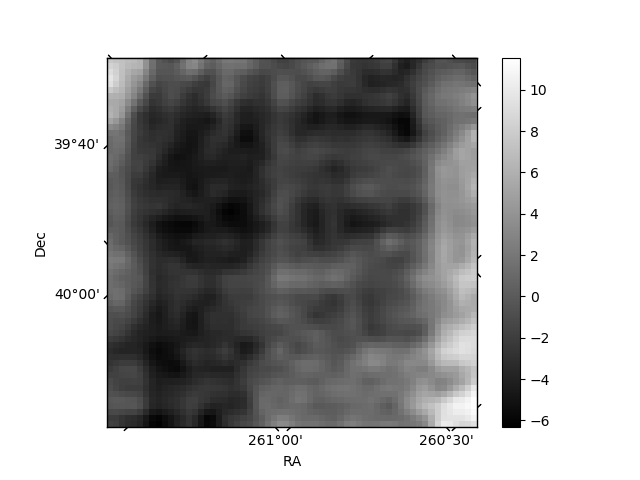
Histogram calculated using DETX and DETY for each event in the final _common_clean file
| Quadrant A | 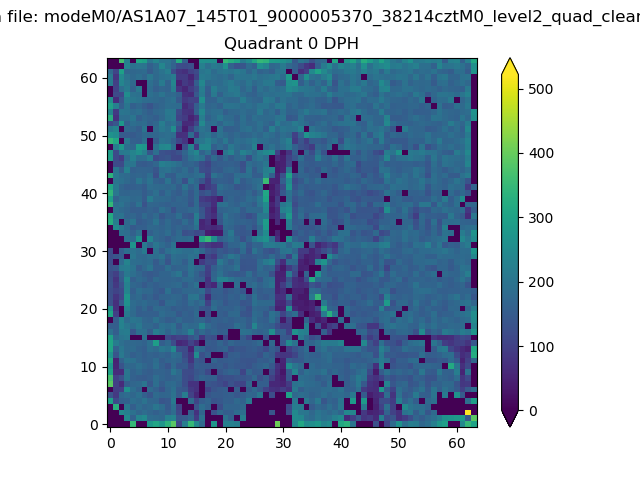 |
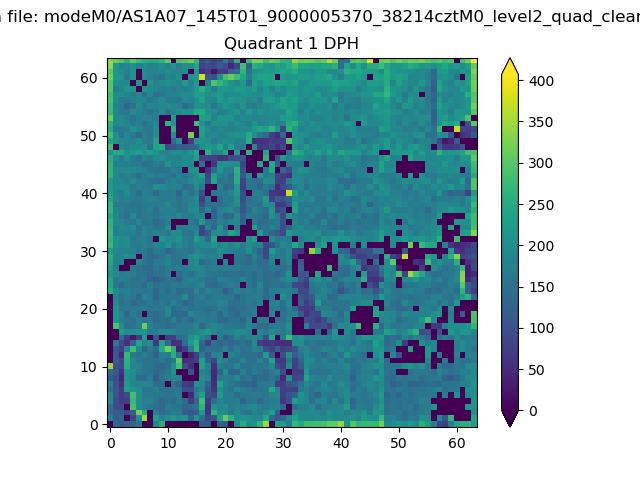 |
Quadrant B |
|---|---|---|---|
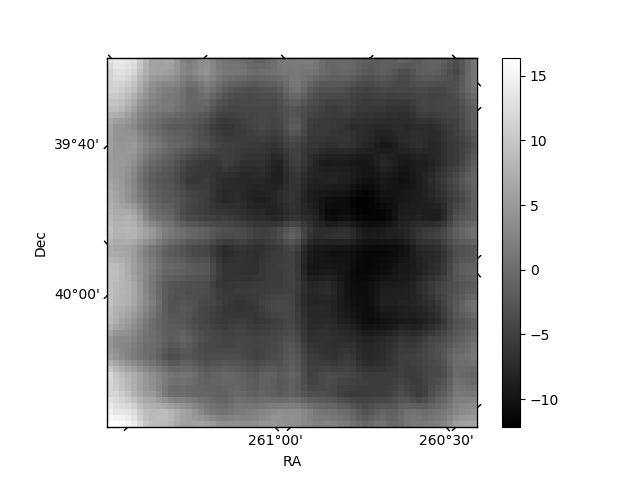
| Quadrant D | 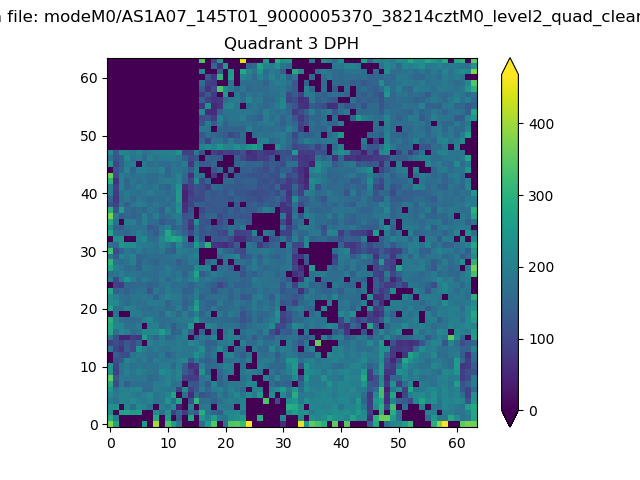 |
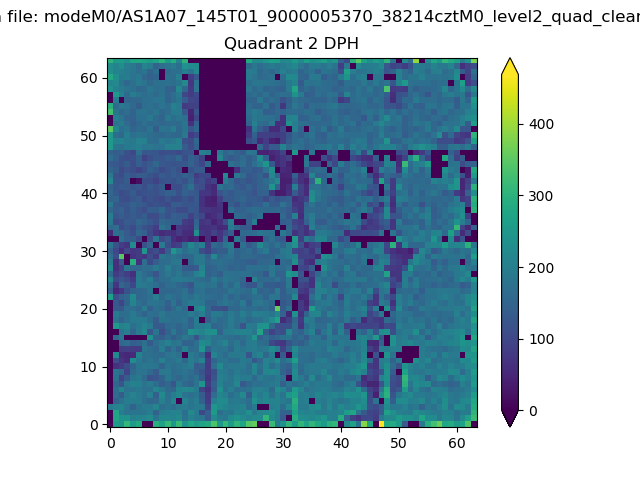 |
Quadrant C |
| Plot type | Count rate plots | Images |
|---|---|---|
| Comparison with Poisson distribution Blue bars denote a histogram of data divided into 1 sec bins. Red curve is a Poisson curve with rate = median count rate of data. |
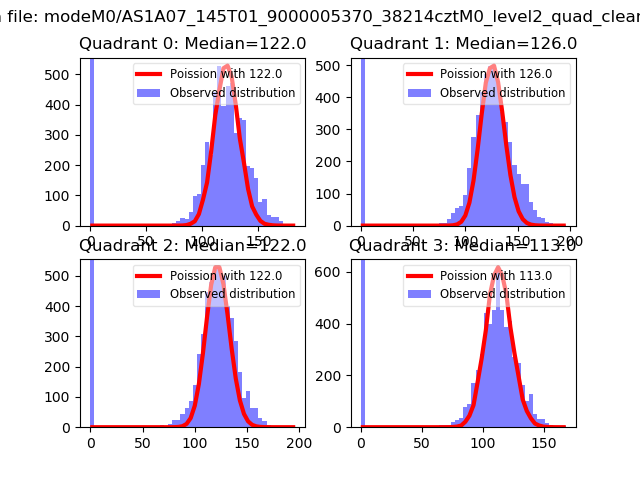 |
 |
| Quadrant-wise count rates Data is divided into 100 sec bins |
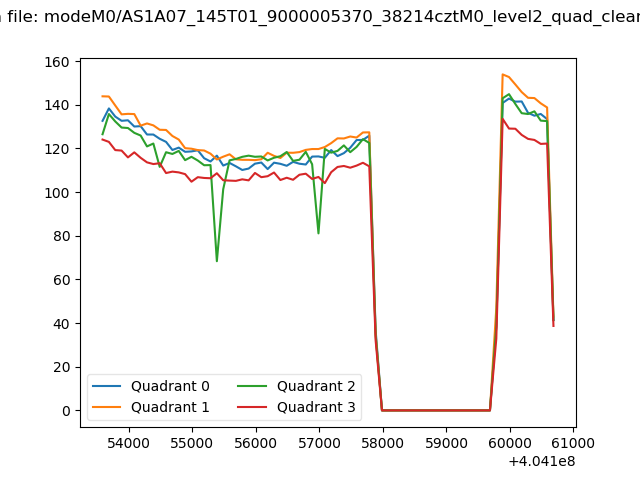 |
|
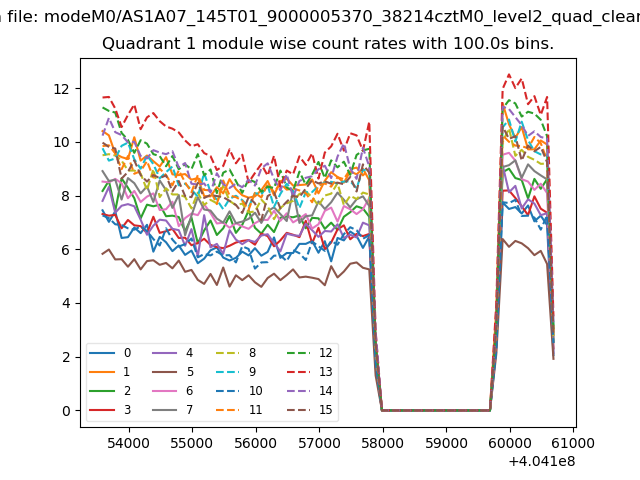
| Module-wise count rates for Quadrant A Data is divided into 100 sec bins |
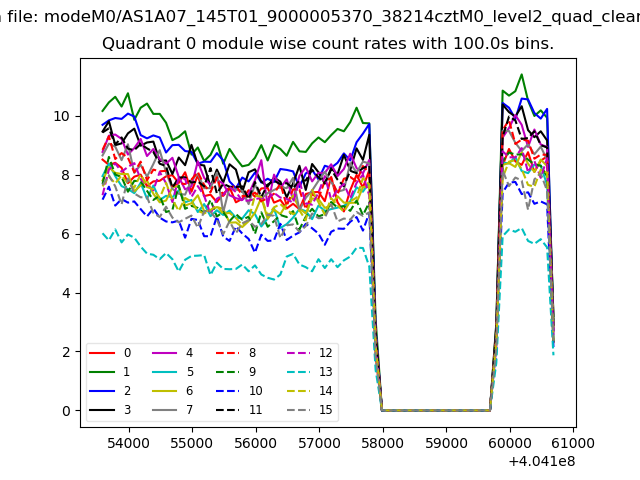 |
 |
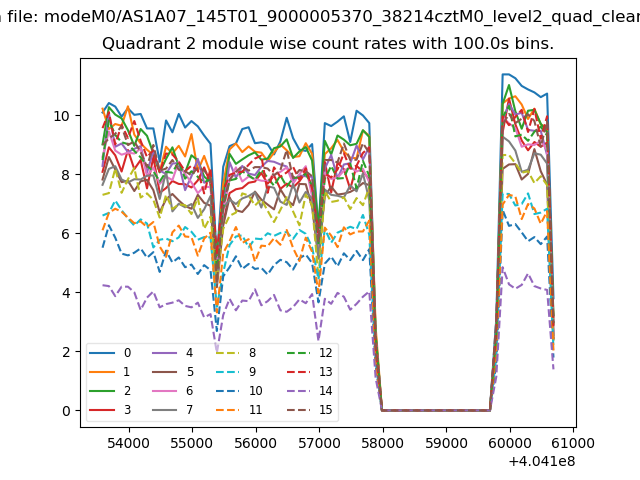
| Module-wise count rates for Quadrant B Data is divided into 100 sec bins |
 |
 |
| Module-wise count rates for Quadrant C Data is divided into 100 sec bins |
 |
 |
| Module-wise count rates for Quadrant D Data is divided into 100 sec bins |
 |
 |
| Parameter | Plot |
|---|---|
| CZT HV Monitor | 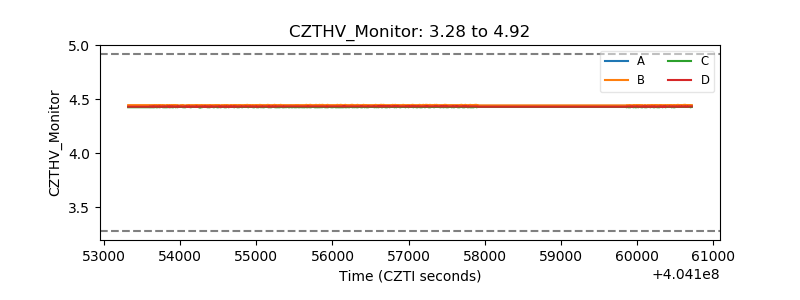 |
| D_VDD | 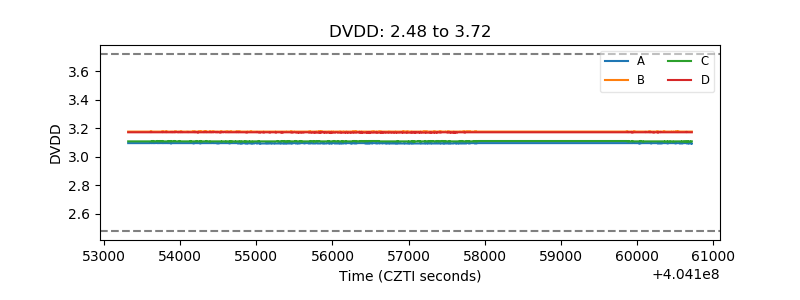 |
| Temperature 1 | 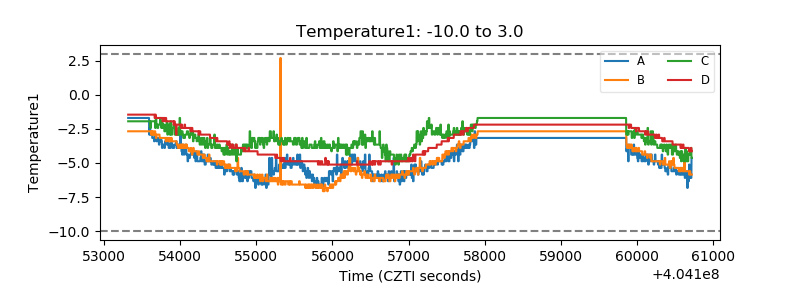 |
| Veto HV Monitor | 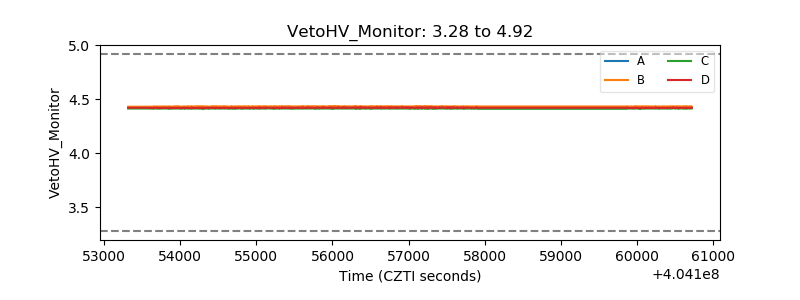 |
| Veto LLD | 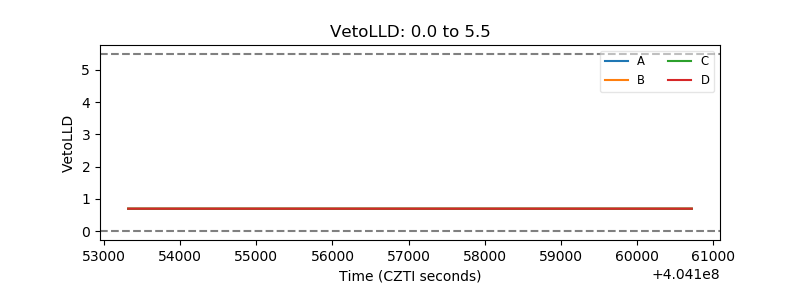 |
| Alpha Counter | 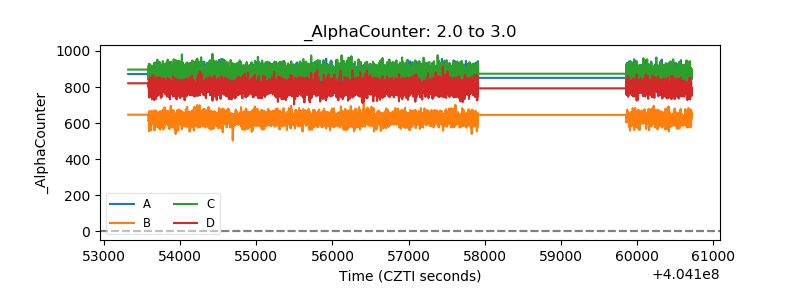 |
| _CPM_Rate | 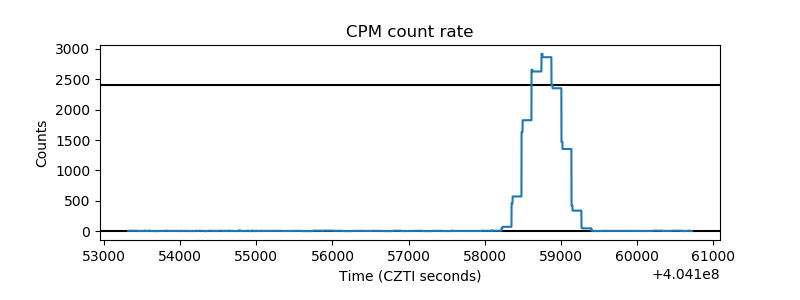 |
| CZT Counter | 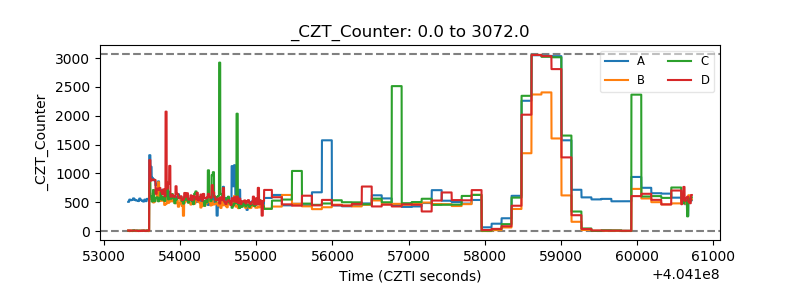 |
| +2.5 Volts monitor | 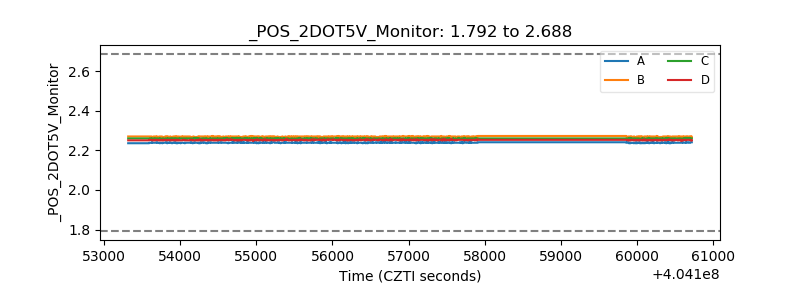 |
| +5 Volts monitor | 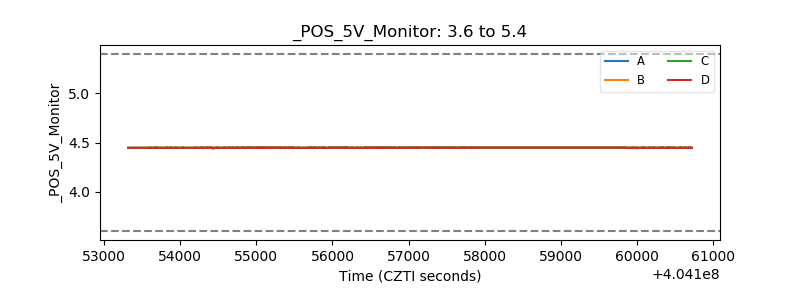 |
| _ROLL_ROT | 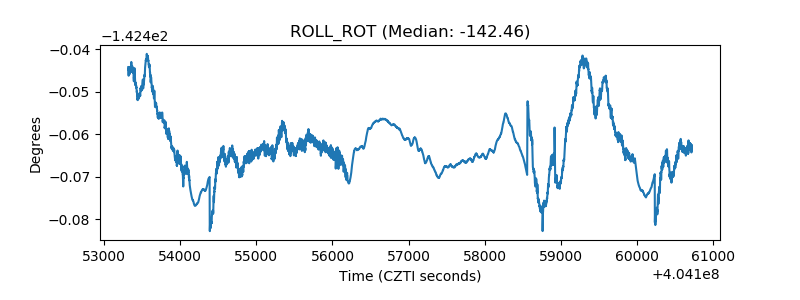 |
| _Roll_DEC | 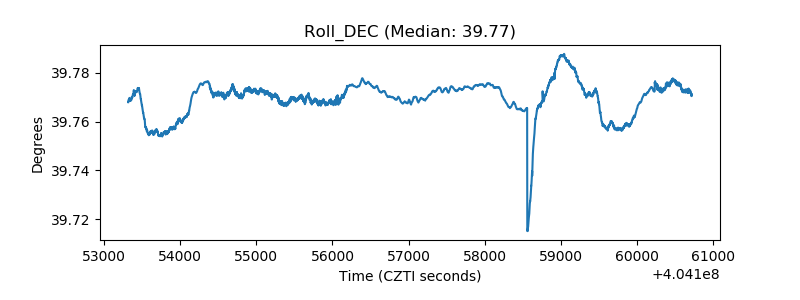 |
| _Roll_RA | 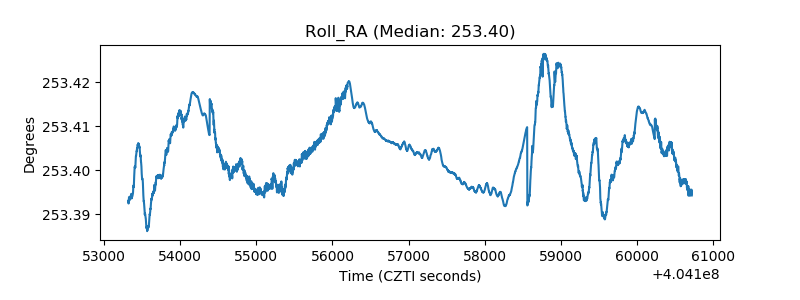 |
| Veto Counter | 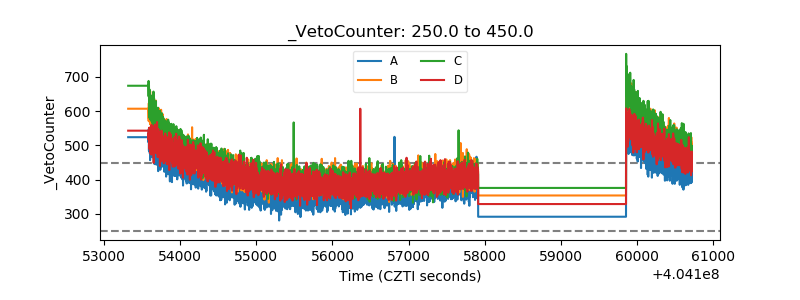 |