| Param | Original file | Final file |
|---|---|---|
| Filename | modeM0/AS1A07_145T01_9000005370_38215cztM0_level2.fits | modeM0/AS1A07_145T01_9000005370_38215cztM0_level2_quad_clean.evt |
| Size (bytes) | 307,195,200 | 94,127,040 |
| Size | 293.0 MB | 89.8 MB |
| Events in quadrant A | 2,788,221 | 628,983 |
| Events in quadrant B | 2,568,099 | 660,125 |
| Events in quadrant C | 2,738,178 | 633,133 |
| Events in quadrant D | 2,888,894 | 579,472 |
| Mode M9 | |||
|---|---|---|---|
| Quadrant | BADHDUFLAG | Total packets | Discarded packets |
| A | 0 | 24 | 0 |
| B | 0 | 24 | 0 |
| C | 0 | 24 | 0 |
| D | 0 | 25 | 0 |
| Mode SS | |||
|---|---|---|---|
| Quadrant | BADHDUFLAG | Total packets | Discarded packets |
| A | 0 | 100 | 0 |
| B | 0 | 100 | 0 |
| C | 0 | 100 | 0 |
| D | 0 | 100 | 0 |
| Mode M0 | |||
|---|---|---|---|
| Quadrant | BADHDUFLAG | Total packets | Discarded packets |
| A | 0 | 11322 | 3 |
| B | 0 | 10624 | 2 |
| C | 0 | 11019 | 2 |
| D | 0 | 11678 | 2 |
| Quadrant | Total seconds | Saturated seconds | Saturation percentage |
|---|---|---|---|
| A | 4979 | 28 | 0.562362% |
| B | 4979 | 11 | 0.220928% |
| C | 4979 | 22 | 0.441856% |
| D | 4979 | 41 | 0.823459% |
Noise dominated data is calculated using 1-second bins in cleaned event files. If a bin has >2000 counts, and if more than 50% of those come from <1% of pixels, then it is considered to be noise-dominated and hence unusable.
| Quadrant | # 1 sec bins | Bins with >0 counts | Bins with >2000 counts | High rate bins dominated by noise | Noise dominated (total time) | Noise dominated (detector-on time) | Marked lightcurve |
|---|---|---|---|---|---|---|---|
| A | 7041 | 4980 | 22 | 22 | 0.31% | 0.44% | 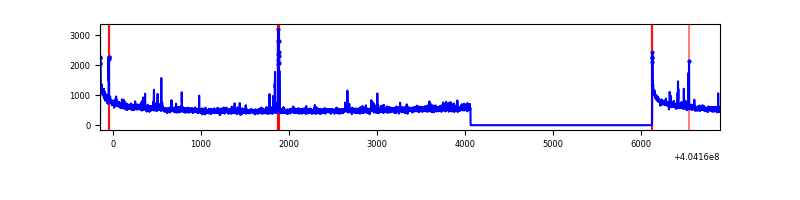 |
| B | 7041 | 4980 | 2 | 2 | 0.03% | 0.04% | 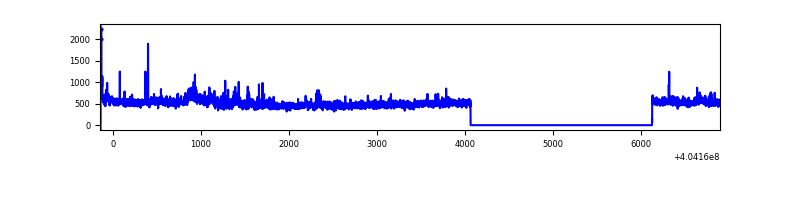 |
| C | 7041 | 4980 | 16 | 16 | 0.23% | 0.32% | 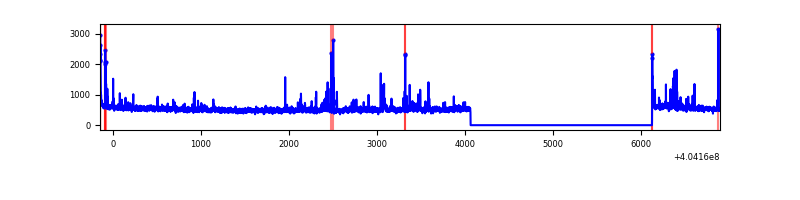 |
| D | 7041 | 4980 | 37 | 37 | 0.53% | 0.74% | 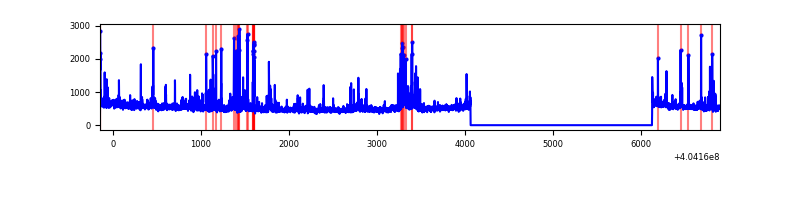 |
Top three noisy pixels from each quadrant. If the there are fewer than three noisy pixels in the level2.evt file, extra rows are filled as -1
| Pixel properties | Quadrant properties | ||||||
|---|---|---|---|---|---|---|---|
| Quadrant | DetID | PixID | Counts | Sigma | Mean | Median | Sigma |
| A | 10 | 83 | 361707 | 3012.97 | 591 | 580 | 119.9 |
| A | 13 | 248 | 66668 | 551.39 | 591 | 580 | 119.9 |
| A | 12 | 189 | 27334 | 223.22 | 591 | 580 | 119.9 |
| B | 0 | 183 | 147821 | 1302.72 | 598 | 583 | 113.0 |
| B | 0 | 218 | 19262 | 165.27 | 598 | 583 | 113.0 |
| B | 12 | 111 | 13841 | 117.3 | 598 | 583 | 113.0 |
| C | 15 | 214 | 210908 | 1543.04 | 590 | 597 | 136.3 |
| C | 9 | 236 | 76110 | 554.03 | 590 | 597 | 136.3 |
| C | 14 | 254 | 75846 | 552.1 | 590 | 597 | 136.3 |
| D | 10 | 203 | 166664 | 1162.14 | 586 | 572 | 142.9 |
| D | 13 | 138 | 120093 | 836.28 | 586 | 572 | 142.9 |
| D | 13 | 249 | 63774 | 442.22 | 586 | 572 | 142.9 |
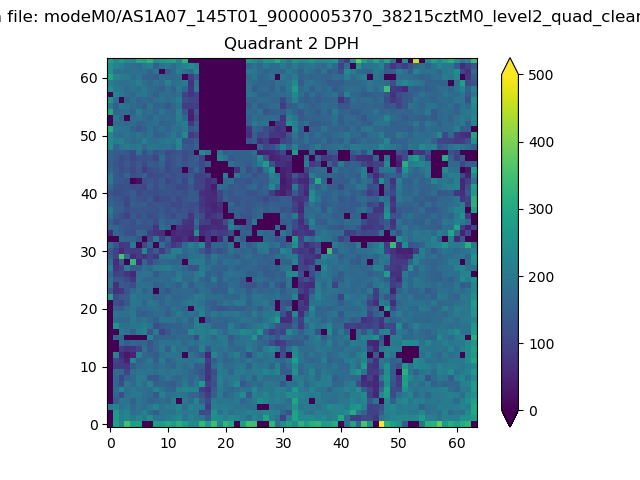
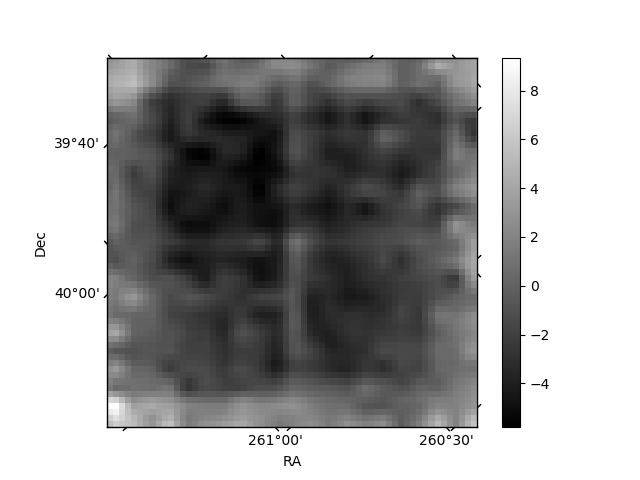
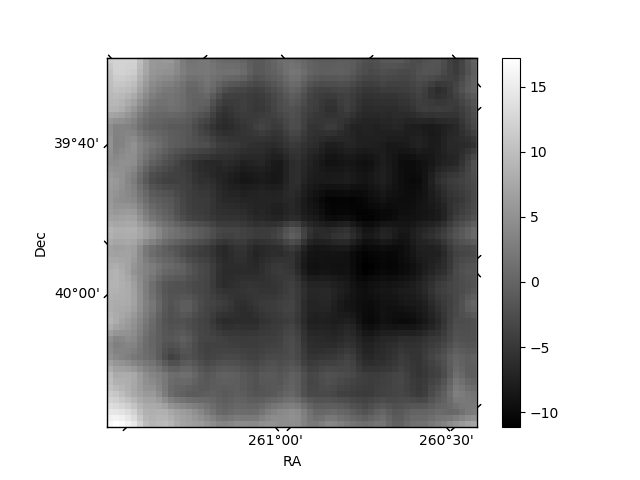
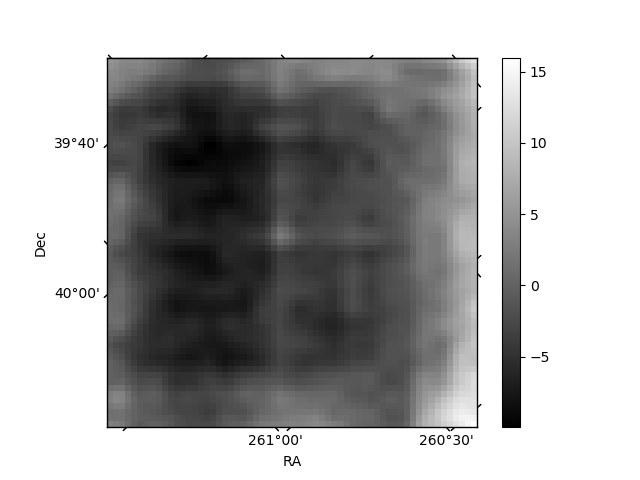
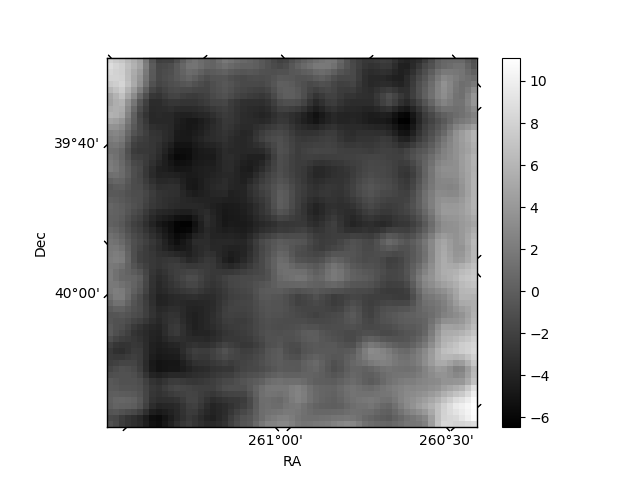
Histogram calculated using DETX and DETY for each event in the final _common_clean file
| Quadrant A | 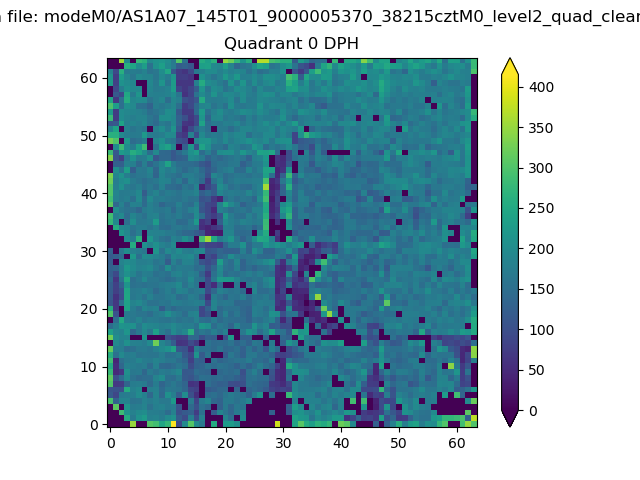 |
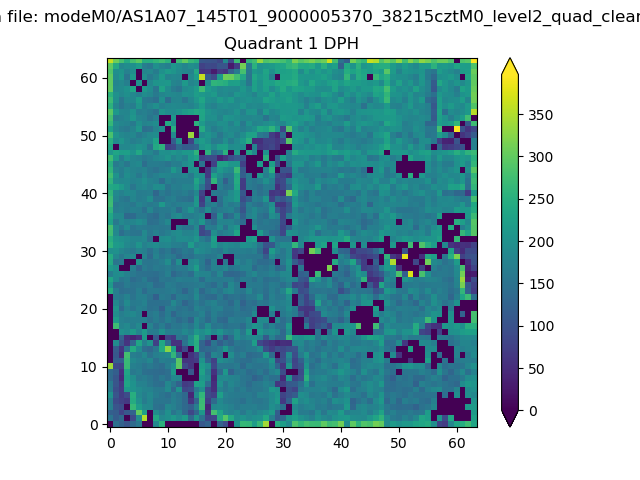 |
Quadrant B |
|---|---|---|---|
| Quadrant D | 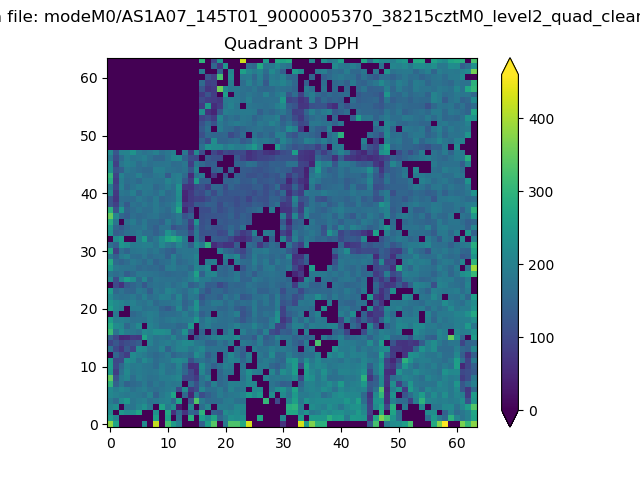 |
 |
Quadrant C |
| Plot type | Count rate plots | Images |
|---|---|---|
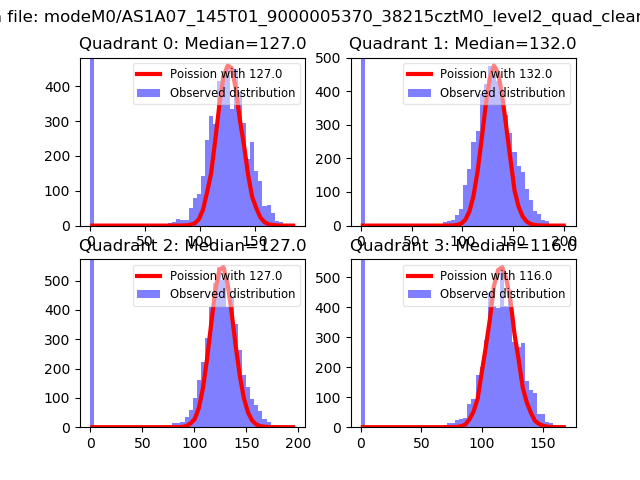
| Comparison with Poisson distribution Blue bars denote a histogram of data divided into 1 sec bins. Red curve is a Poisson curve with rate = median count rate of data. |
 |
 |
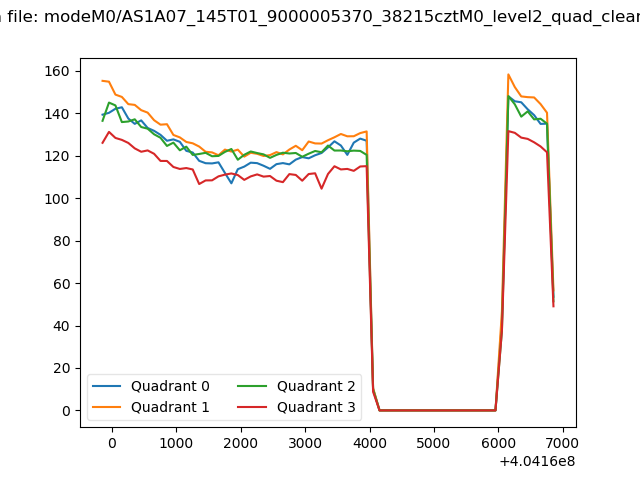
| Quadrant-wise count rates Data is divided into 100 sec bins |
 |
|
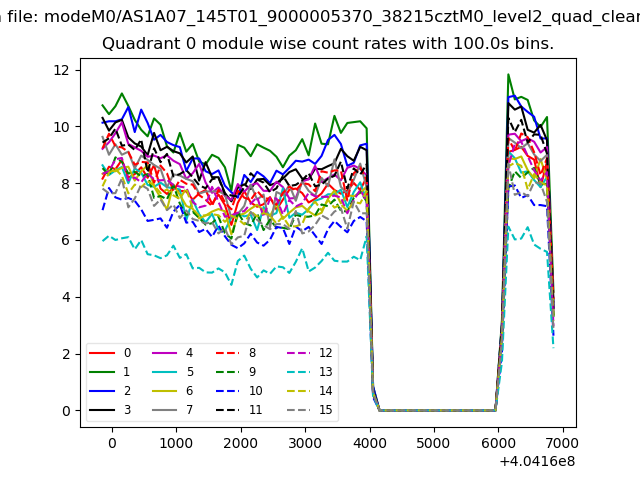
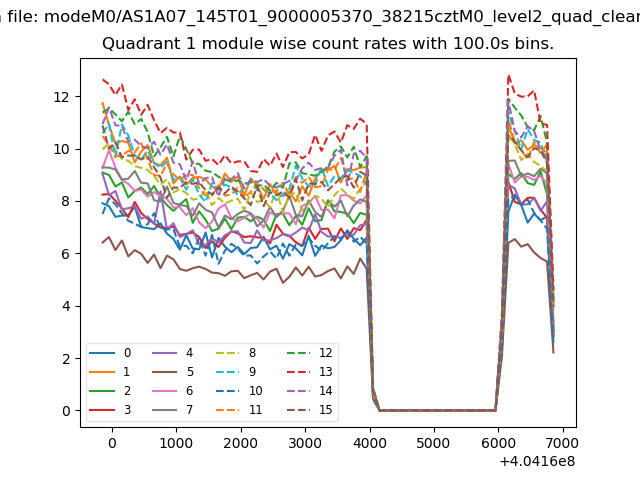
| Module-wise count rates for Quadrant A Data is divided into 100 sec bins |
 |
 |
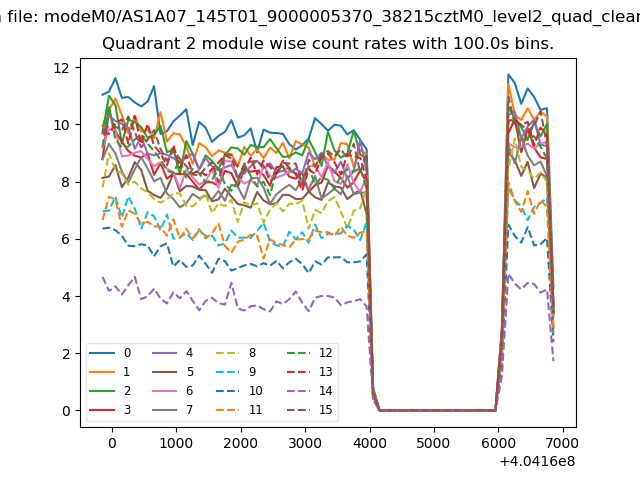
| Module-wise count rates for Quadrant B Data is divided into 100 sec bins |
 |
 |
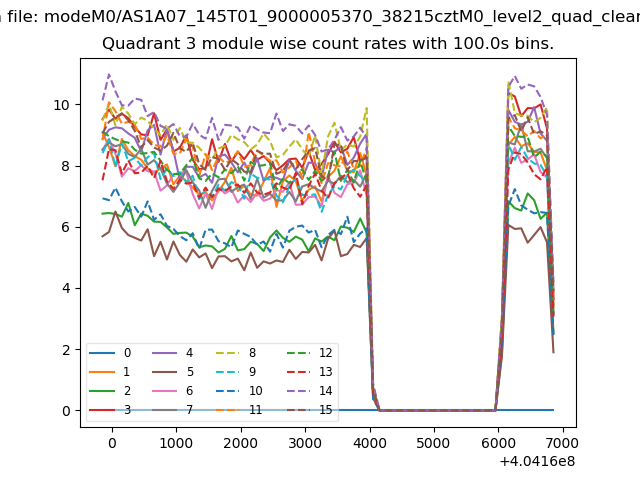
| Module-wise count rates for Quadrant C Data is divided into 100 sec bins |
 |
 |
| Module-wise count rates for Quadrant D Data is divided into 100 sec bins |
 |
 |
| Parameter | Plot |
|---|---|
| CZT HV Monitor | 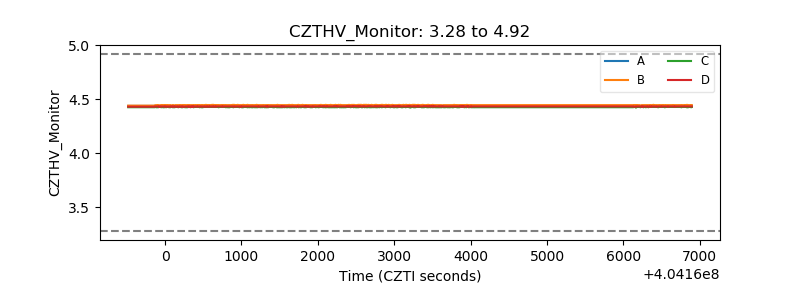 |
| D_VDD | 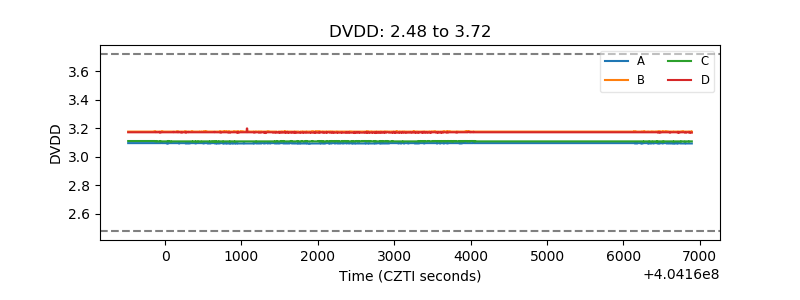 |
| Temperature 1 | 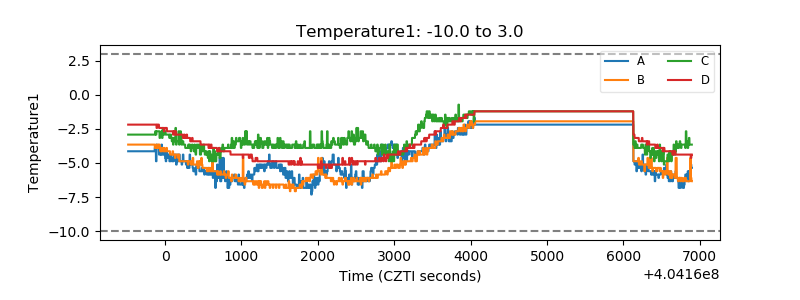 |
| Veto HV Monitor | 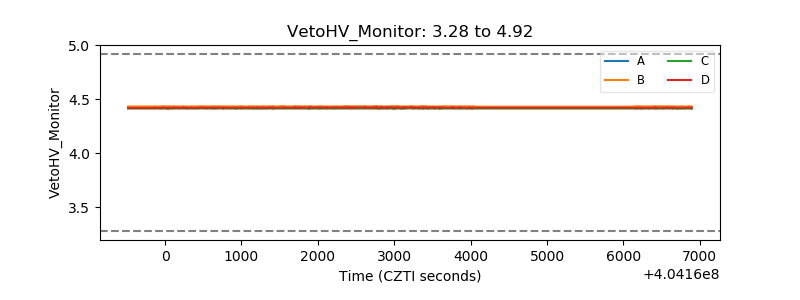 |
| Veto LLD | 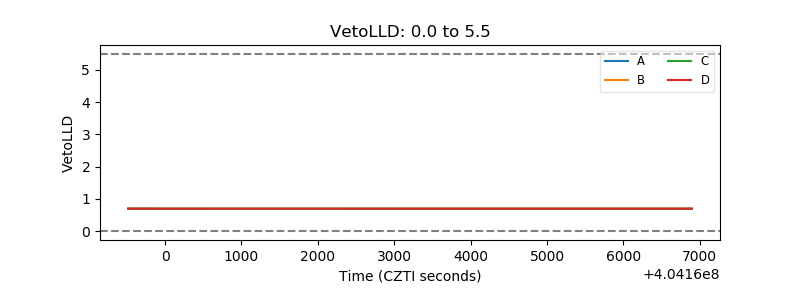 |
| Alpha Counter | 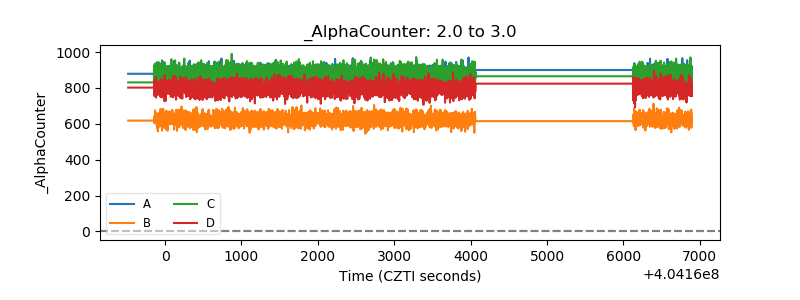 |
| _CPM_Rate |  |
| CZT Counter | 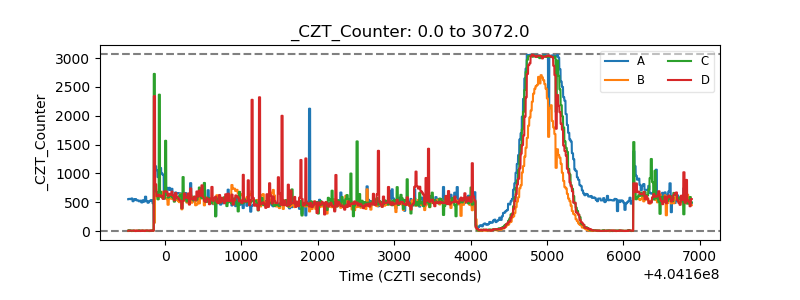 |
| +2.5 Volts monitor | 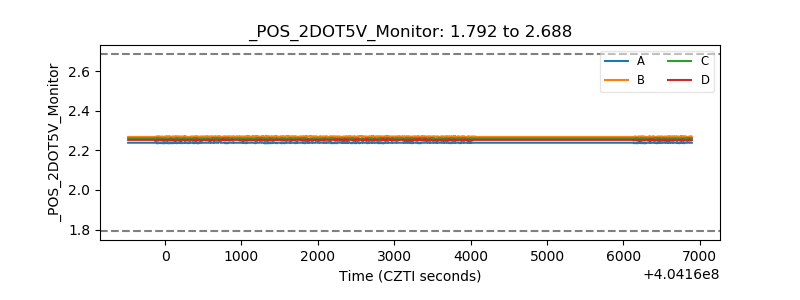 |
| +5 Volts monitor | 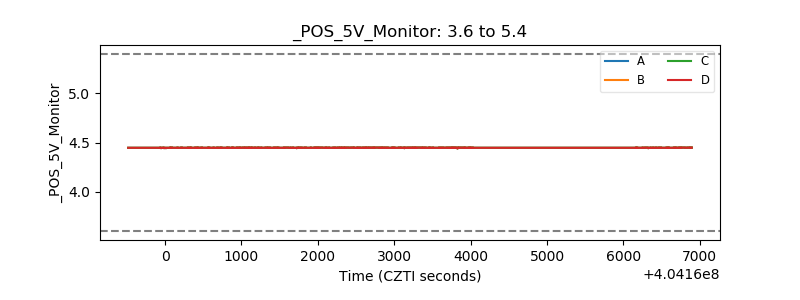 |
| _ROLL_ROT | 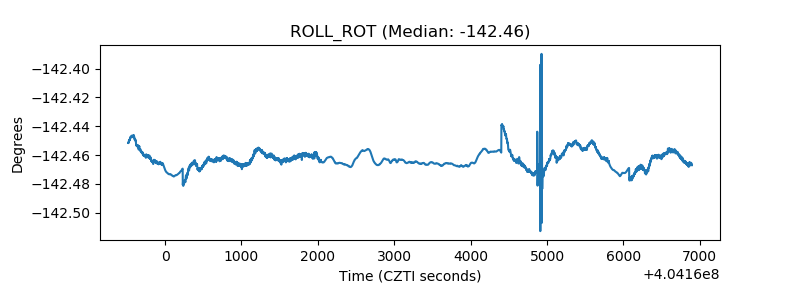 |
| _Roll_DEC | 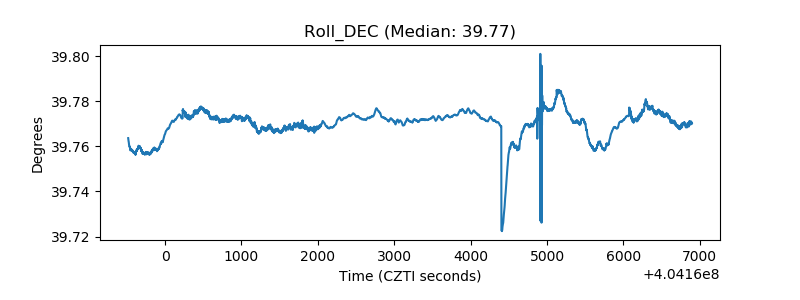 |
| _Roll_RA | 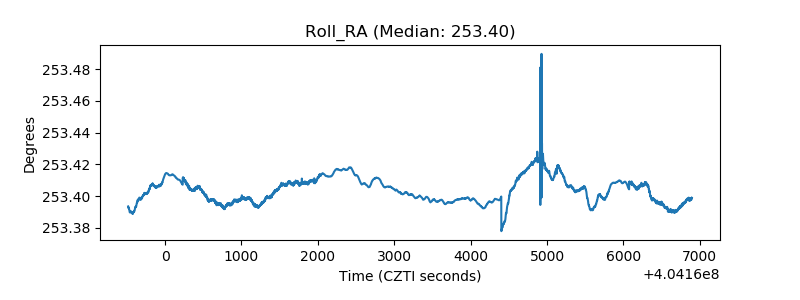 |
| Veto Counter | 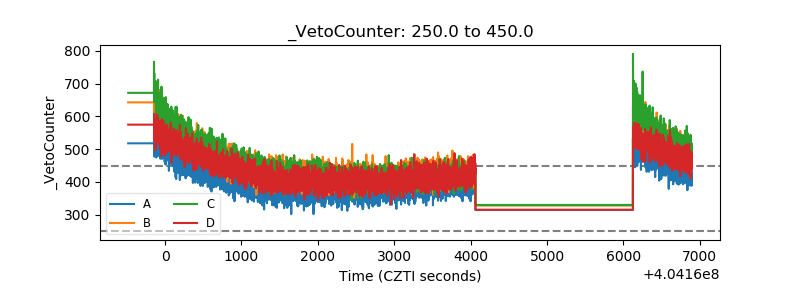 |