| Param | Original file | Final file |
|---|---|---|
| Filename | modeM0/AS1A07_145T01_9000005370_38216cztM0_level2.fits | modeM0/AS1A07_145T01_9000005370_38216cztM0_level2_quad_clean.evt |
| Size (bytes) | 335,105,280 | 97,971,840 |
| Size | 319.6 MB | 93.4 MB |
| Events in quadrant A | 2,869,424 | 661,711 |
| Events in quadrant B | 2,628,109 | 692,581 |
| Events in quadrant C | 3,236,745 | 651,836 |
| Events in quadrant D | 3,262,491 | 594,428 |
| Mode M9 | |||
|---|---|---|---|
| Quadrant | BADHDUFLAG | Total packets | Discarded packets |
| A | 0 | 35 | 0 |
| B | 0 | 35 | 0 |
| C | 0 | 35 | 0 |
| D | 0 | 36 | 0 |
| Mode SS | |||
|---|---|---|---|
| Quadrant | BADHDUFLAG | Total packets | Discarded packets |
| A | 0 | 106 | 0 |
| B | 0 | 106 | 0 |
| C | 0 | 106 | 0 |
| D | 0 | 106 | 0 |
| Mode M0 | |||
|---|---|---|---|
| Quadrant | BADHDUFLAG | Total packets | Discarded packets |
| A | 0 | 11621 | 3 |
| B | 0 | 10919 | 2 |
| C | 0 | 12684 | 2 |
| D | 0 | 13153 | 2 |
| Quadrant | Total seconds | Saturated seconds | Saturation percentage |
|---|---|---|---|
| A | 5234 | 18 | 0.343905% |
| B | 5234 | 18 | 0.343905% |
| C | 5234 | 136 | 2.598395% |
| D | 5234 | 172 | 3.286206% |
Noise dominated data is calculated using 1-second bins in cleaned event files. If a bin has >2000 counts, and if more than 50% of those come from <1% of pixels, then it is considered to be noise-dominated and hence unusable.
| Quadrant | # 1 sec bins | Bins with >0 counts | Bins with >2000 counts | High rate bins dominated by noise | Noise dominated (total time) | Noise dominated (detector-on time) | Marked lightcurve |
|---|---|---|---|---|---|---|---|
| A | 7357 | 5235 | 12 | 12 | 0.16% | 0.23% | 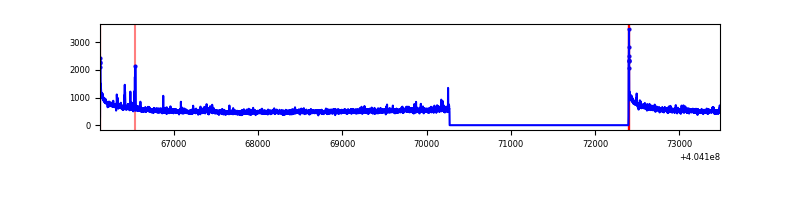 |
| B | 7357 | 5235 | 9 | 9 | 0.12% | 0.17% | 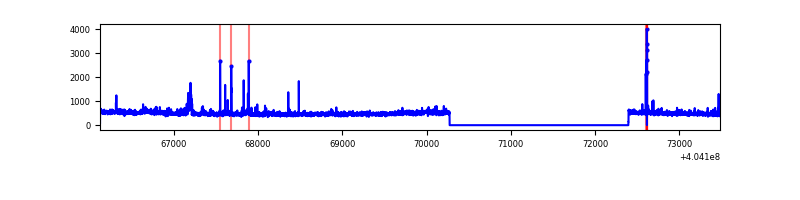 |
| C | 7357 | 5235 | 106 | 106 | 1.44% | 2.02% | 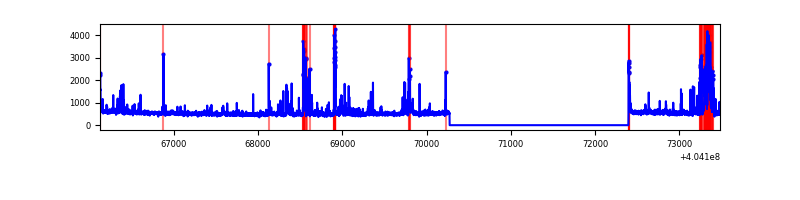 |
| D | 7357 | 5235 | 148 | 148 | 2.01% | 2.83% | 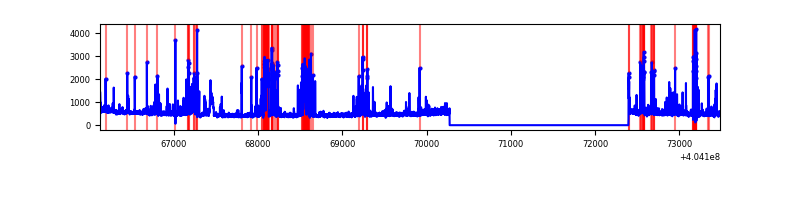 |
Top three noisy pixels from each quadrant. If the there are fewer than three noisy pixels in the level2.evt file, extra rows are filled as -1
| Pixel properties | Quadrant properties | ||||||
|---|---|---|---|---|---|---|---|
| Quadrant | DetID | PixID | Counts | Sigma | Mean | Median | Sigma |
| A | 10 | 83 | 367308 | 2940.03 | 620 | 609 | 124.7 |
| A | 12 | 189 | 45506 | 359.96 | 620 | 609 | 124.7 |
| A | 13 | 248 | 15771 | 121.56 | 620 | 609 | 124.7 |
| B | 0 | 183 | 47255 | 397.96 | 625 | 610 | 117.2 |
| B | 5 | 172 | 44954 | 378.33 | 625 | 610 | 117.2 |
| B | 0 | 229 | 42025 | 353.34 | 625 | 610 | 117.2 |
| C | 14 | 254 | 301456 | 2132.99 | 609 | 614 | 141.0 |
| C | 9 | 236 | 238548 | 1686.97 | 609 | 614 | 141.0 |
| C | 15 | 214 | 216140 | 1528.09 | 609 | 614 | 141.0 |
| D | 13 | 138 | 432365 | 2910.04 | 605 | 589 | 148.4 |
| D | 13 | 249 | 103954 | 696.65 | 605 | 589 | 148.4 |
| D | 10 | 118 | 100904 | 676.09 | 605 | 589 | 148.4 |
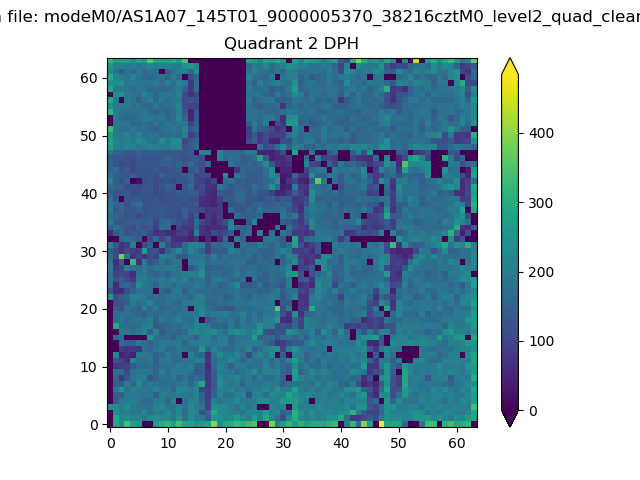
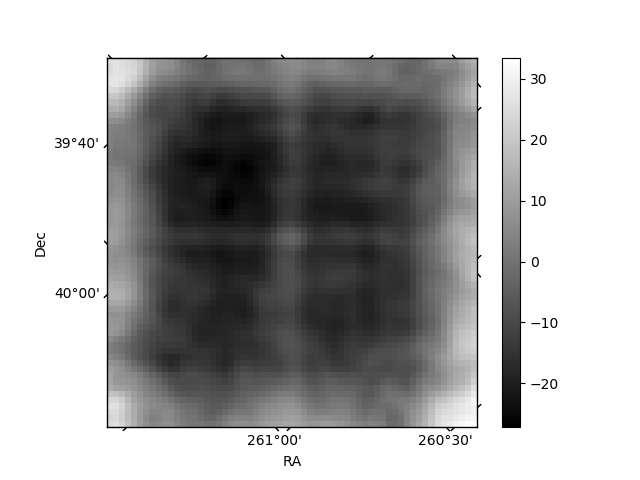
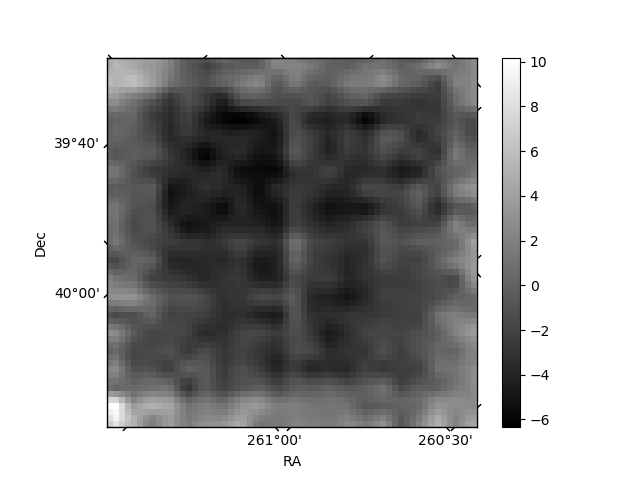
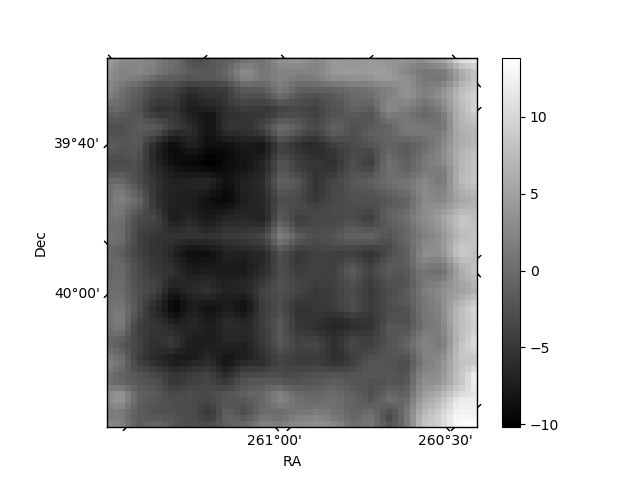
Histogram calculated using DETX and DETY for each event in the final _common_clean file
| Quadrant A | 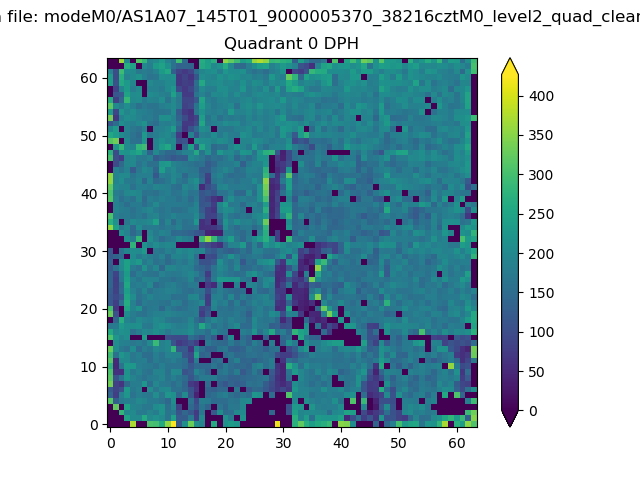 |
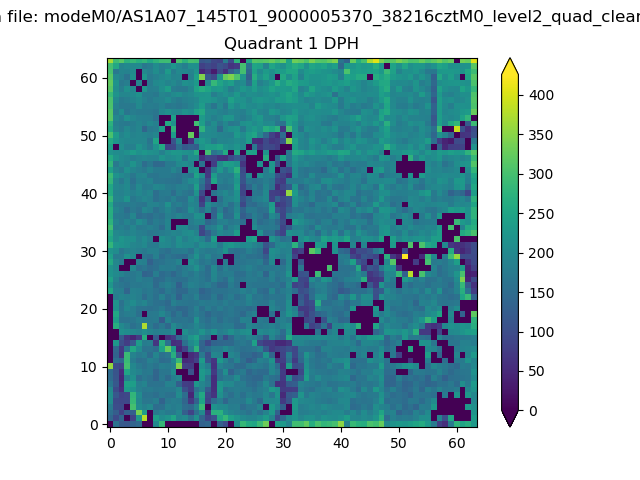 |
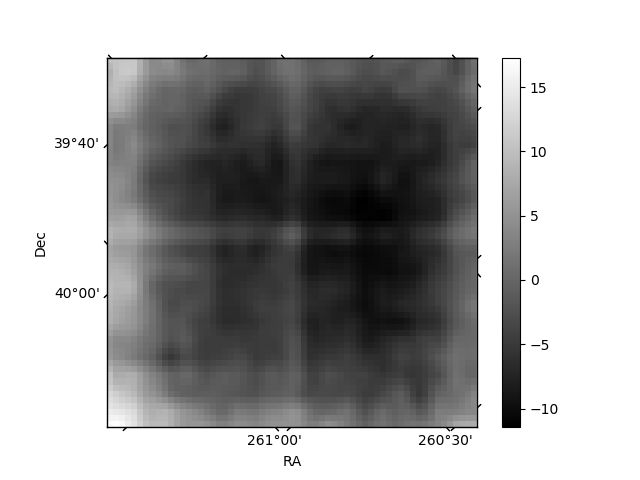
Quadrant B |
|---|---|---|---|
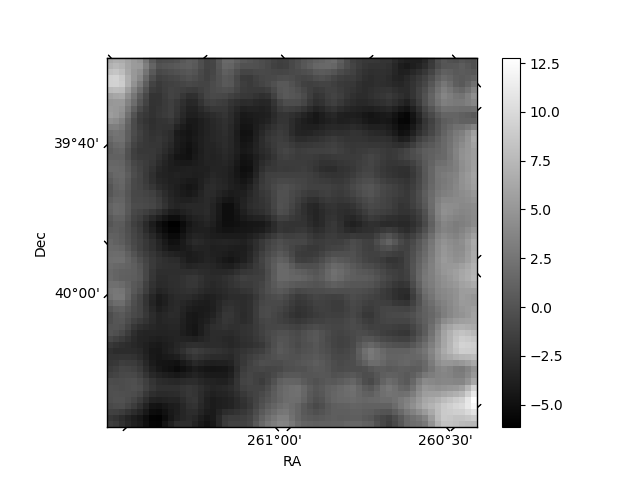
| Quadrant D | 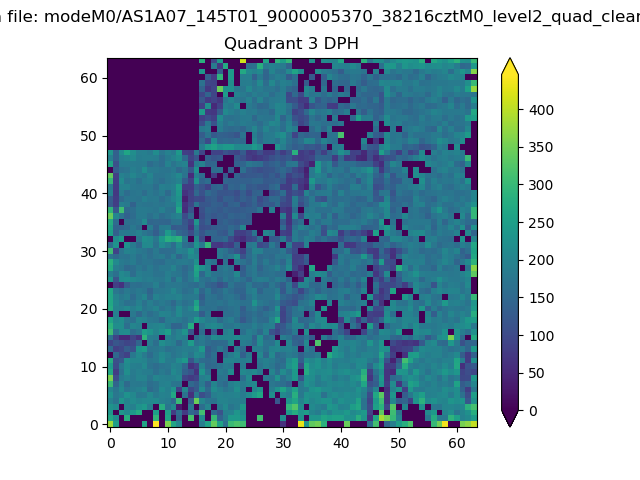 |
 |
Quadrant C |
| Plot type | Count rate plots | Images |
|---|---|---|
| Comparison with Poisson distribution Blue bars denote a histogram of data divided into 1 sec bins. Red curve is a Poisson curve with rate = median count rate of data. |
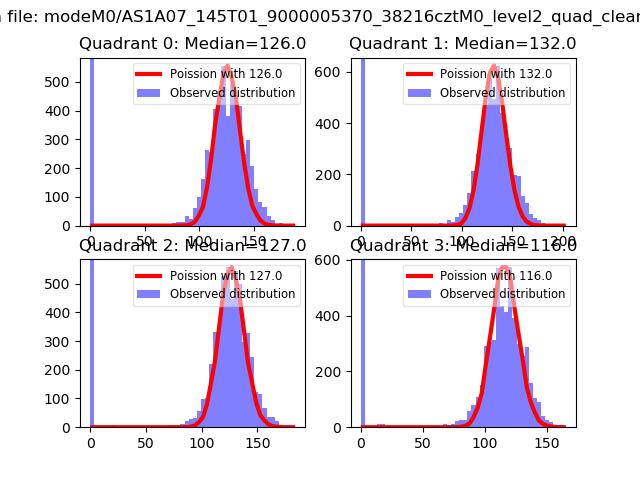 |
 |
| Quadrant-wise count rates Data is divided into 100 sec bins |
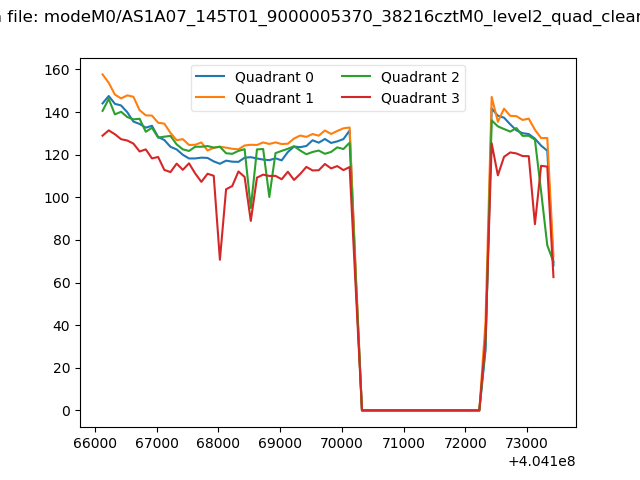 |
|
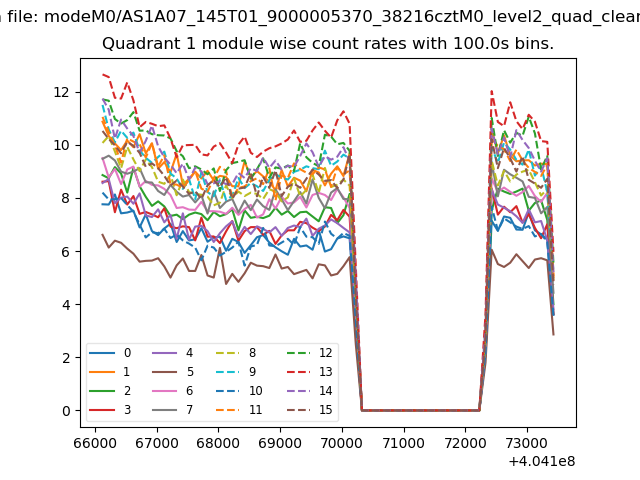
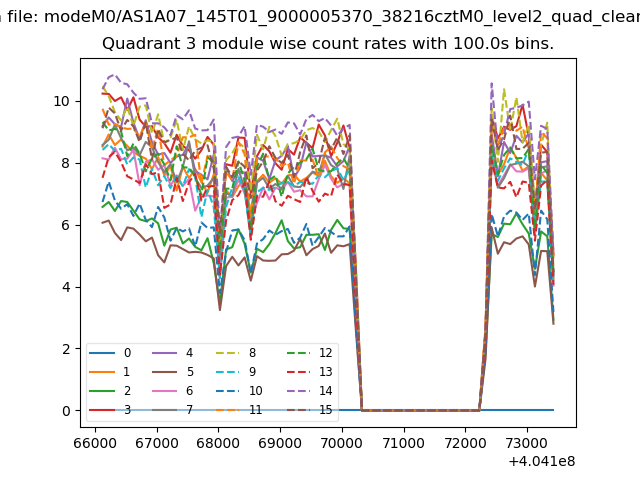
| Module-wise count rates for Quadrant A Data is divided into 100 sec bins |
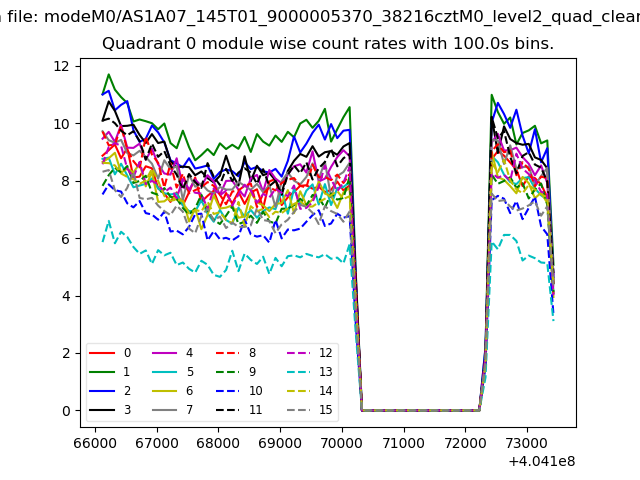 |
 |
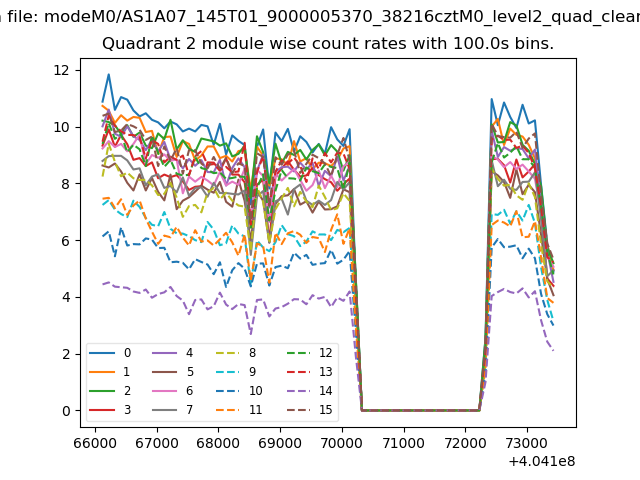
| Module-wise count rates for Quadrant B Data is divided into 100 sec bins |
 |
 |
| Module-wise count rates for Quadrant C Data is divided into 100 sec bins |
 |
 |
| Module-wise count rates for Quadrant D Data is divided into 100 sec bins |
 |
 |
| Parameter | Plot |
|---|---|
| CZT HV Monitor | 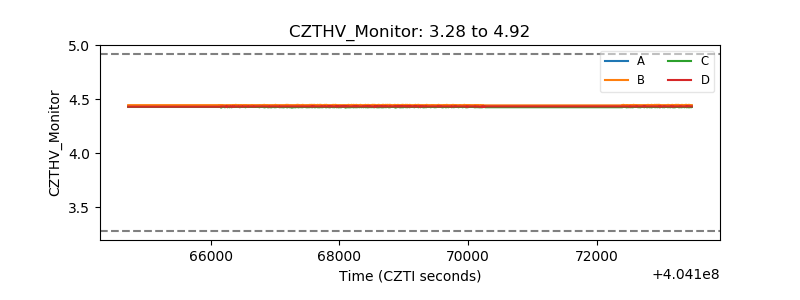 |
| D_VDD | 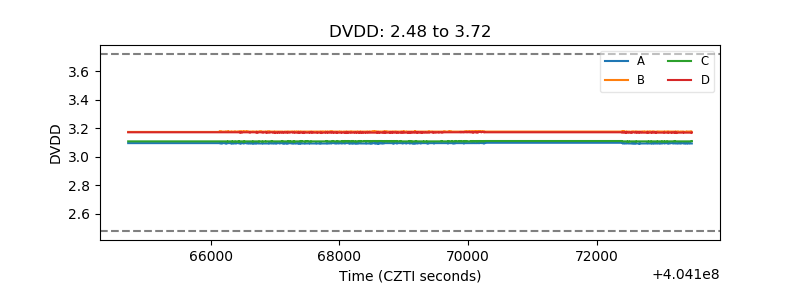 |
| Temperature 1 | 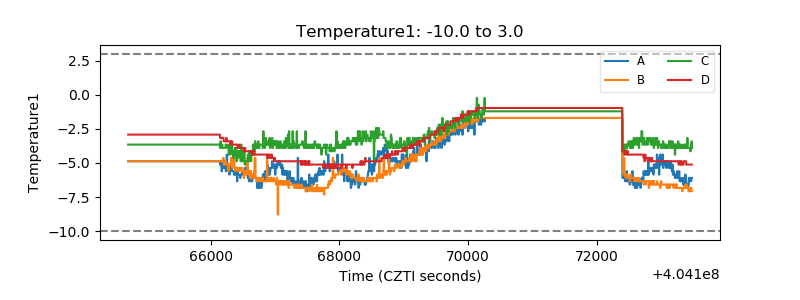 |
| Veto HV Monitor | 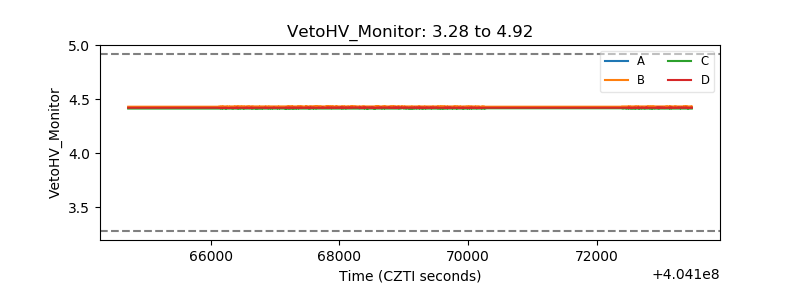 |
| Veto LLD | 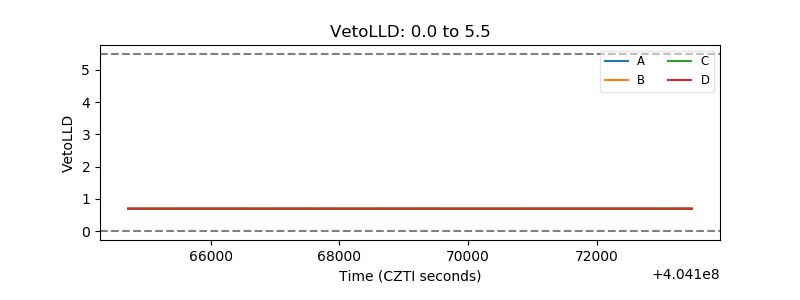 |
| Alpha Counter | 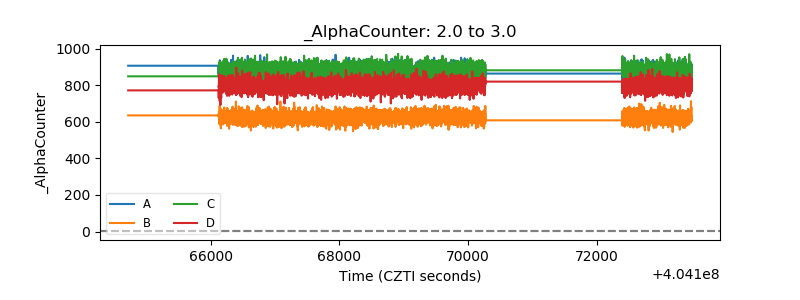 |
| _CPM_Rate | 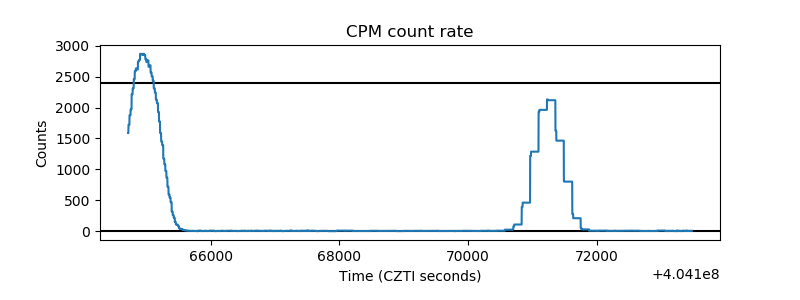 |
| CZT Counter | 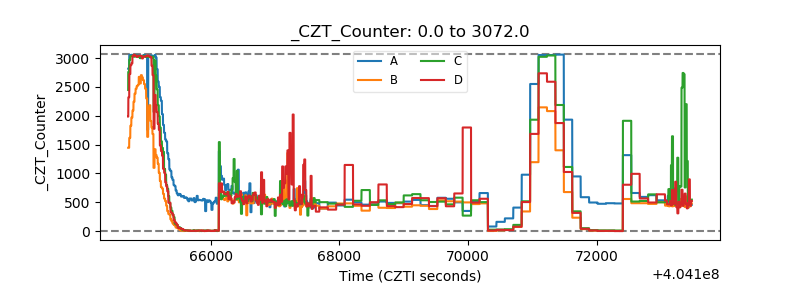 |
| +2.5 Volts monitor | 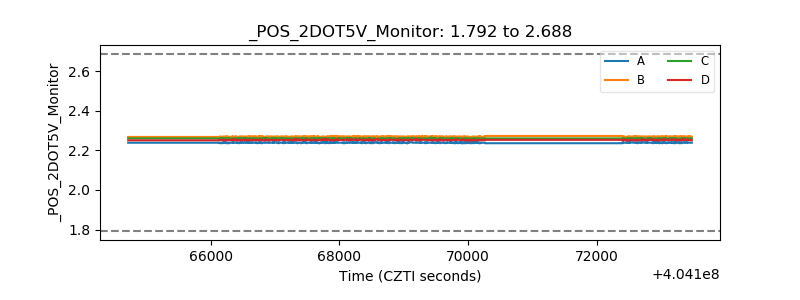 |
| +5 Volts monitor | 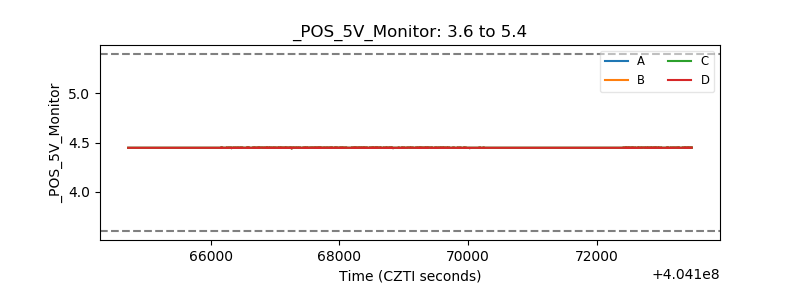 |
| _ROLL_ROT | 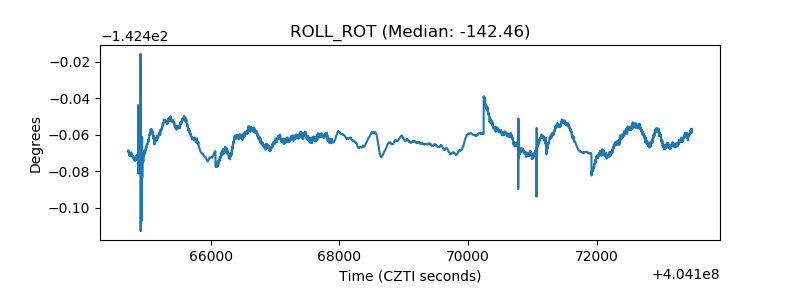 |
| _Roll_DEC | 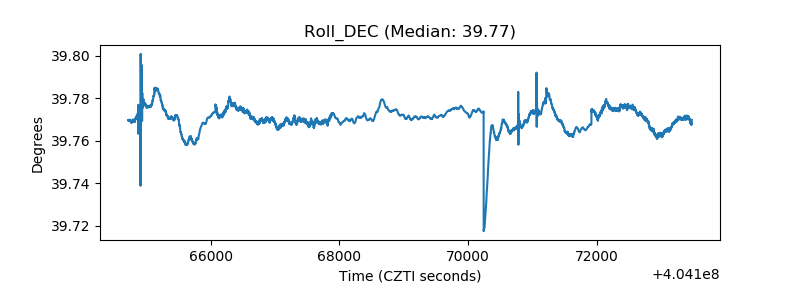 |
| _Roll_RA | 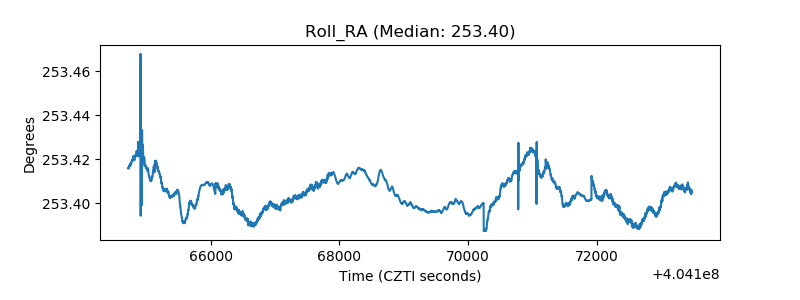 |
| Veto Counter | 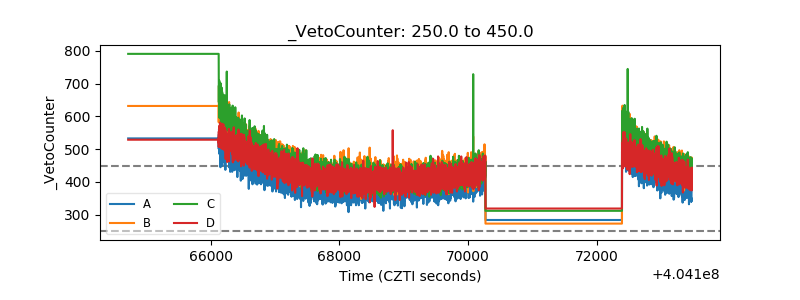 |