| Param | Original file | Final file |
|---|---|---|
| Filename | modeM0/AS1A07_145T01_9000005370_38217cztM0_level2.fits | modeM0/AS1A07_145T01_9000005370_38217cztM0_level2_quad_clean.evt |
| Size (bytes) | 326,793,600 | 93,510,720 |
| Size | 311.7 MB | 89.2 MB |
| Events in quadrant A | 2,773,075 | 630,858 |
| Events in quadrant B | 2,489,276 | 654,896 |
| Events in quadrant C | 3,070,619 | 621,092 |
| Events in quadrant D | 3,365,402 | 565,970 |
| Mode M9 | |||
|---|---|---|---|
| Quadrant | BADHDUFLAG | Total packets | Discarded packets |
| A | 0 | 35 | 0 |
| B | 0 | 35 | 0 |
| C | 0 | 35 | 0 |
| D | 0 | 36 | 0 |
| Mode SS | |||
|---|---|---|---|
| Quadrant | BADHDUFLAG | Total packets | Discarded packets |
| A | 0 | 106 | 0 |
| B | 0 | 106 | 0 |
| C | 0 | 106 | 0 |
| D | 0 | 106 | 0 |
| Mode M0 | |||
|---|---|---|---|
| Quadrant | BADHDUFLAG | Total packets | Discarded packets |
| A | 0 | 11257 | 3 |
| B | 0 | 10590 | 2 |
| C | 0 | 12189 | 2 |
| D | 0 | 13450 | 2 |
| Quadrant | Total seconds | Saturated seconds | Saturation percentage |
|---|---|---|---|
| A | 5115 | 22 | 0.430108% |
| B | 5115 | 19 | 0.371457% |
| C | 5115 | 104 | 2.033236% |
| D | 5115 | 175 | 3.421310% |
Noise dominated data is calculated using 1-second bins in cleaned event files. If a bin has >2000 counts, and if more than 50% of those come from <1% of pixels, then it is considered to be noise-dominated and hence unusable.
| Quadrant | # 1 sec bins | Bins with >0 counts | Bins with >2000 counts | High rate bins dominated by noise | Noise dominated (total time) | Noise dominated (detector-on time) | Marked lightcurve |
|---|---|---|---|---|---|---|---|
| A | 7237 | 5116 | 18 | 18 | 0.25% | 0.35% | 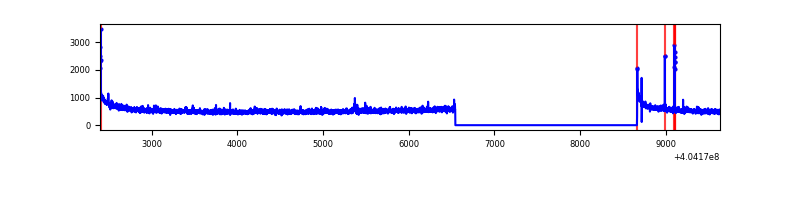 |
| B | 7237 | 5116 | 10 | 10 | 0.14% | 0.20% | 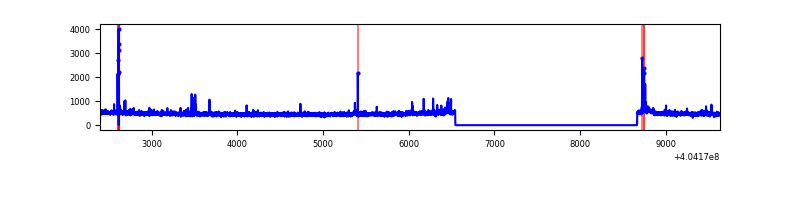 |
| C | 7237 | 5116 | 87 | 87 | 1.20% | 1.70% | 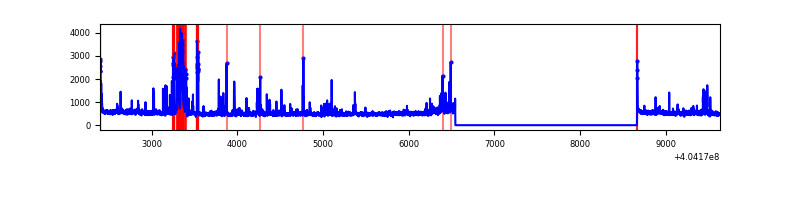 |
| D | 7237 | 5116 | 139 | 139 | 1.92% | 2.72% | 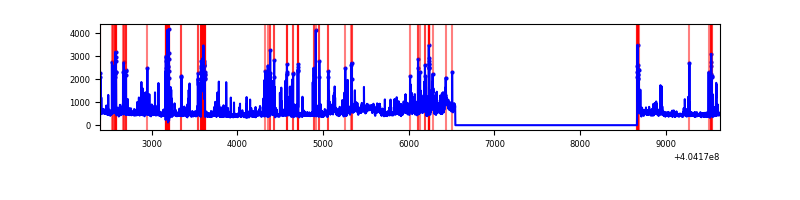 |
Top three noisy pixels from each quadrant. If the there are fewer than three noisy pixels in the level2.evt file, extra rows are filled as -1
| Pixel properties | Quadrant properties | ||||||
|---|---|---|---|---|---|---|---|
| Quadrant | DetID | PixID | Counts | Sigma | Mean | Median | Sigma |
| A | 10 | 83 | 351946 | 2916.67 | 598 | 587 | 120.5 |
| A | 12 | 189 | 46053 | 377.42 | 598 | 587 | 120.5 |
| A | 7 | 16 | 21522 | 173.78 | 598 | 587 | 120.5 |
| B | 5 | 172 | 38074 | 327.26 | 600 | 585 | 114.6 |
| B | 0 | 183 | 26244 | 223.99 | 600 | 585 | 114.6 |
| B | 0 | 230 | 18338 | 154.97 | 600 | 585 | 114.6 |
| C | 14 | 254 | 368026 | 2718.69 | 584 | 590 | 135.2 |
| C | 15 | 214 | 211133 | 1557.82 | 584 | 590 | 135.2 |
| C | 5 | 250 | 69595 | 510.57 | 584 | 590 | 135.2 |
| D | 13 | 171 | 253068 | 1790.07 | 577 | 561 | 141.1 |
| D | 13 | 138 | 252916 | 1788.99 | 577 | 561 | 141.1 |
| D | 2 | 16 | 225361 | 1593.65 | 577 | 561 | 141.1 |
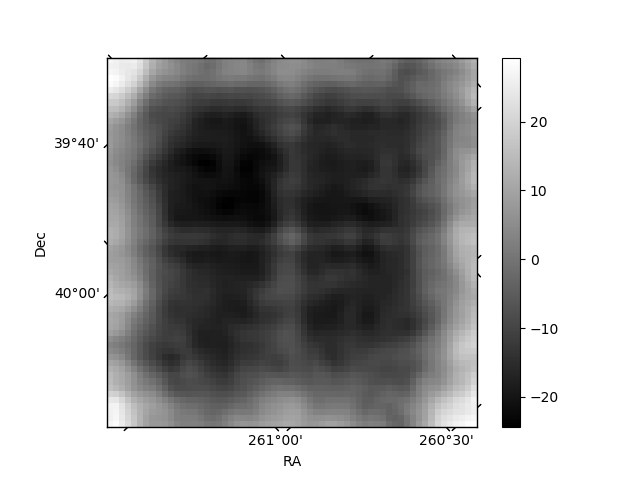
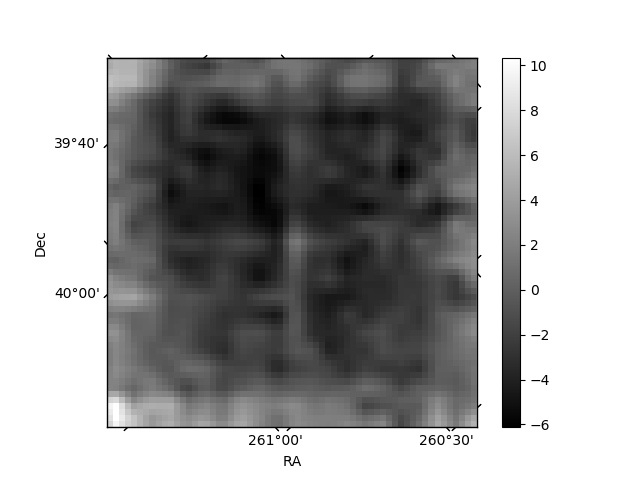
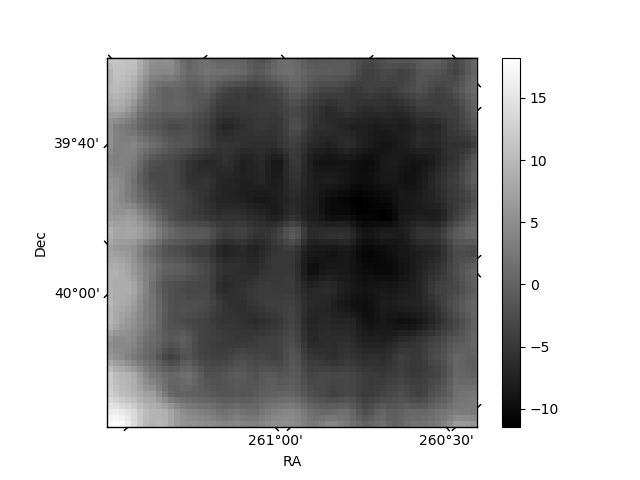
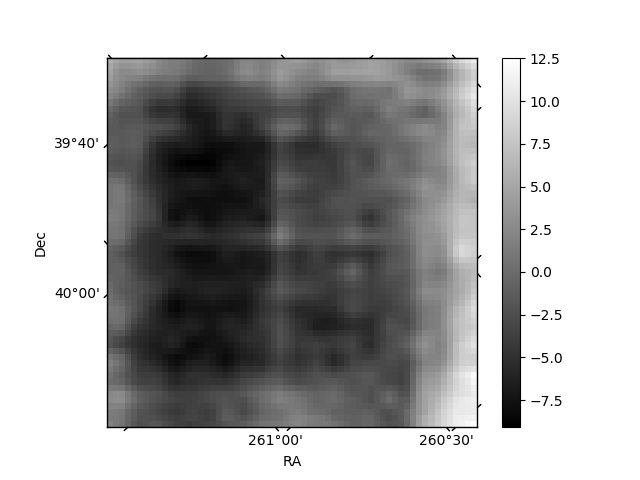
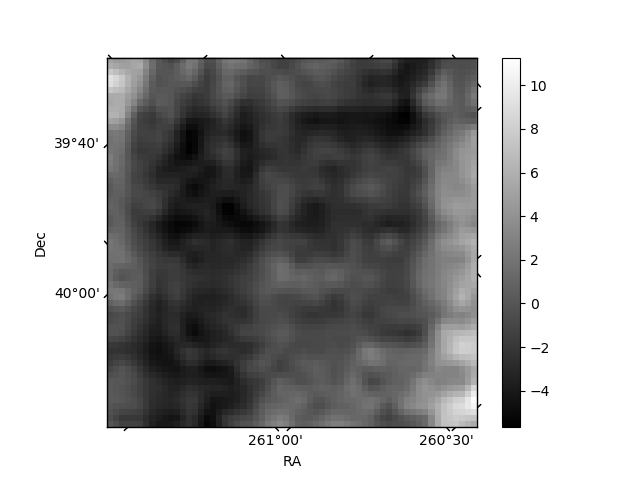
Histogram calculated using DETX and DETY for each event in the final _common_clean file
| Quadrant A | 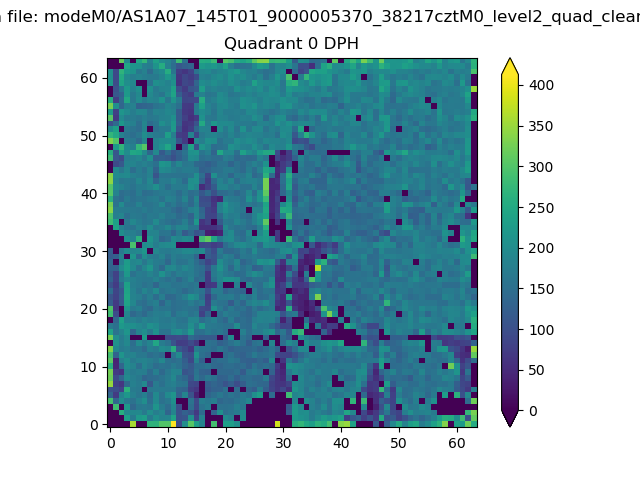 |
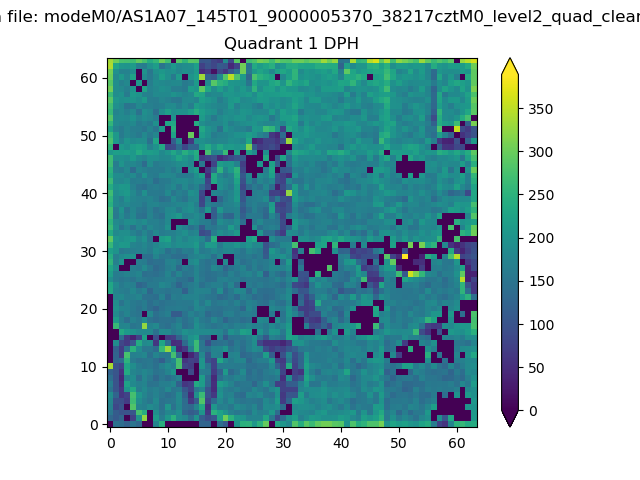 |
Quadrant B |
|---|---|---|---|
| Quadrant D | 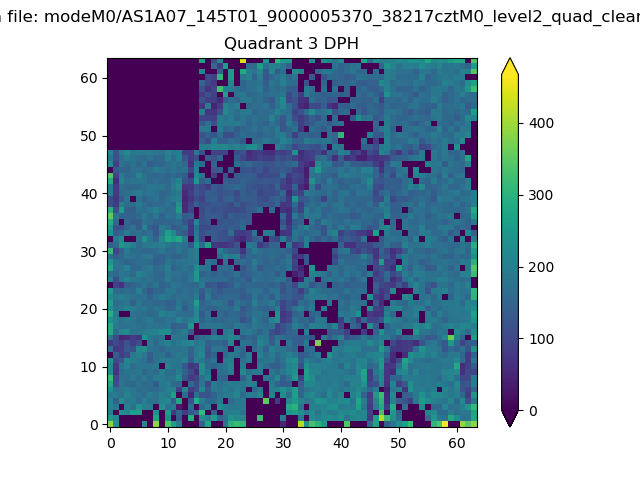 |
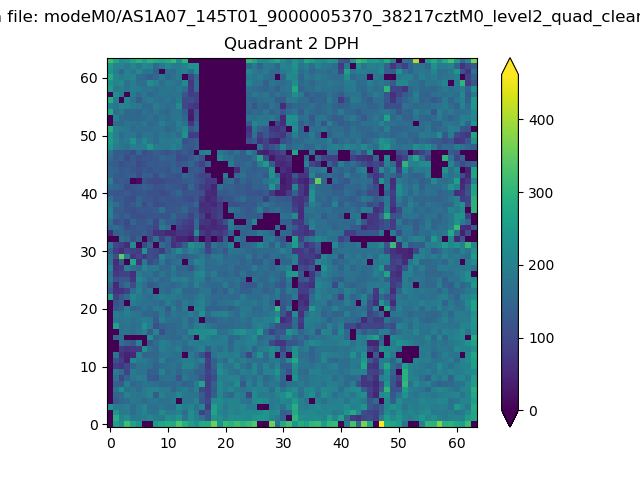 |
Quadrant C |
| Plot type | Count rate plots | Images |
|---|---|---|
| Comparison with Poisson distribution Blue bars denote a histogram of data divided into 1 sec bins. Red curve is a Poisson curve with rate = median count rate of data. |
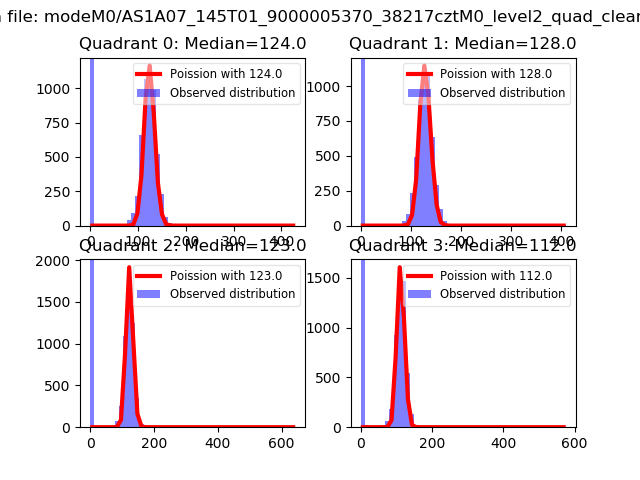 |
 |
| Quadrant-wise count rates Data is divided into 100 sec bins |
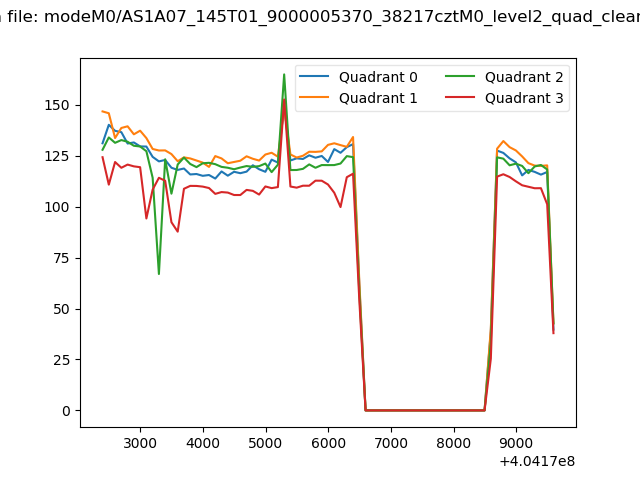 |
|
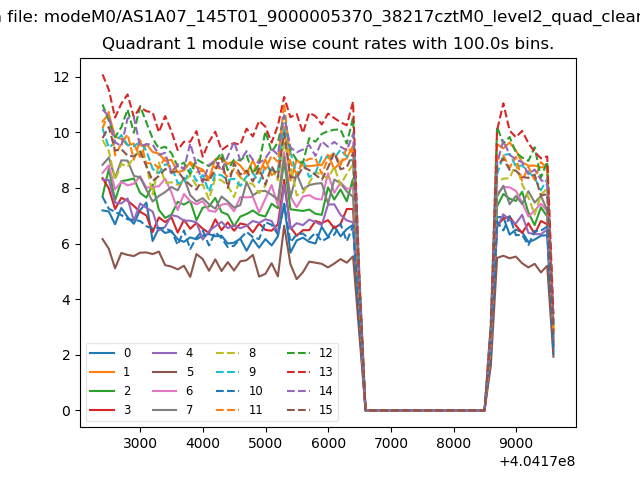
| Module-wise count rates for Quadrant A Data is divided into 100 sec bins |
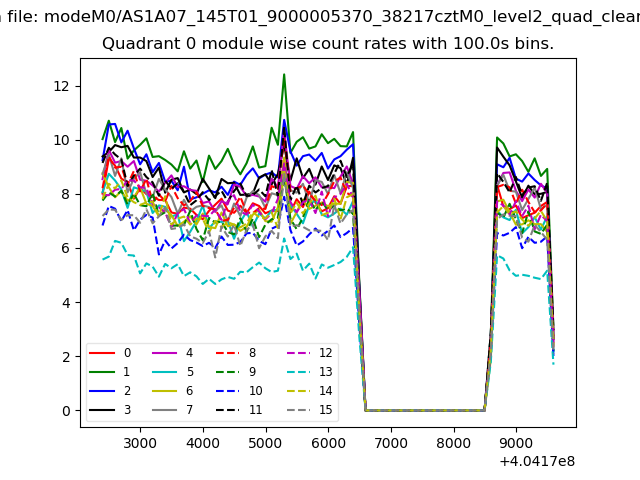 |
 |
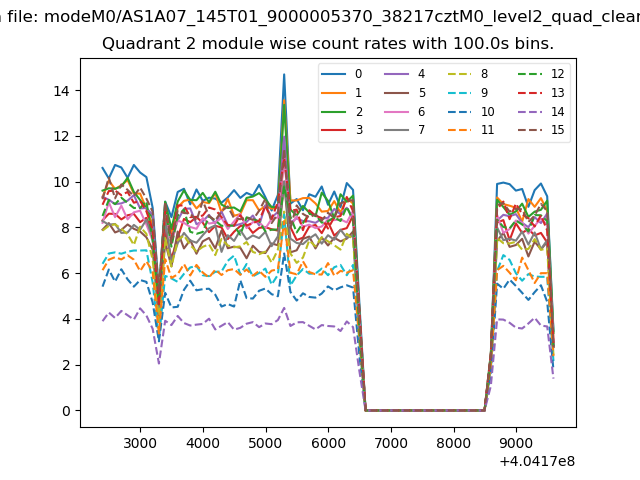
| Module-wise count rates for Quadrant B Data is divided into 100 sec bins |
 |
 |
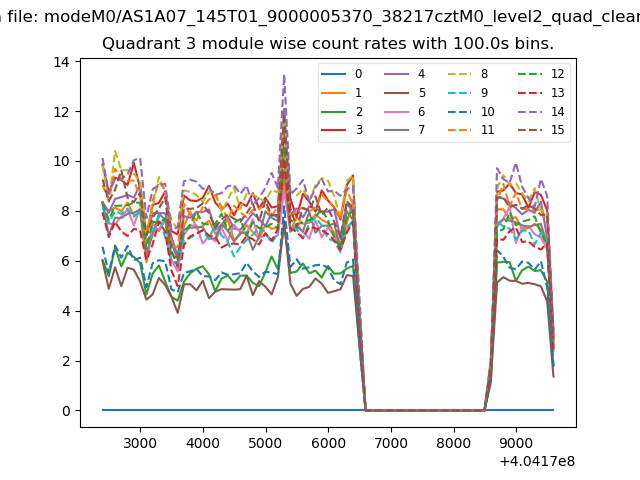
| Module-wise count rates for Quadrant C Data is divided into 100 sec bins |
 |
 |
| Module-wise count rates for Quadrant D Data is divided into 100 sec bins |
 |
 |
| Parameter | Plot |
|---|---|
| CZT HV Monitor | 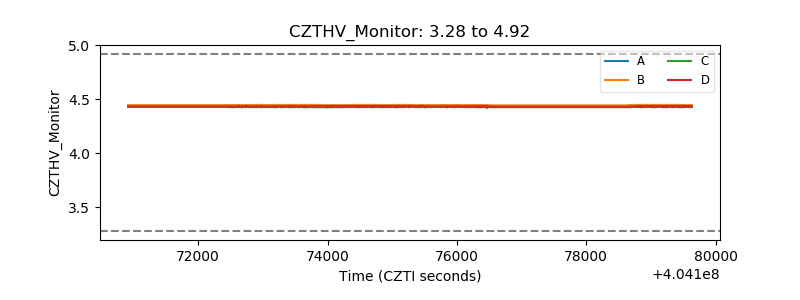 |
| D_VDD | 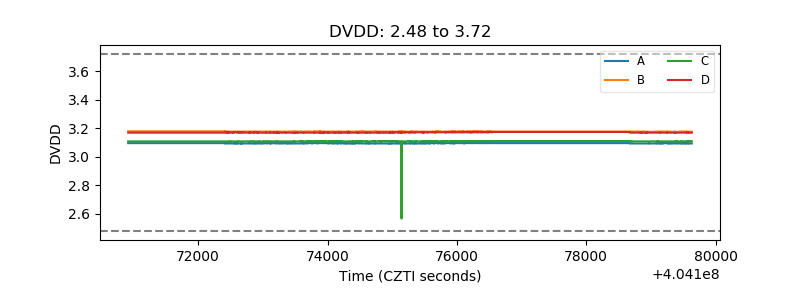 |
| Temperature 1 | 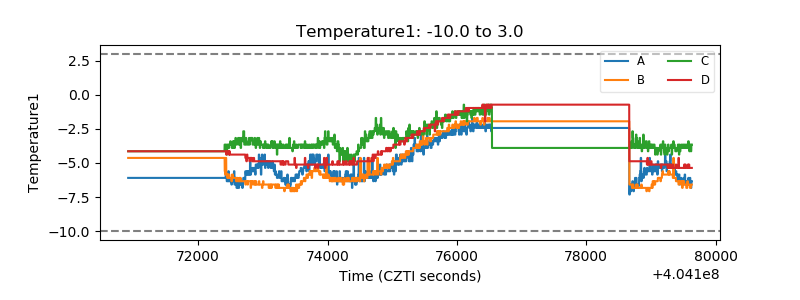 |
| Veto HV Monitor | 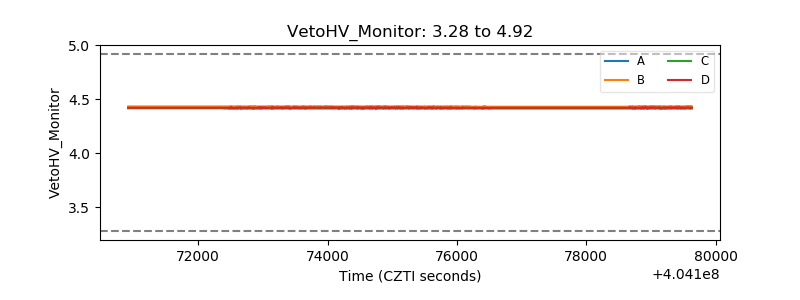 |
| Veto LLD | 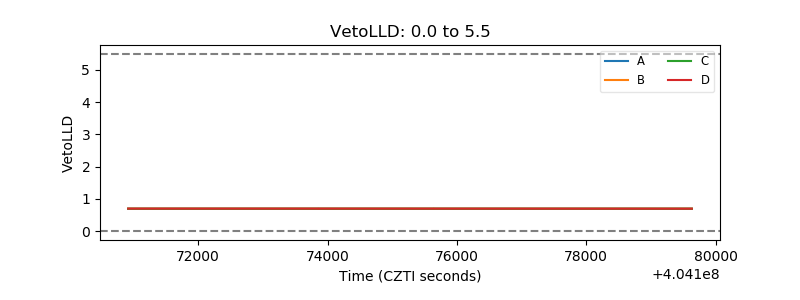 |
| Alpha Counter | 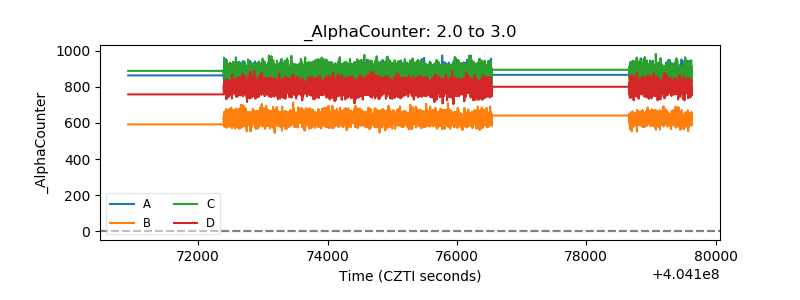 |
| _CPM_Rate | 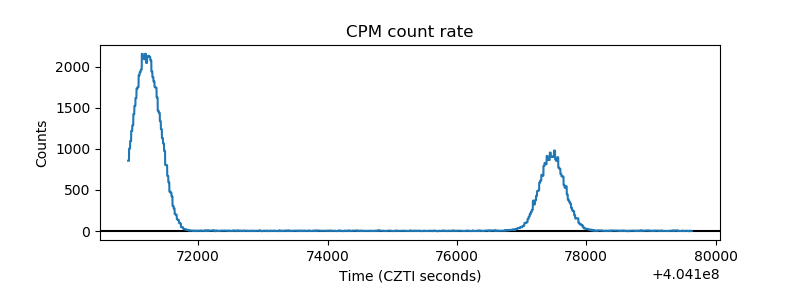 |
| CZT Counter | 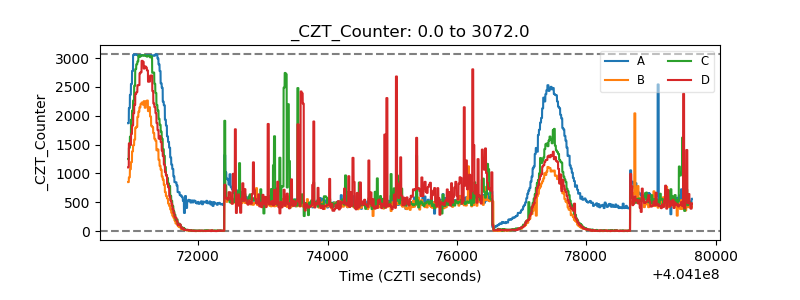 |
| +2.5 Volts monitor | 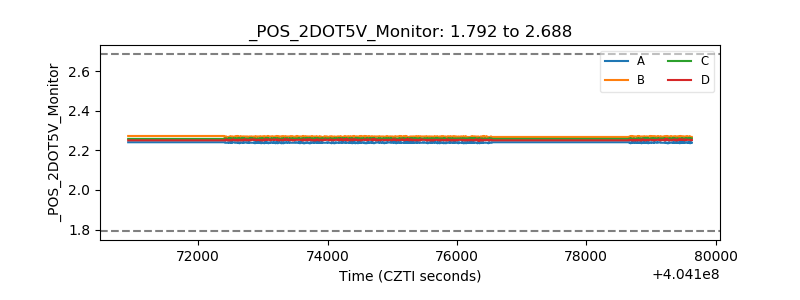 |
| +5 Volts monitor | 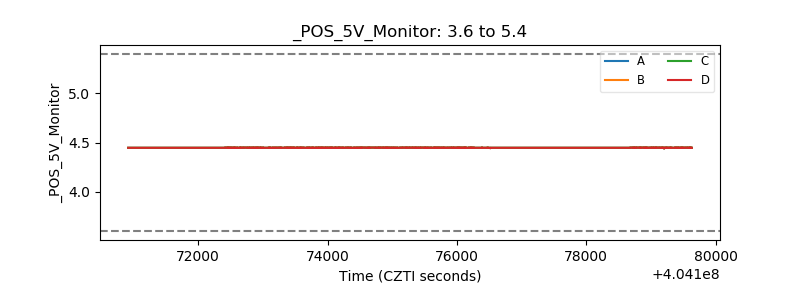 |
| _ROLL_ROT | 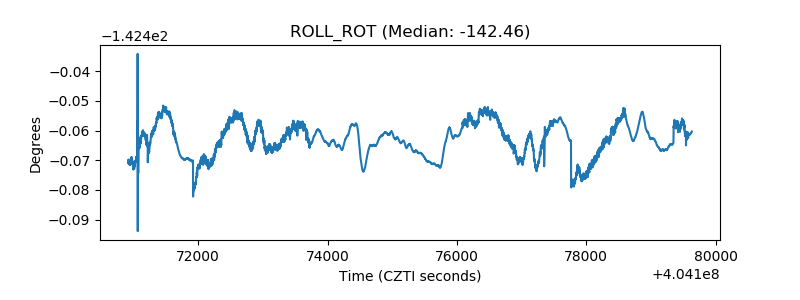 |
| _Roll_DEC | 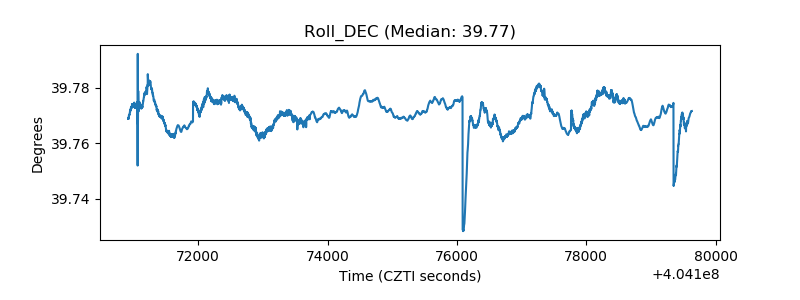 |
| _Roll_RA | 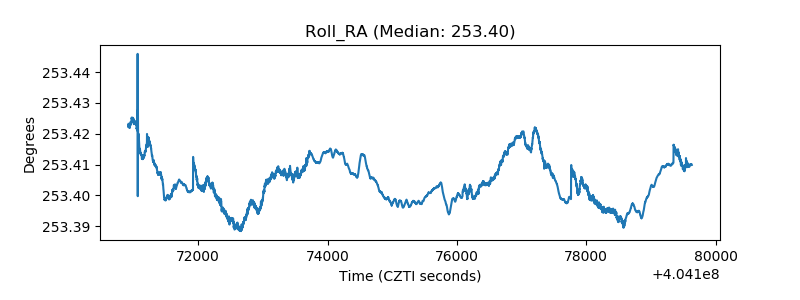 |
| Veto Counter | 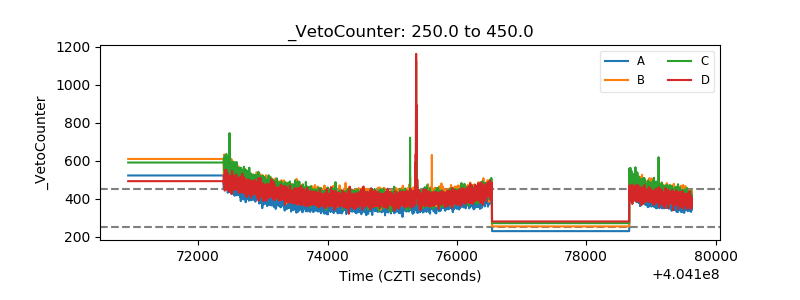 |