| Param | Original file | Final file |
|---|---|---|
| Filename | modeM0/AS1A07_145T01_9000005370_38218cztM0_level2.fits | modeM0/AS1A07_145T01_9000005370_38218cztM0_level2_quad_clean.evt |
| Size (bytes) | 315,028,800 | 90,740,160 |
| Size | 300.4 MB | 86.5 MB |
| Events in quadrant A | 2,833,086 | 607,407 |
| Events in quadrant B | 2,497,977 | 627,498 |
| Events in quadrant C | 2,743,423 | 601,876 |
| Events in quadrant D | 3,182,428 | 547,825 |
| Mode M9 | |||
|---|---|---|---|
| Quadrant | BADHDUFLAG | Total packets | Discarded packets |
| A | 0 | 36 | 0 |
| B | 0 | 36 | 0 |
| C | 0 | 36 | 0 |
| D | 0 | 37 | 0 |
| Mode SS | |||
|---|---|---|---|
| Quadrant | BADHDUFLAG | Total packets | Discarded packets |
| A | 0 | 104 | 0 |
| B | 0 | 104 | 0 |
| C | 0 | 104 | 0 |
| D | 0 | 104 | 0 |
| Mode M0 | |||
|---|---|---|---|
| Quadrant | BADHDUFLAG | Total packets | Discarded packets |
| A | 0 | 11539 | 3 |
| B | 0 | 10750 | 2 |
| C | 0 | 11268 | 2 |
| D | 0 | 12983 | 2 |
| Quadrant | Total seconds | Saturated seconds | Saturation percentage |
|---|---|---|---|
| A | 5188 | 20 | 0.385505% |
| B | 5188 | 19 | 0.366230% |
| C | 5188 | 36 | 0.693909% |
| D | 5188 | 138 | 2.659985% |
Noise dominated data is calculated using 1-second bins in cleaned event files. If a bin has >2000 counts, and if more than 50% of those come from <1% of pixels, then it is considered to be noise-dominated and hence unusable.
| Quadrant | # 1 sec bins | Bins with >0 counts | Bins with >2000 counts | High rate bins dominated by noise | Noise dominated (total time) | Noise dominated (detector-on time) | Marked lightcurve |
|---|---|---|---|---|---|---|---|
| A | 7221 | 5189 | 13 | 13 | 0.18% | 0.25% | 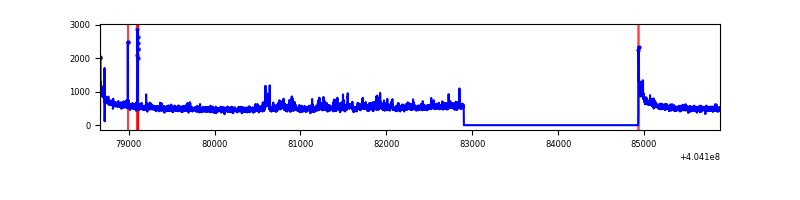 |
| B | 7221 | 5189 | 7 | 7 | 0.10% | 0.13% | 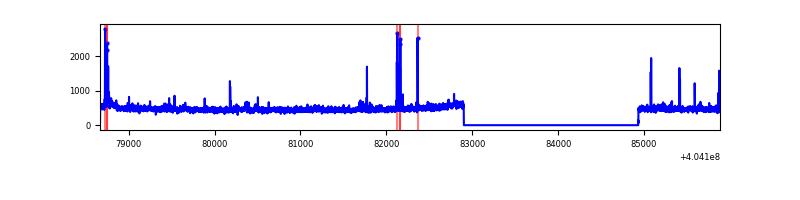 |
| C | 7221 | 5189 | 25 | 25 | 0.35% | 0.48% | 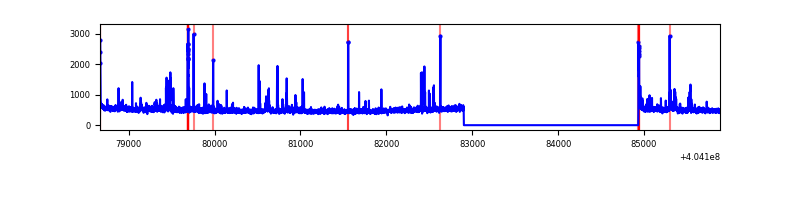 |
| D | 7221 | 5189 | 119 | 119 | 1.65% | 2.29% | 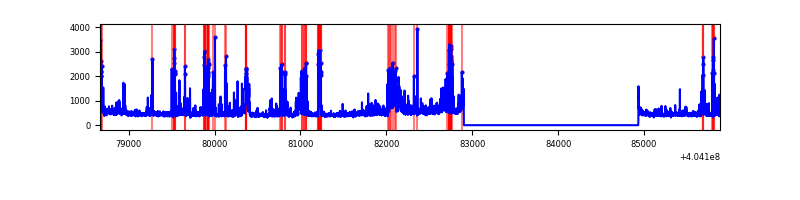 |
Top three noisy pixels from each quadrant. If the there are fewer than three noisy pixels in the level2.evt file, extra rows are filled as -1
| Pixel properties | Quadrant properties | ||||||
|---|---|---|---|---|---|---|---|
| Quadrant | DetID | PixID | Counts | Sigma | Mean | Median | Sigma |
| A | 10 | 83 | 359317 | 2990.24 | 591 | 579 | 120.0 |
| A | 12 | 189 | 143490 | 1191.23 | 591 | 579 | 120.0 |
| A | 7 | 16 | 21519 | 174.54 | 591 | 579 | 120.0 |
| B | 0 | 183 | 55588 | 481.27 | 592 | 576 | 114.3 |
| B | 5 | 172 | 25452 | 217.63 | 592 | 576 | 114.3 |
| B | 15 | 85 | 22732 | 193.83 | 592 | 576 | 114.3 |
| C | 15 | 214 | 214821 | 1572.34 | 577 | 580 | 136.3 |
| C | 9 | 236 | 123630 | 903.08 | 577 | 580 | 136.3 |
| C | 14 | 254 | 97268 | 709.6 | 577 | 580 | 136.3 |
| D | 13 | 138 | 395893 | 2835.76 | 570 | 553 | 139.4 |
| D | 1 | 52 | 267130 | 1912.15 | 570 | 553 | 139.4 |
| D | 12 | 227 | 111582 | 796.41 | 570 | 553 | 139.4 |
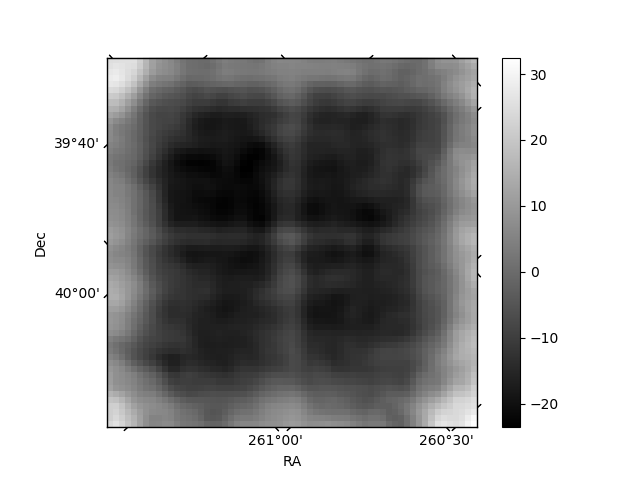
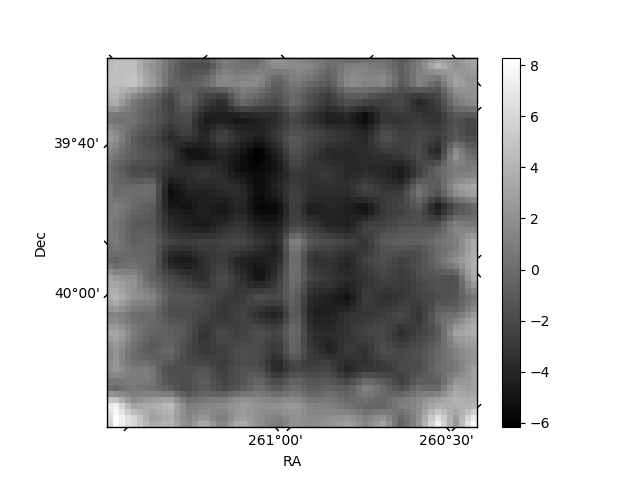
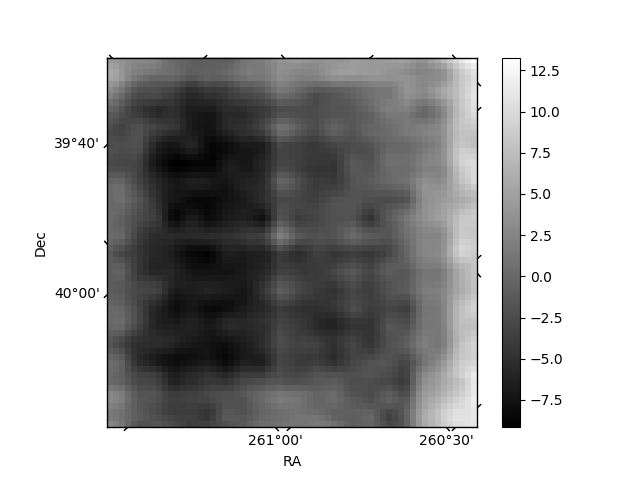
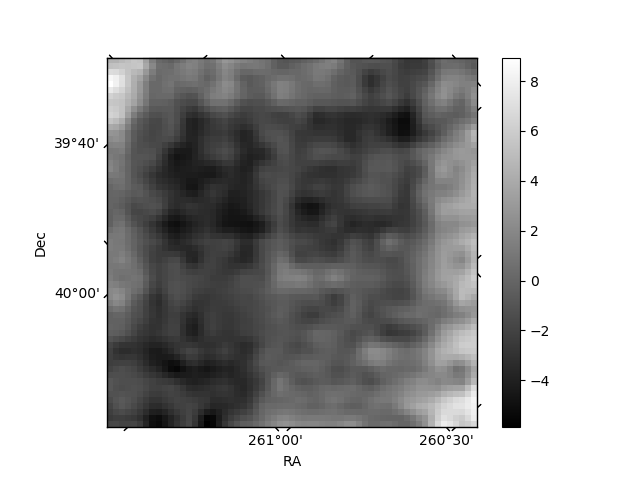
Histogram calculated using DETX and DETY for each event in the final _common_clean file
| Quadrant A | 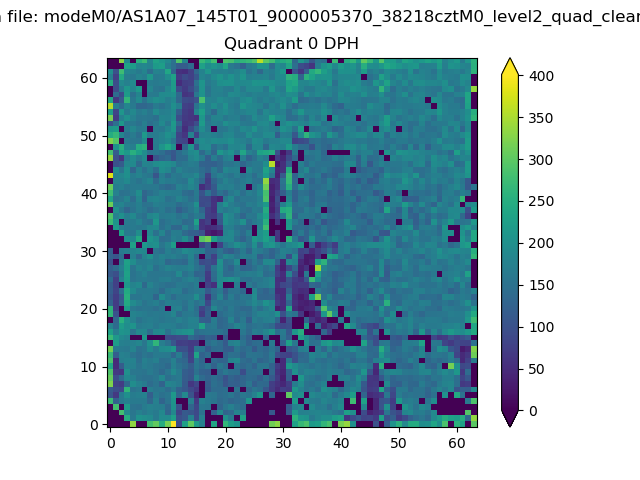 |
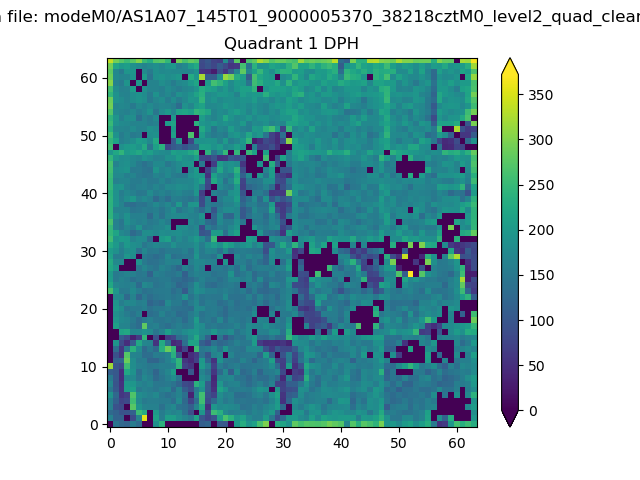 |
Quadrant B |
|---|---|---|---|
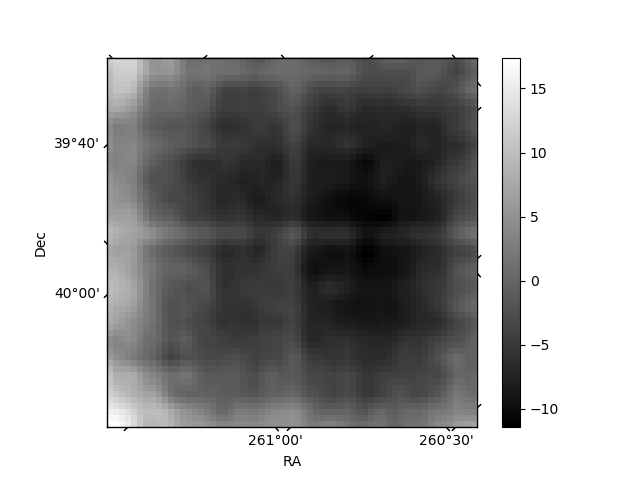
| Quadrant D | 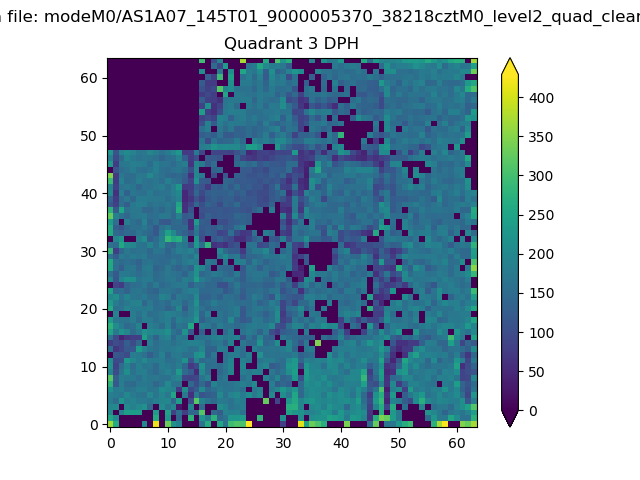 |
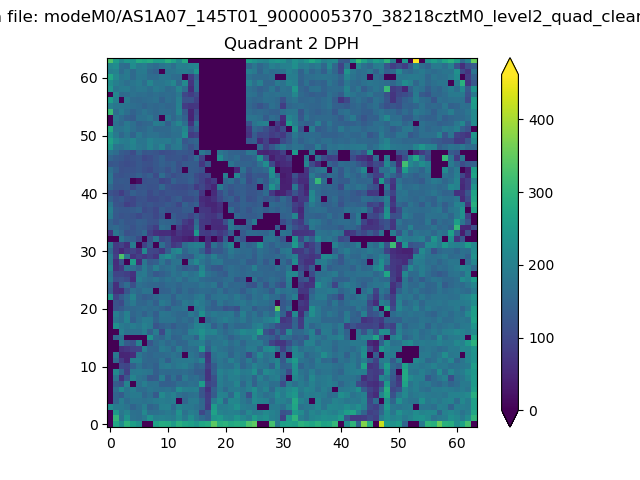 |
Quadrant C |
| Plot type | Count rate plots | Images |
|---|---|---|
| Comparison with Poisson distribution Blue bars denote a histogram of data divided into 1 sec bins. Red curve is a Poisson curve with rate = median count rate of data. |
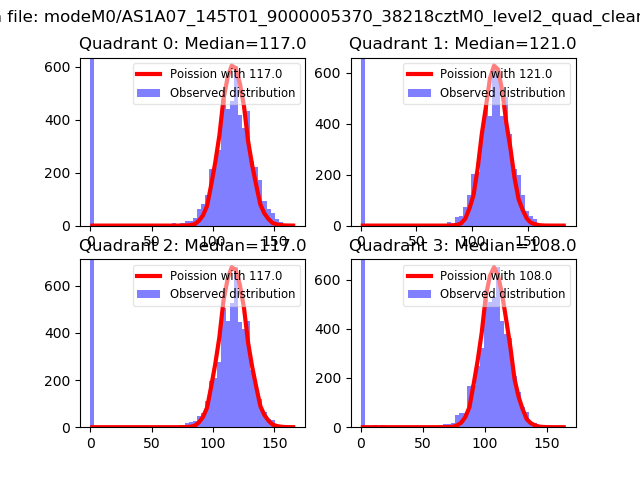 |
 |
| Quadrant-wise count rates Data is divided into 100 sec bins |
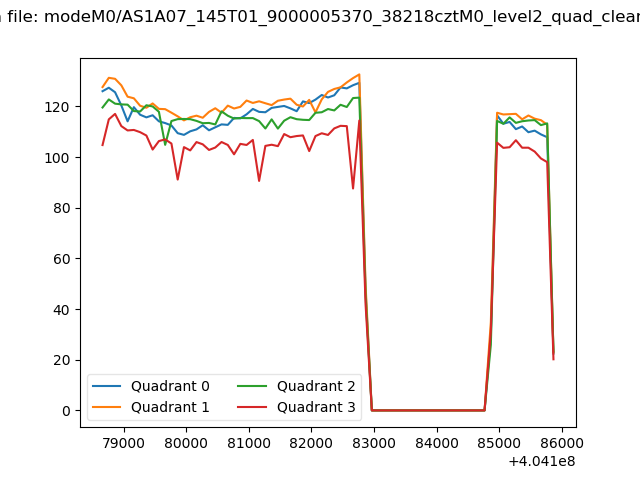 |
|
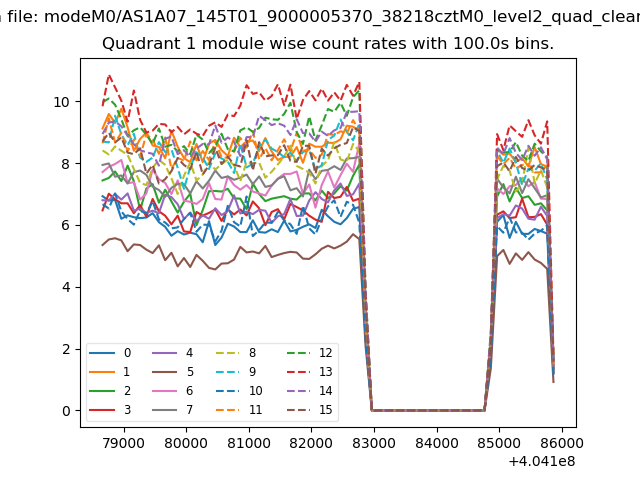
| Module-wise count rates for Quadrant A Data is divided into 100 sec bins |
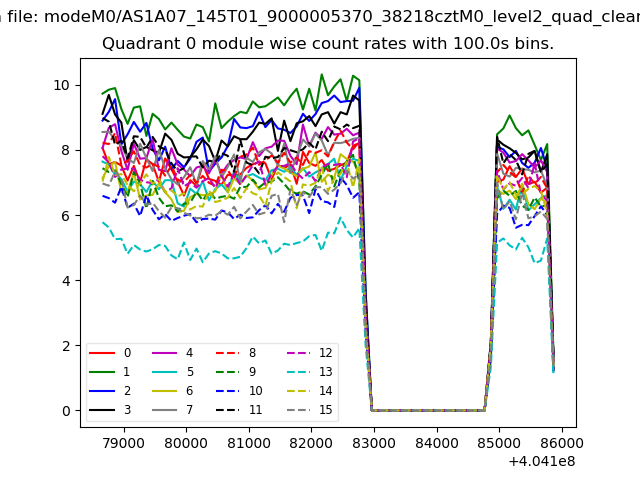 |
 |
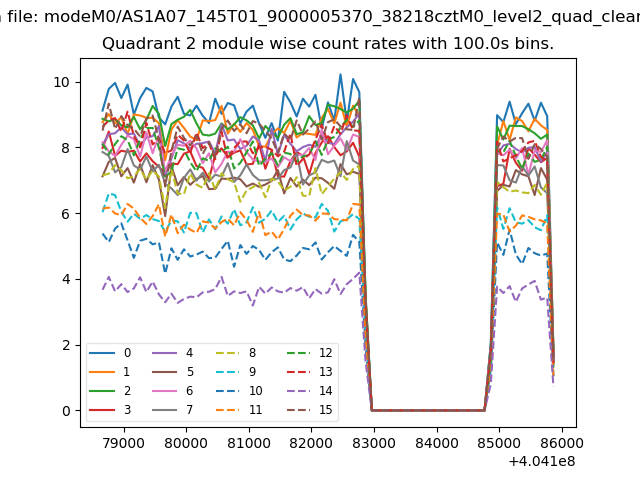
| Module-wise count rates for Quadrant B Data is divided into 100 sec bins |
 |
 |
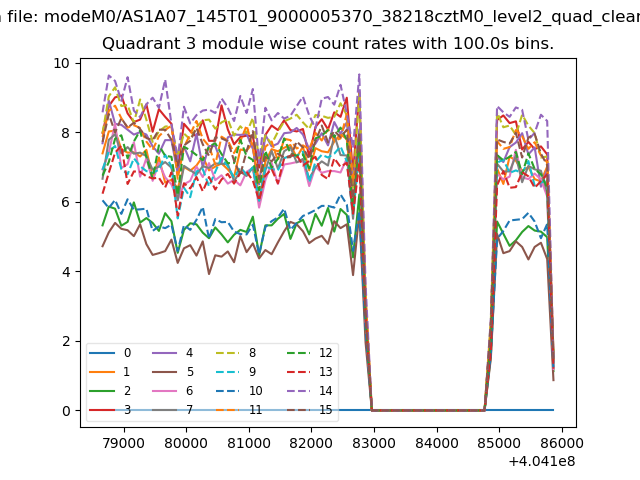
| Module-wise count rates for Quadrant C Data is divided into 100 sec bins |
 |
 |
| Module-wise count rates for Quadrant D Data is divided into 100 sec bins |
 |
 |
| Parameter | Plot |
|---|---|
| CZT HV Monitor | 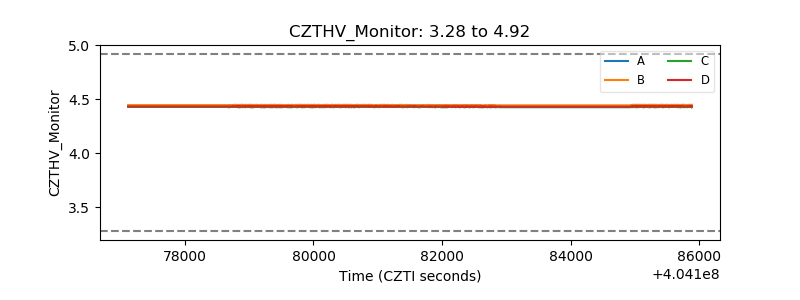 |
| D_VDD | 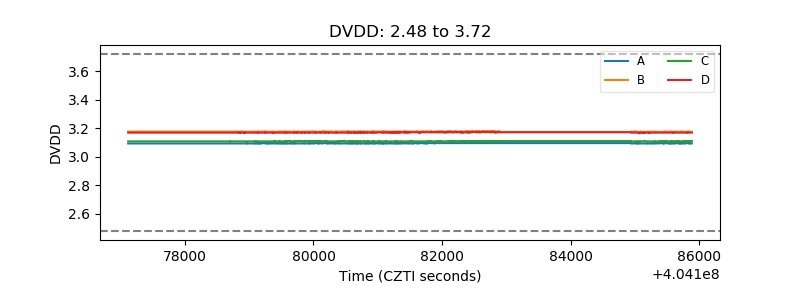 |
| Temperature 1 | 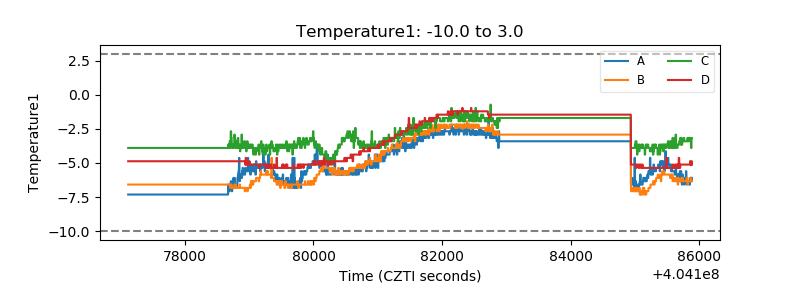 |
| Veto HV Monitor | 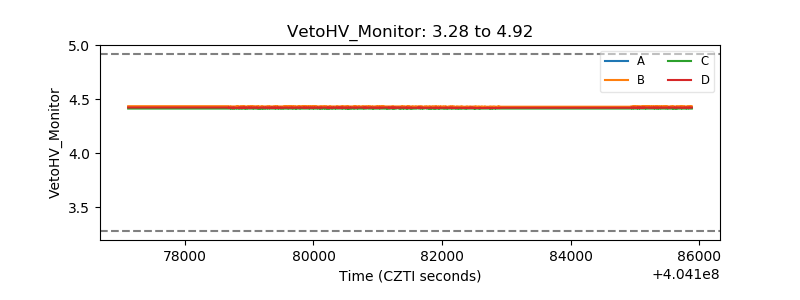 |
| Veto LLD | 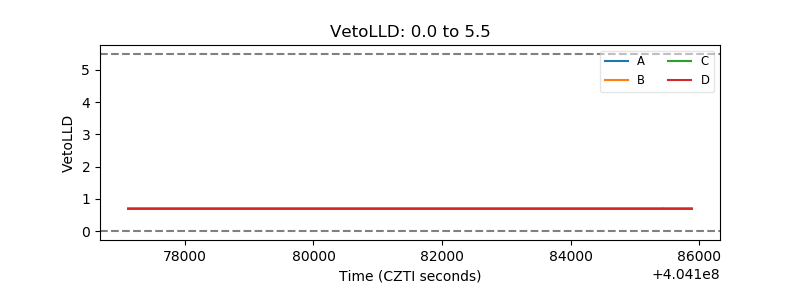 |
| Alpha Counter | 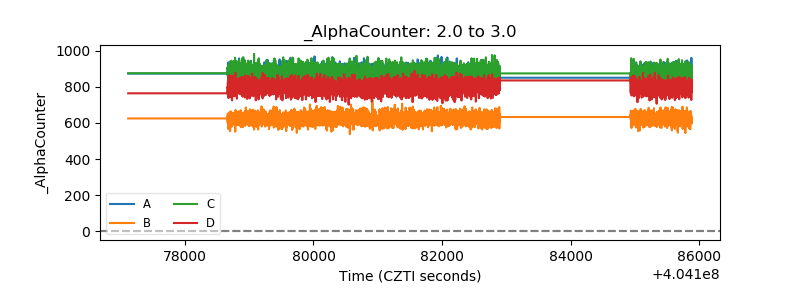 |
| _CPM_Rate | 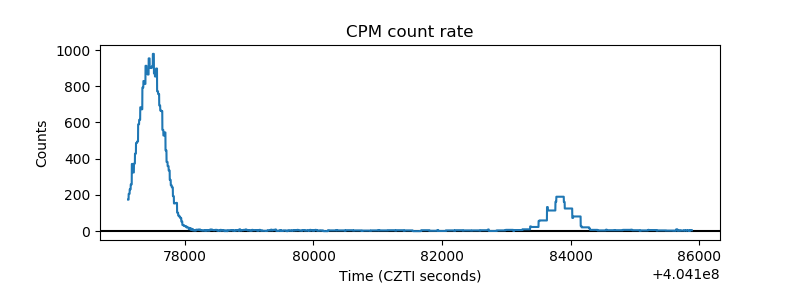 |
| CZT Counter | 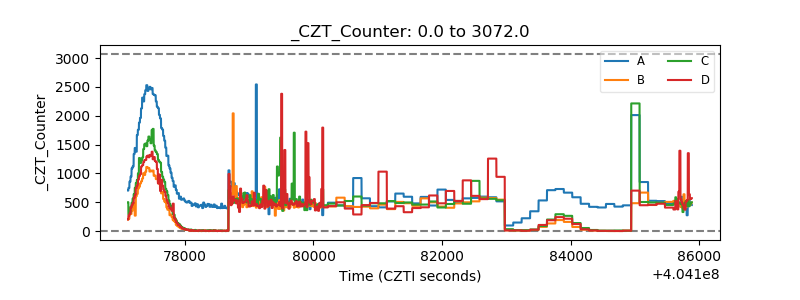 |
| +2.5 Volts monitor | 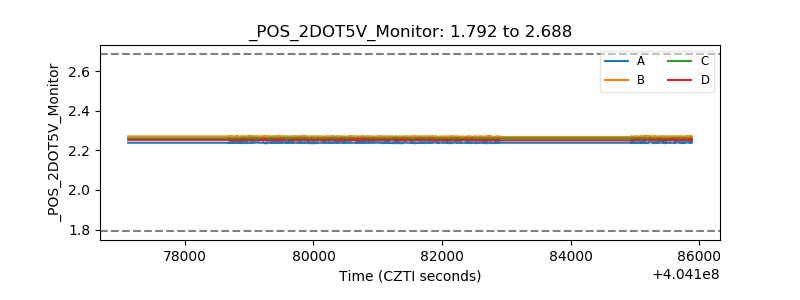 |
| +5 Volts monitor | 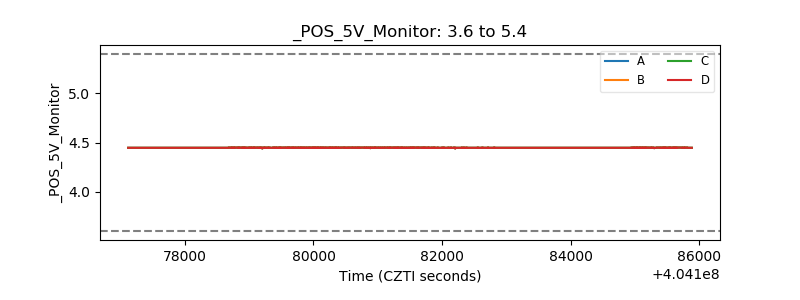 |
| _ROLL_ROT | 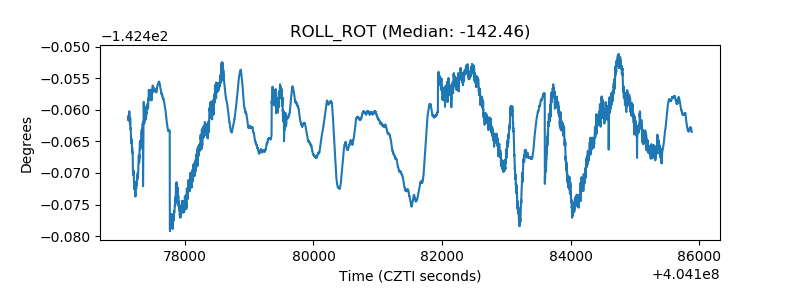 |
| _Roll_DEC | 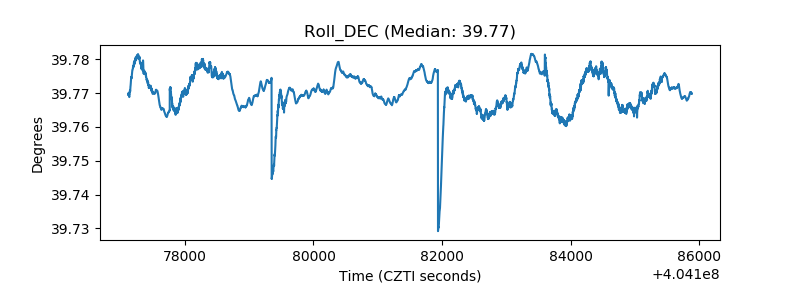 |
| _Roll_RA | 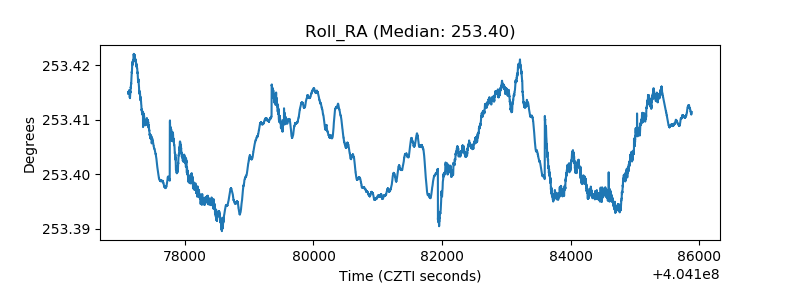 |
| Veto Counter | 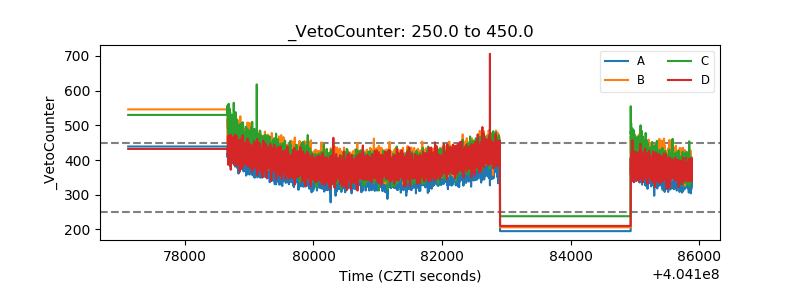 |