| Param | Original file | Final file |
|---|---|---|
| Filename | modeM0/AS1A07_145T01_9000005370_38219cztM0_level2.fits | modeM0/AS1A07_145T01_9000005370_38219cztM0_level2_quad_clean.evt |
| Size (bytes) | 335,496,960 | 91,601,280 |
| Size | 320.0 MB | 87.4 MB |
| Events in quadrant A | 2,797,360 | 614,735 |
| Events in quadrant B | 2,718,288 | 634,310 |
| Events in quadrant C | 2,835,909 | 605,788 |
| Events in quadrant D | 3,647,519 | 541,408 |
| Mode M9 | |||
|---|---|---|---|
| Quadrant | BADHDUFLAG | Total packets | Discarded packets |
| A | 0 | 34 | 0 |
| B | 0 | 34 | 0 |
| C | 0 | 34 | 0 |
| D | 0 | 35 | 0 |
| Mode SS | |||
|---|---|---|---|
| Quadrant | BADHDUFLAG | Total packets | Discarded packets |
| A | 0 | 110 | 0 |
| B | 0 | 110 | 0 |
| C | 0 | 110 | 0 |
| D | 0 | 110 | 0 |
| Mode M0 | |||
|---|---|---|---|
| Quadrant | BADHDUFLAG | Total packets | Discarded packets |
| A | 0 | 11481 | 3 |
| B | 0 | 11656 | 2 |
| C | 0 | 11660 | 2 |
| D | 0 | 14525 | 2 |
| Quadrant | Total seconds | Saturated seconds | Saturation percentage |
|---|---|---|---|
| A | 5392 | 14 | 0.259644% |
| B | 5392 | 12 | 0.222552% |
| C | 5392 | 30 | 0.556380% |
| D | 5392 | 247 | 4.580861% |
Noise dominated data is calculated using 1-second bins in cleaned event files. If a bin has >2000 counts, and if more than 50% of those come from <1% of pixels, then it is considered to be noise-dominated and hence unusable.
| Quadrant | # 1 sec bins | Bins with >0 counts | Bins with >2000 counts | High rate bins dominated by noise | Noise dominated (total time) | Noise dominated (detector-on time) | Marked lightcurve |
|---|---|---|---|---|---|---|---|
| A | 7124 | 5393 | 2 | 2 | 0.03% | 0.04% | 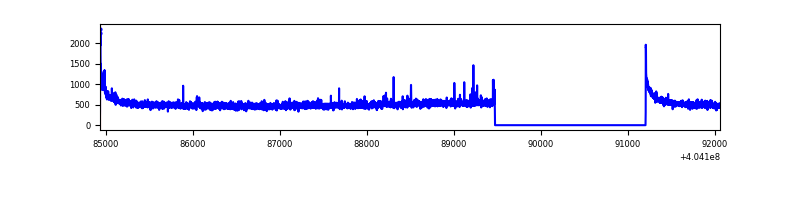 |
| B | 7124 | 5393 | 4 | 4 | 0.06% | 0.07% | 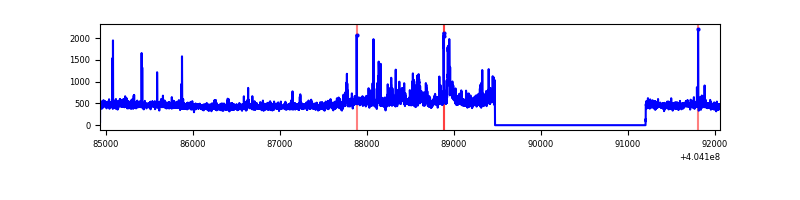 |
| C | 7124 | 5393 | 18 | 18 | 0.25% | 0.33% | 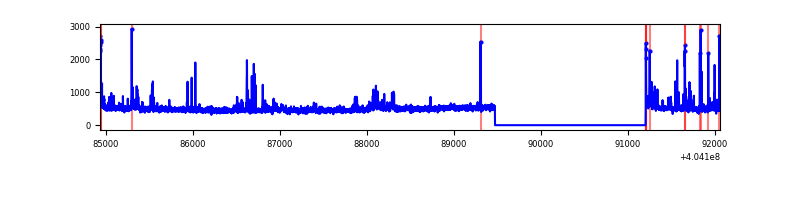 |
| D | 7124 | 5393 | 208 | 208 | 2.92% | 3.86% | 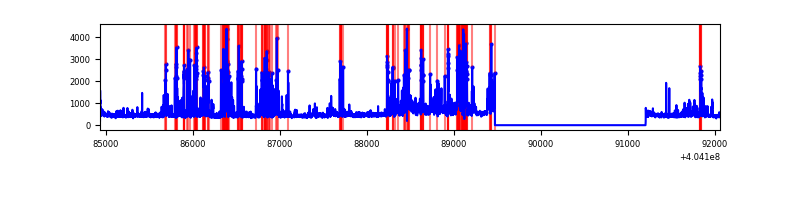 |
Top three noisy pixels from each quadrant. If the there are fewer than three noisy pixels in the level2.evt file, extra rows are filled as -1
| Pixel properties | Quadrant properties | ||||||
|---|---|---|---|---|---|---|---|
| Quadrant | DetID | PixID | Counts | Sigma | Mean | Median | Sigma |
| A | 10 | 83 | 376511 | 3025.78 | 607 | 594 | 124.2 |
| A | 12 | 189 | 39971 | 316.95 | 607 | 594 | 124.2 |
| A | 13 | 248 | 14021 | 108.07 | 607 | 594 | 124.2 |
| B | 0 | 183 | 239446 | 2026.25 | 606 | 589 | 117.9 |
| B | 5 | 172 | 25831 | 214.13 | 606 | 589 | 117.9 |
| B | 0 | 230 | 20892 | 172.23 | 606 | 589 | 117.9 |
| C | 15 | 214 | 224167 | 1618.75 | 590 | 592 | 138.1 |
| C | 14 | 254 | 148775 | 1072.89 | 590 | 592 | 138.1 |
| C | 9 | 236 | 83764 | 602.19 | 590 | 592 | 138.1 |
| D | 13 | 138 | 581583 | 4120.43 | 581 | 565 | 141.0 |
| D | 1 | 52 | 331149 | 2344.42 | 581 | 565 | 141.0 |
| D | 2 | 16 | 154266 | 1090.01 | 581 | 565 | 141.0 |
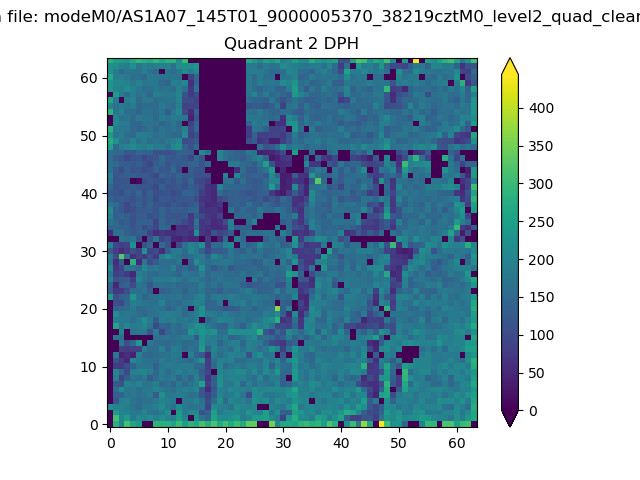
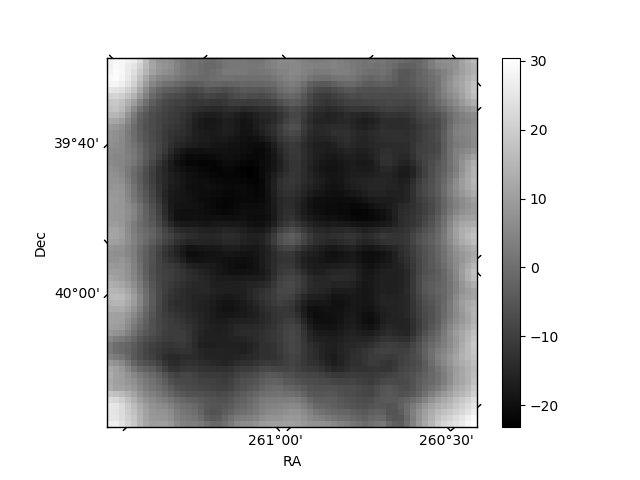
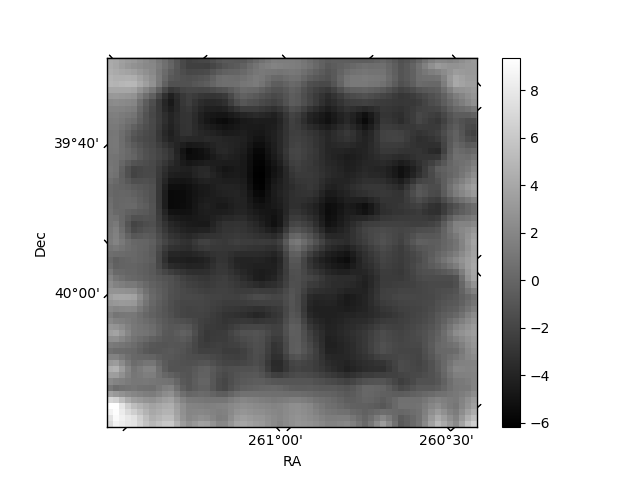
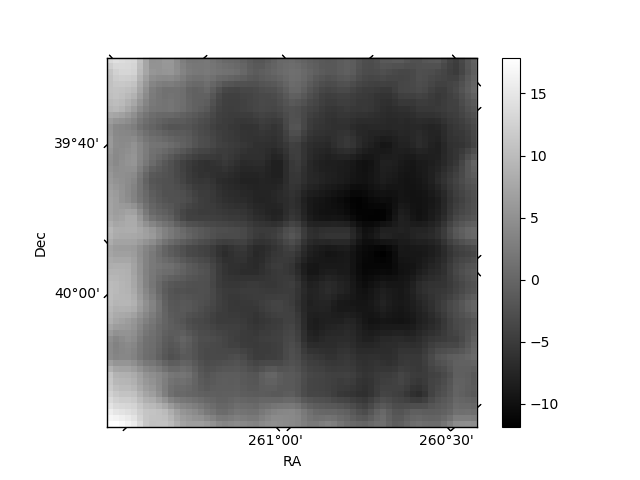
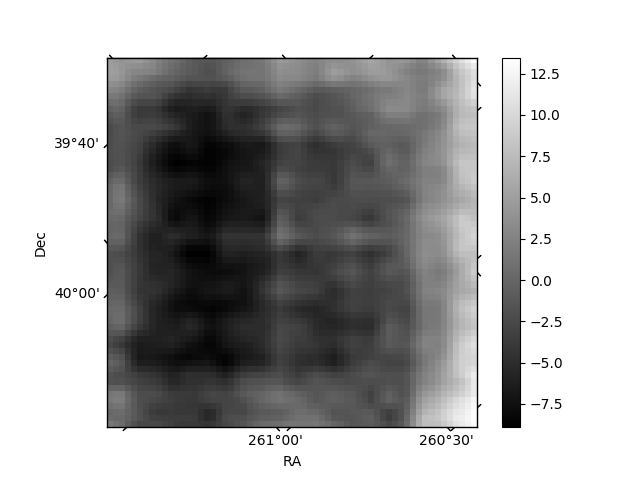
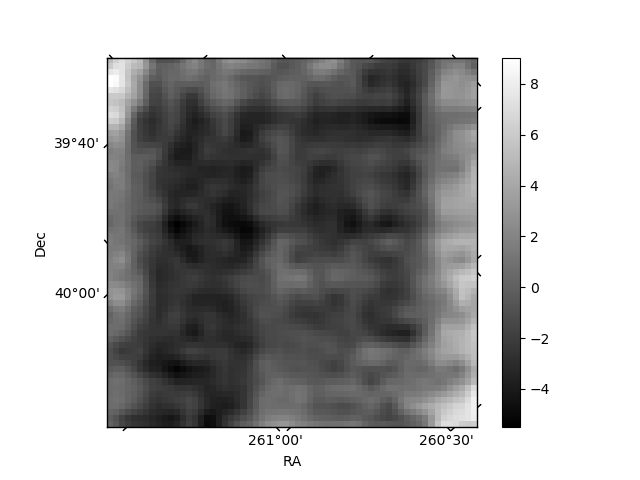
Histogram calculated using DETX and DETY for each event in the final _common_clean file
| Quadrant A | 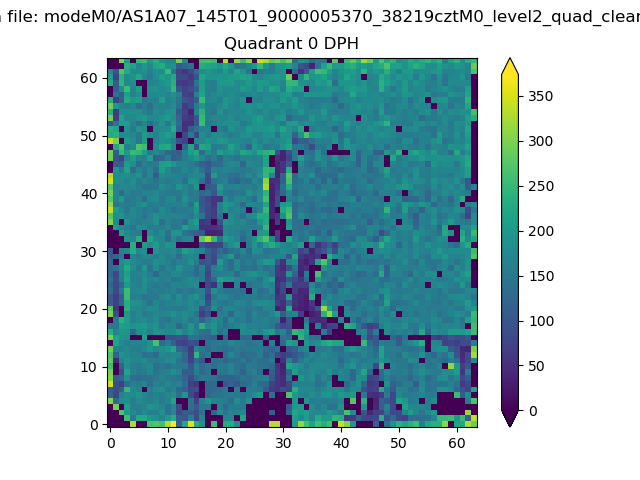 |
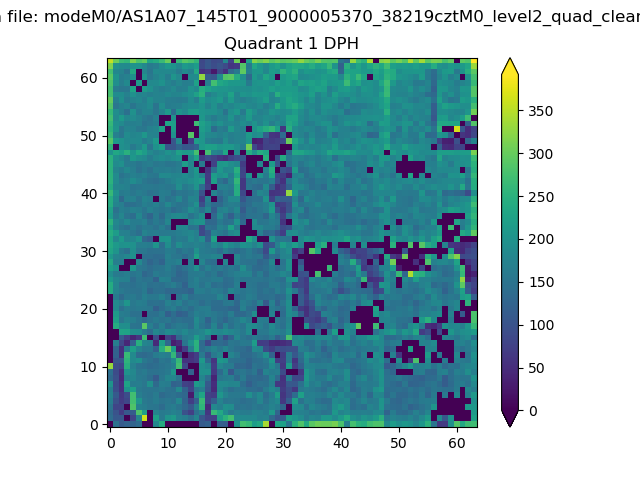 |
Quadrant B |
|---|---|---|---|
| Quadrant D | 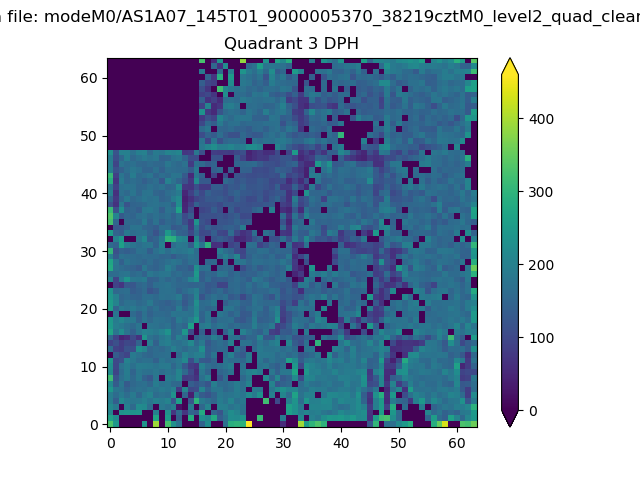 |
 |
Quadrant C |
| Plot type | Count rate plots | Images |
|---|---|---|
| Comparison with Poisson distribution Blue bars denote a histogram of data divided into 1 sec bins. Red curve is a Poisson curve with rate = median count rate of data. |
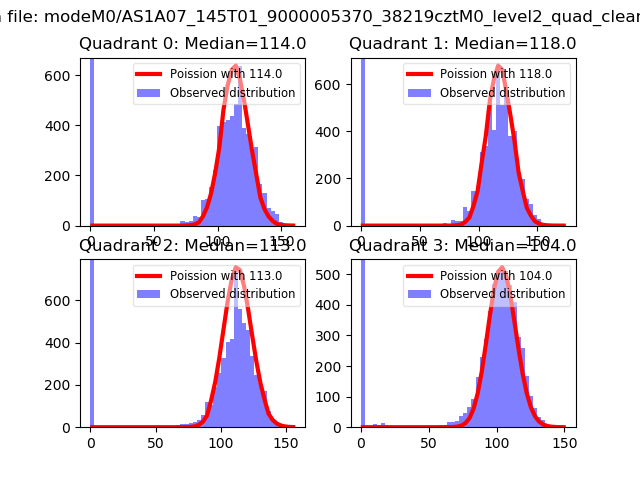 |
 |
| Quadrant-wise count rates Data is divided into 100 sec bins |
 |
|
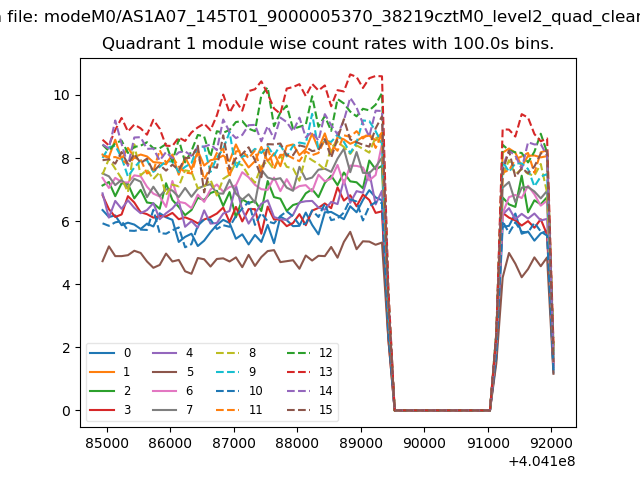
| Module-wise count rates for Quadrant A Data is divided into 100 sec bins |
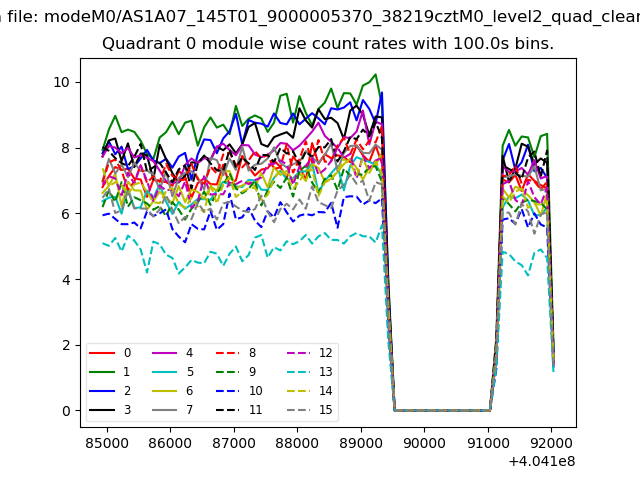 |
 |
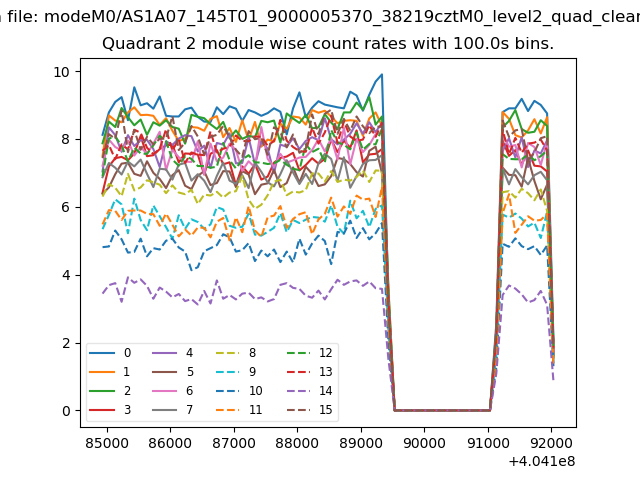
| Module-wise count rates for Quadrant B Data is divided into 100 sec bins |
 |
 |
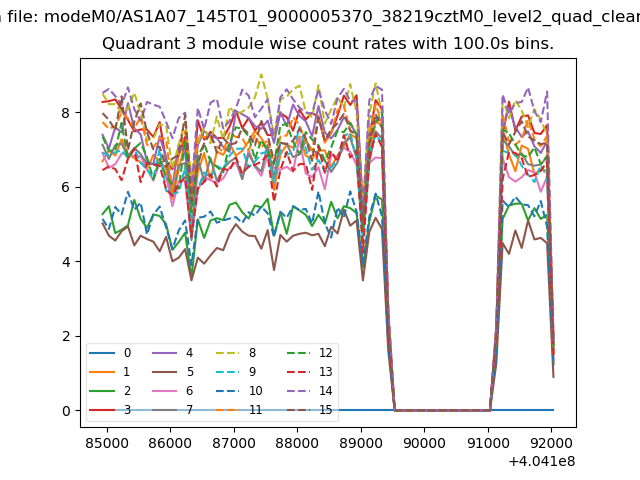
| Module-wise count rates for Quadrant C Data is divided into 100 sec bins |
 |
 |
| Module-wise count rates for Quadrant D Data is divided into 100 sec bins |
 |
 |
| Parameter | Plot |
|---|---|
| CZT HV Monitor | 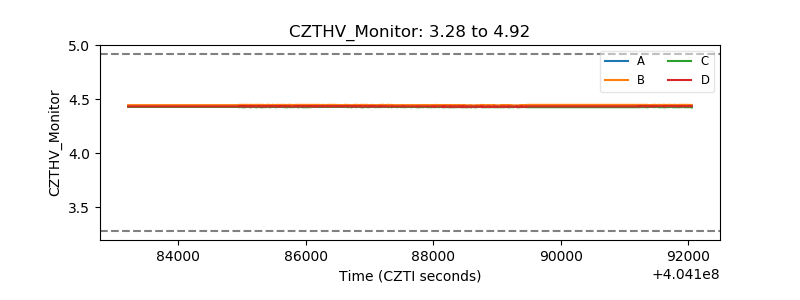 |
| D_VDD | 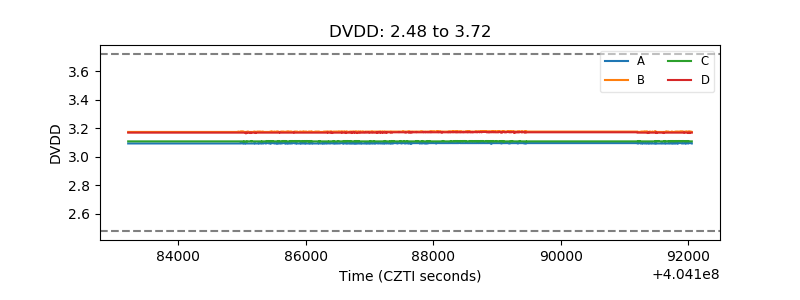 |
| Temperature 1 |  |
| Veto HV Monitor |  |
| Veto LLD | 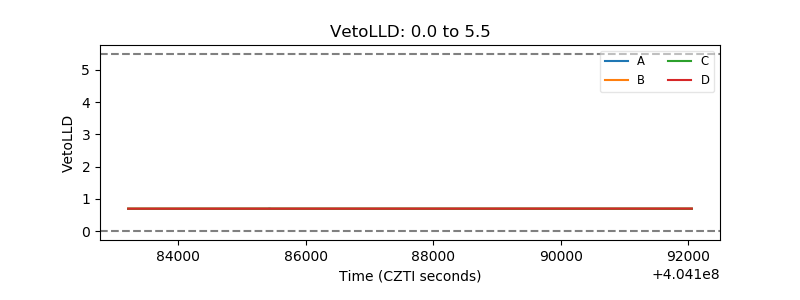 |
| Alpha Counter | 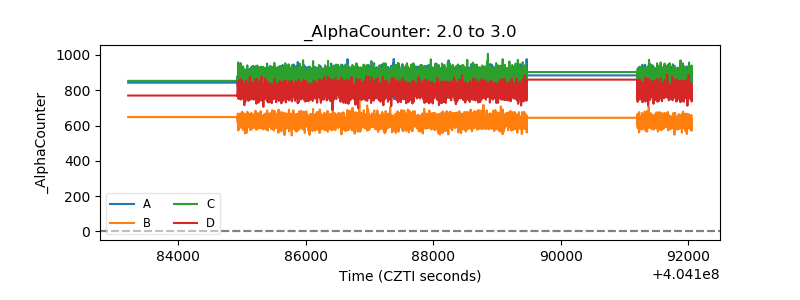 |
| _CPM_Rate | 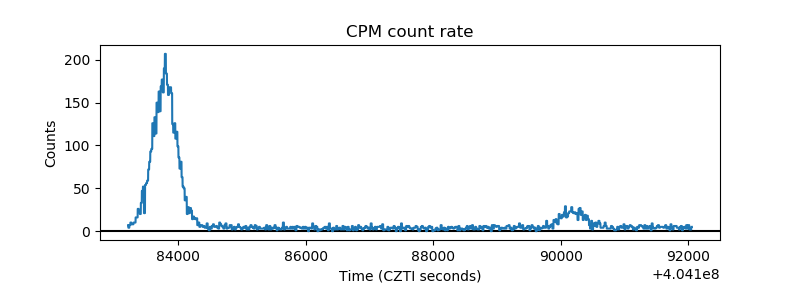 |
| CZT Counter | 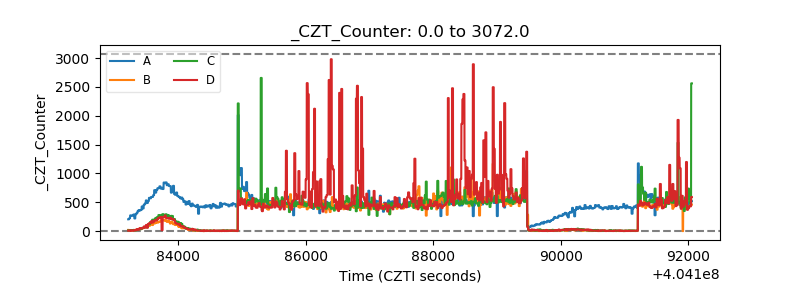 |
| +2.5 Volts monitor | 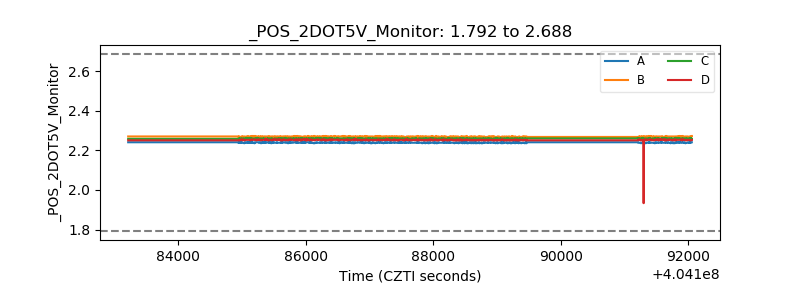 |
| +5 Volts monitor | 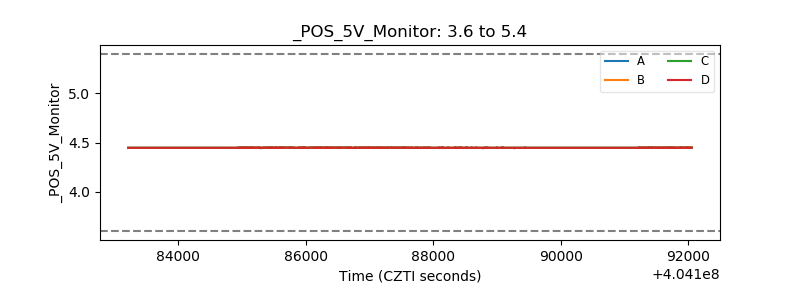 |
| _ROLL_ROT | 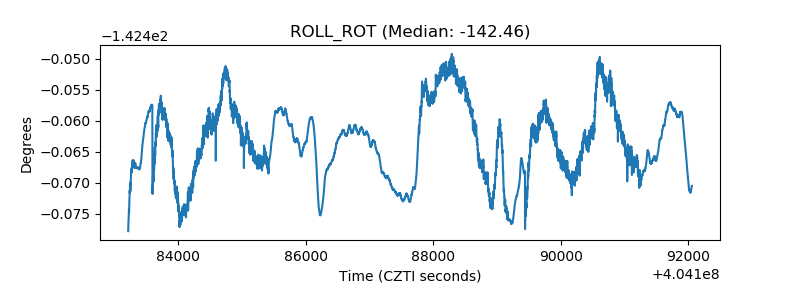 |
| _Roll_DEC | 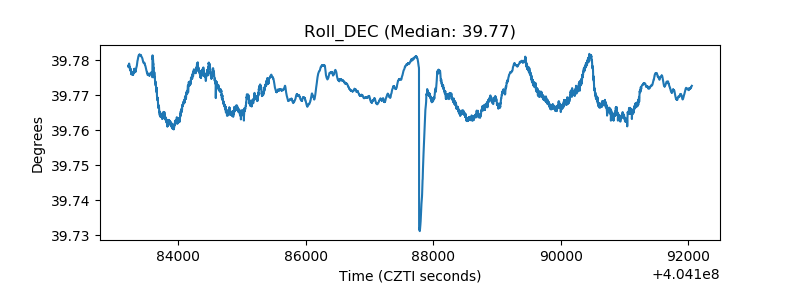 |
| _Roll_RA | 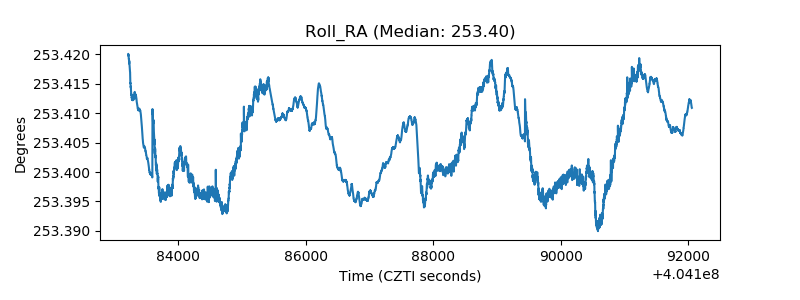 |
| Veto Counter | 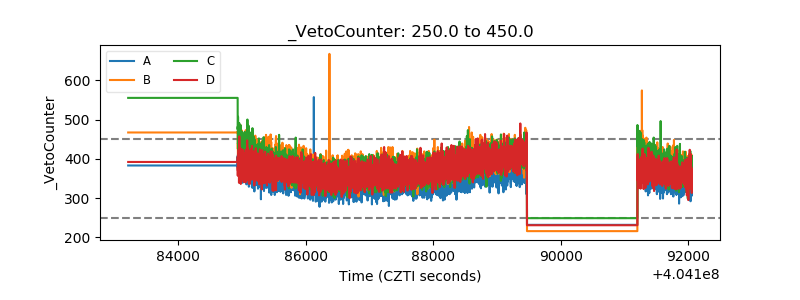 |