| Param | Original file | Final file |
|---|---|---|
| Filename | modeM0/AS1A07_145T01_9000005370_38220cztM0_level2.fits | modeM0/AS1A07_145T01_9000005370_38220cztM0_level2_quad_clean.evt |
| Size (bytes) | 336,234,240 | 97,151,040 |
| Size | 320.7 MB | 92.7 MB |
| Events in quadrant A | 2,985,518 | 648,633 |
| Events in quadrant B | 2,698,792 | 667,615 |
| Events in quadrant C | 3,218,207 | 634,294 |
| Events in quadrant D | 3,096,244 | 589,395 |
| Mode M9 | |||
|---|---|---|---|
| Quadrant | BADHDUFLAG | Total packets | Discarded packets |
| A | 0 | 28 | 0 |
| B | 0 | 28 | 0 |
| C | 0 | 28 | 0 |
| D | 0 | 29 | 0 |
| Mode SS | |||
|---|---|---|---|
| Quadrant | BADHDUFLAG | Total packets | Discarded packets |
| A | 0 | 118 | 0 |
| B | 0 | 118 | 0 |
| C | 0 | 118 | 0 |
| D | 0 | 118 | 0 |
| Mode M0 | |||
|---|---|---|---|
| Quadrant | BADHDUFLAG | Total packets | Discarded packets |
| A | 0 | 12314 | 3 |
| B | 0 | 11826 | 2 |
| C | 0 | 13219 | 2 |
| D | 0 | 13212 | 2 |
| Quadrant | Total seconds | Saturated seconds | Saturation percentage |
|---|---|---|---|
| A | 5745 | 20 | 0.348129% |
| B | 5745 | 20 | 0.348129% |
| C | 5745 | 66 | 1.148825% |
| D | 5745 | 64 | 1.114012% |
Noise dominated data is calculated using 1-second bins in cleaned event files. If a bin has >2000 counts, and if more than 50% of those come from <1% of pixels, then it is considered to be noise-dominated and hence unusable.
| Quadrant | # 1 sec bins | Bins with >0 counts | Bins with >2000 counts | High rate bins dominated by noise | Noise dominated (total time) | Noise dominated (detector-on time) | Marked lightcurve |
|---|---|---|---|---|---|---|---|
| A | 7178 | 5746 | 9 | 9 | 0.13% | 0.16% |  |
| B | 7178 | 5746 | 12 | 12 | 0.17% | 0.21% |  |
| C | 7178 | 5746 | 48 | 48 | 0.67% | 0.84% |  |
| D | 7178 | 5746 | 55 | 55 | 0.77% | 0.96% |  |
Top three noisy pixels from each quadrant. If the there are fewer than three noisy pixels in the level2.evt file, extra rows are filled as -1
| Pixel properties | Quadrant properties | ||||||
|---|---|---|---|---|---|---|---|
| Quadrant | DetID | PixID | Counts | Sigma | Mean | Median | Sigma |
| A | 10 | 83 | 399125 | 3018.64 | 645 | 630 | 132.0 |
| A | 12 | 189 | 53582 | 401.12 | 645 | 630 | 132.0 |
| A | 10 | 248 | 22338 | 164.44 | 645 | 630 | 132.0 |
| B | 0 | 183 | 73889 | 586.78 | 643 | 624 | 124.9 |
| B | 5 | 172 | 50870 | 402.42 | 643 | 624 | 124.9 |
| B | 0 | 229 | 24565 | 191.75 | 643 | 624 | 124.9 |
| C | 3 | 9 | 241106 | 1629.18 | 626 | 628 | 147.6 |
| C | 15 | 214 | 238206 | 1609.53 | 626 | 628 | 147.6 |
| C | 9 | 236 | 210735 | 1423.43 | 626 | 628 | 147.6 |
| D | 13 | 138 | 221350 | 1445.46 | 629 | 612 | 152.7 |
| D | 10 | 199 | 150625 | 982.33 | 629 | 612 | 152.7 |
| D | 1 | 52 | 69048 | 448.14 | 629 | 612 | 152.7 |
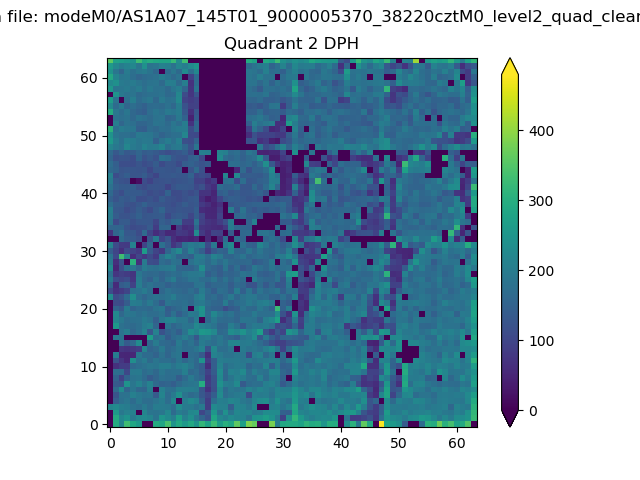
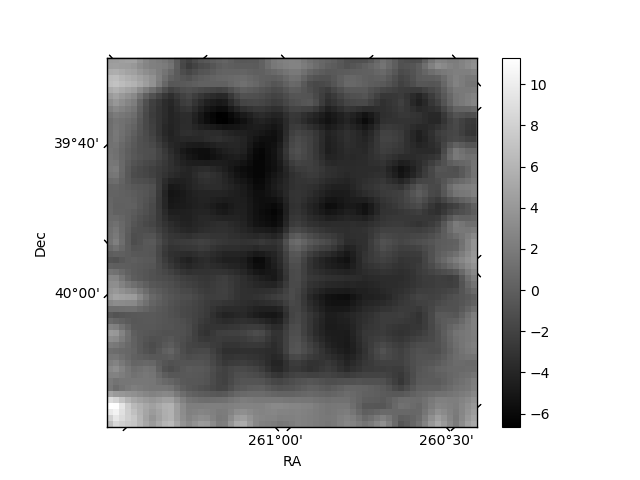
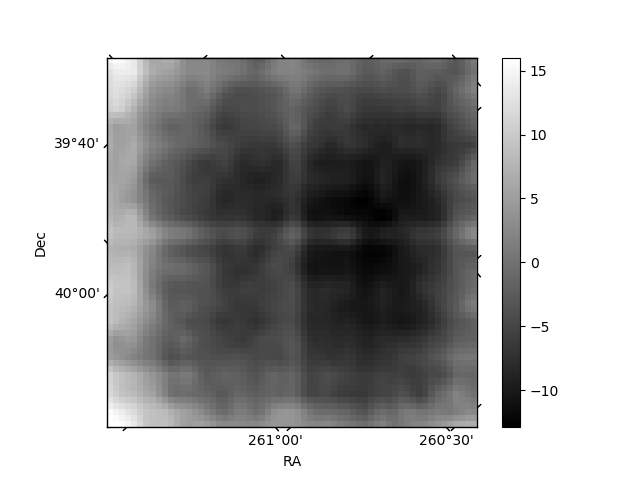
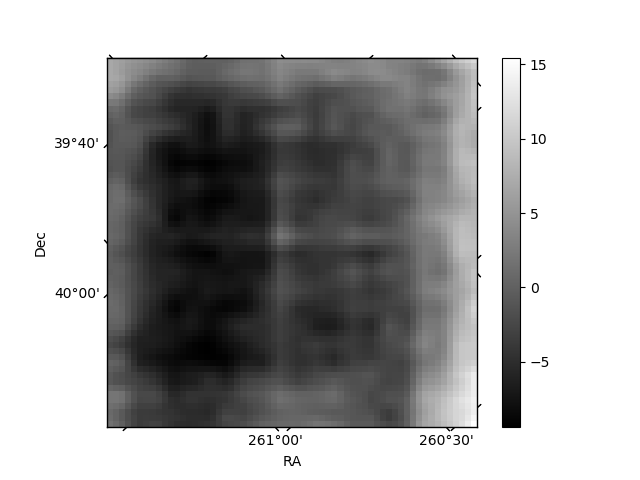
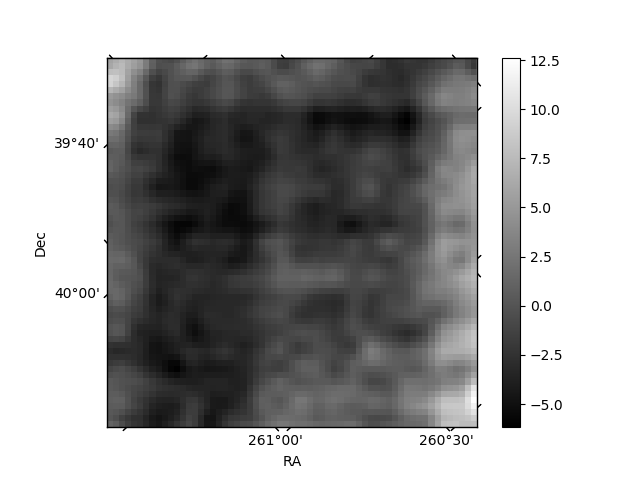
Histogram calculated using DETX and DETY for each event in the final _common_clean file
| Quadrant A | 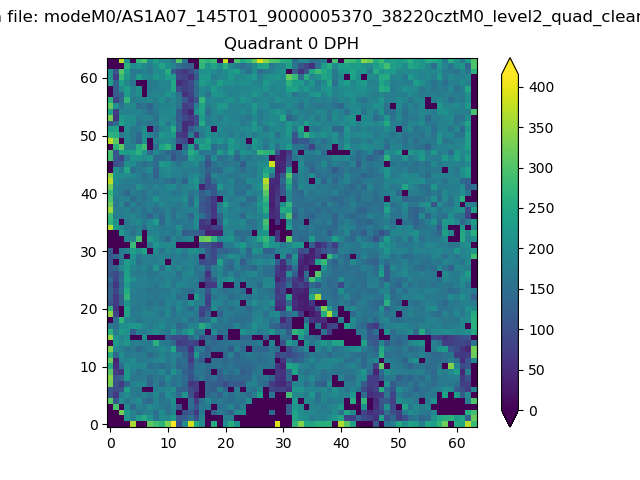 |
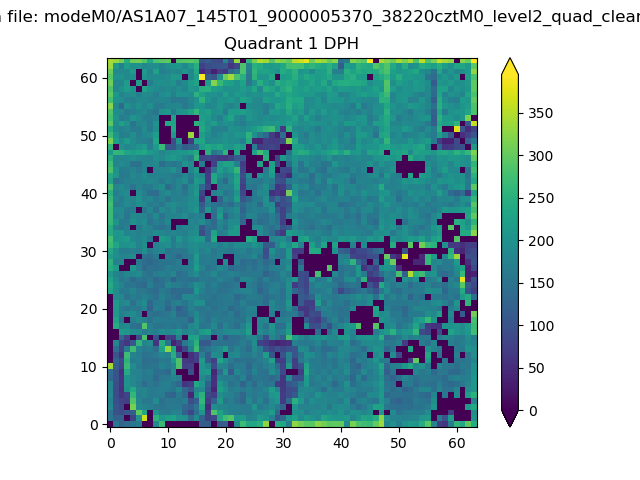 |
Quadrant B |
|---|---|---|---|
| Quadrant D | 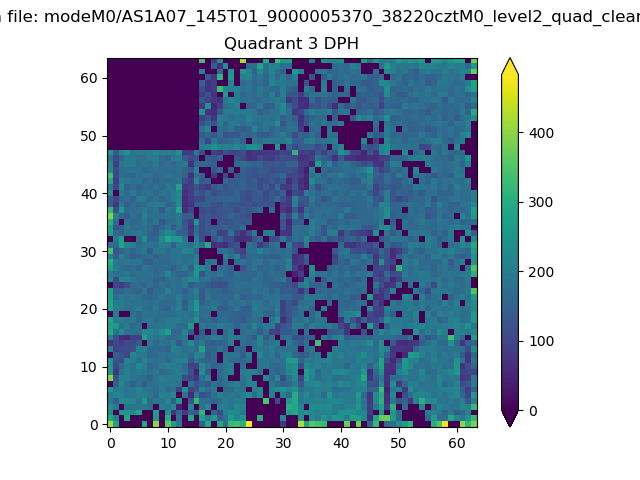 |
 |
Quadrant C |
| Plot type | Count rate plots | Images |
|---|---|---|
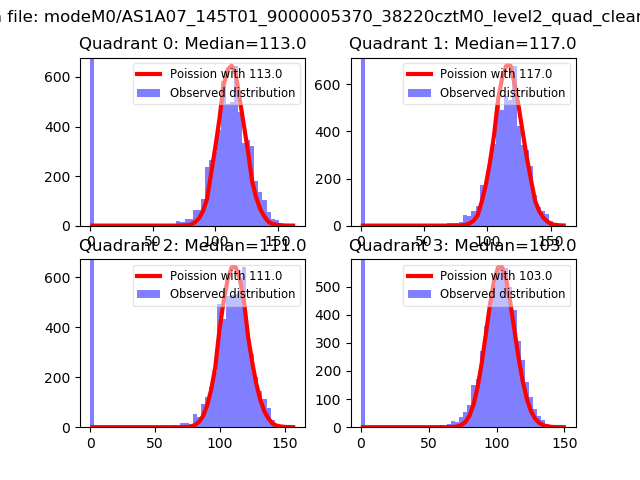
| Comparison with Poisson distribution Blue bars denote a histogram of data divided into 1 sec bins. Red curve is a Poisson curve with rate = median count rate of data. |
 |
 |
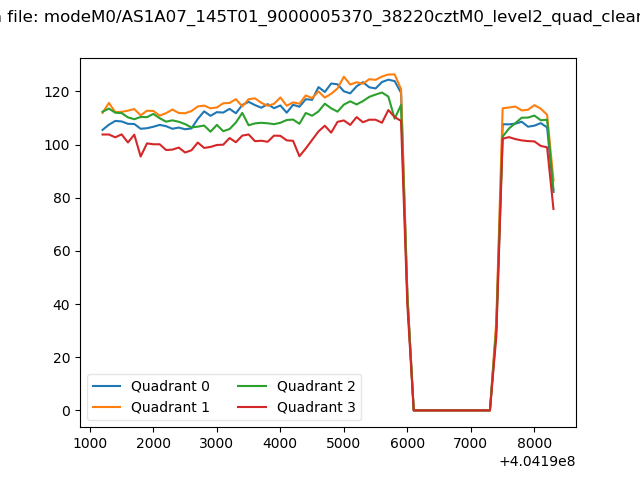
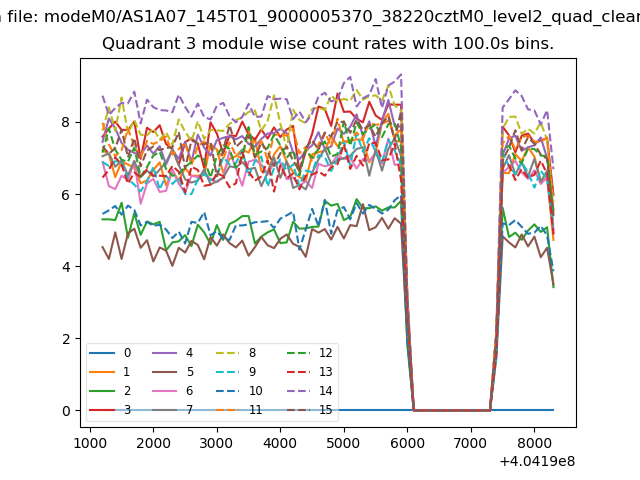
| Quadrant-wise count rates Data is divided into 100 sec bins |
 |
|
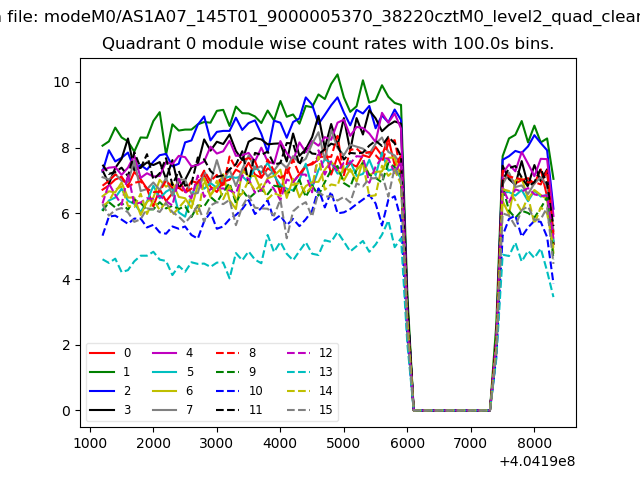
| Module-wise count rates for Quadrant A Data is divided into 100 sec bins |
 |
 |
| Module-wise count rates for Quadrant B Data is divided into 100 sec bins |
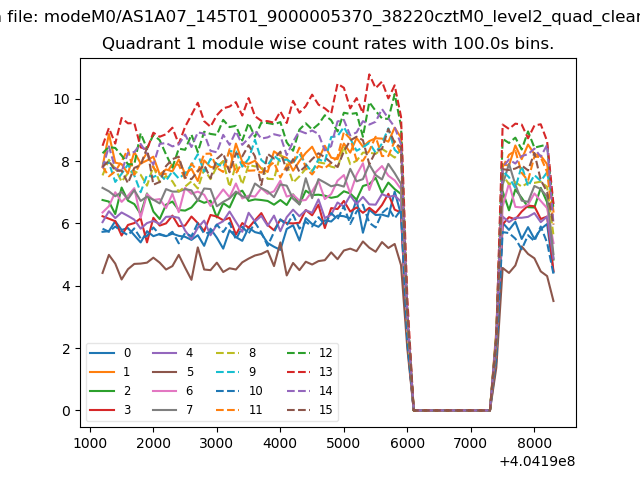 |
 |
| Module-wise count rates for Quadrant C Data is divided into 100 sec bins |
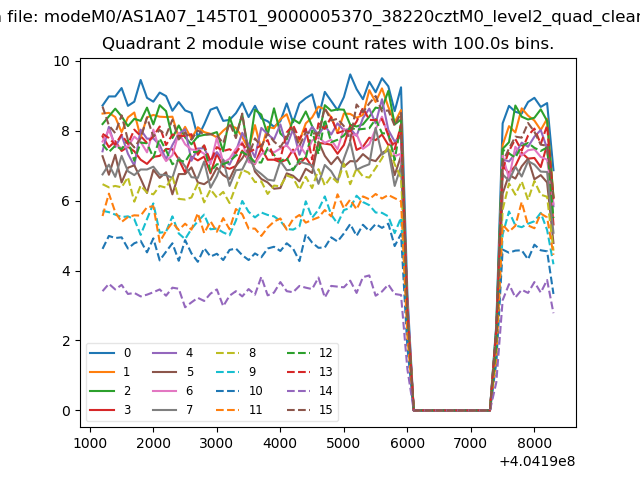 |
 |
| Module-wise count rates for Quadrant D Data is divided into 100 sec bins |
 |
 |
| Parameter | Plot |
|---|---|
| CZT HV Monitor | 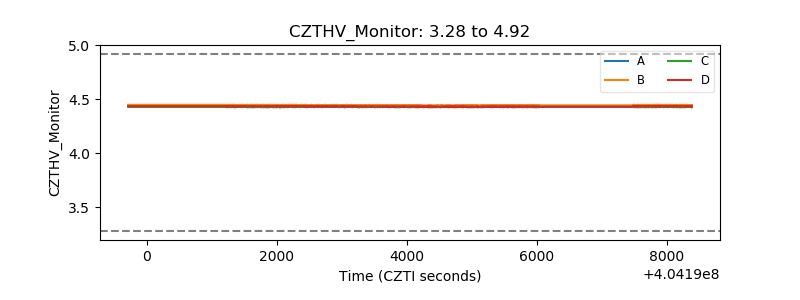 |
| D_VDD | 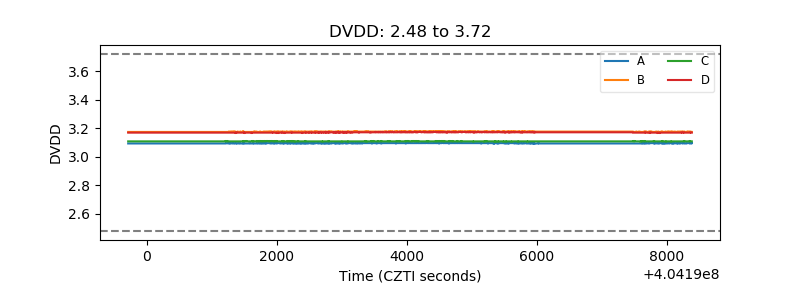 |
| Temperature 1 | 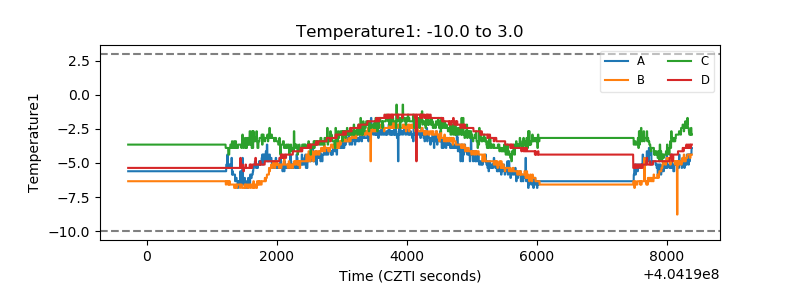 |
| Veto HV Monitor | 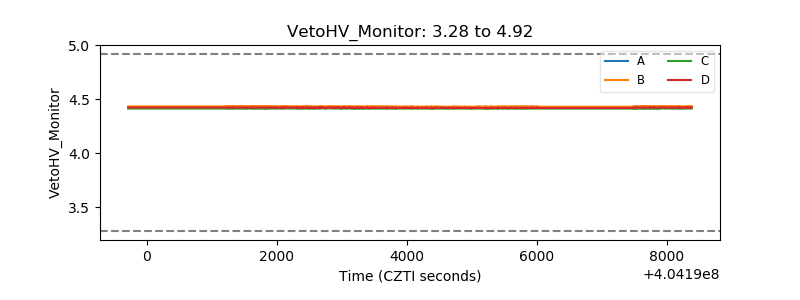 |
| Veto LLD | 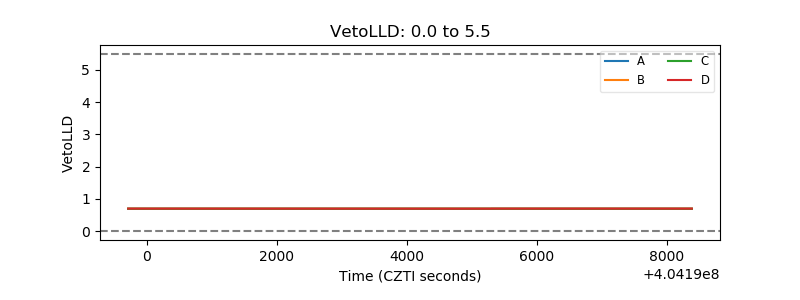 |
| Alpha Counter | 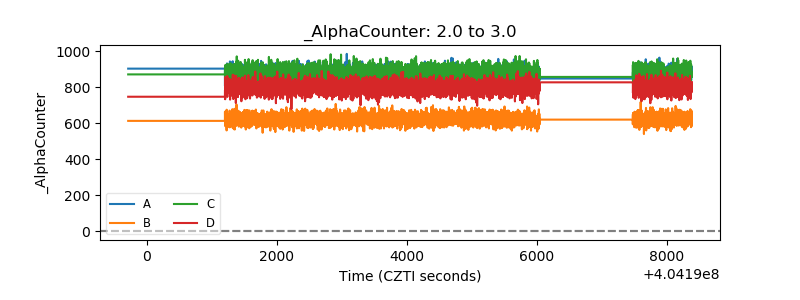 |
| _CPM_Rate | 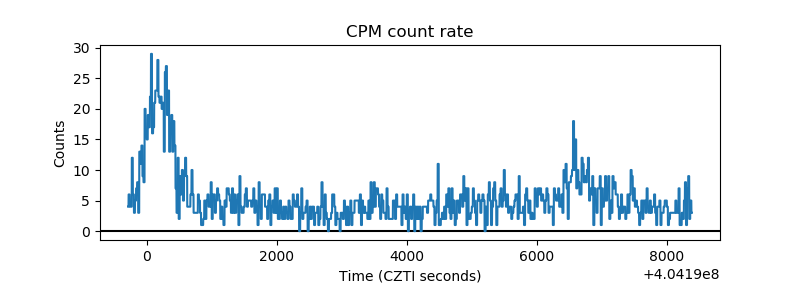 |
| CZT Counter | 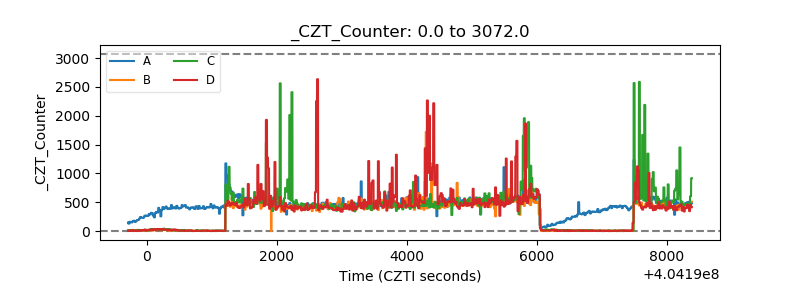 |
| +2.5 Volts monitor |  |
| +5 Volts monitor | 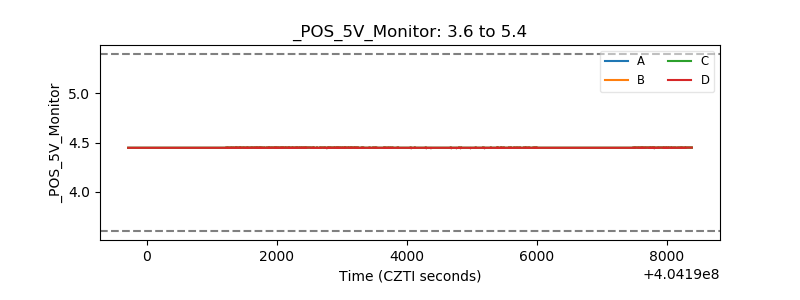 |
| _ROLL_ROT | 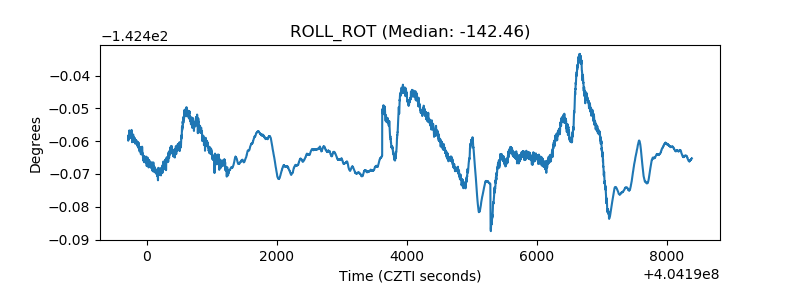 |
| _Roll_DEC | 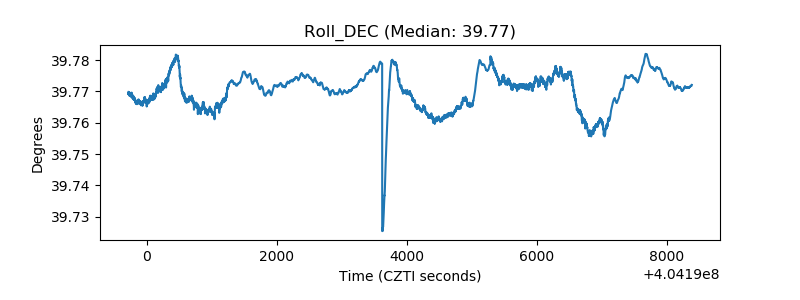 |
| _Roll_RA | 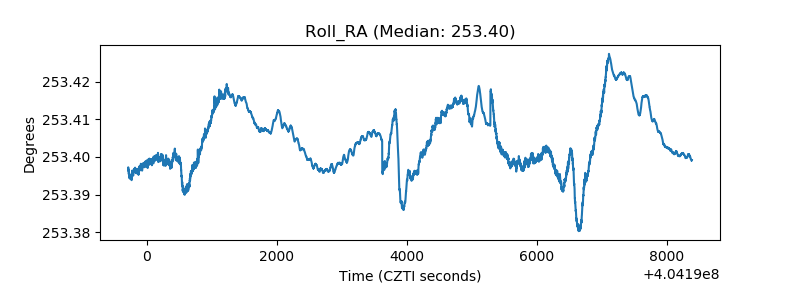 |
| Veto Counter | 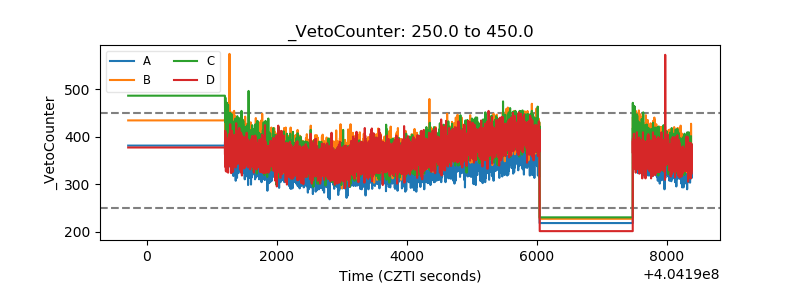 |