| Param | Original file | Final file |
|---|---|---|
| Filename | modeM0/AS1A07_145T01_9000005370_38221cztM0_level2.fits | modeM0/AS1A07_145T01_9000005370_38221cztM0_level2_quad_clean.evt |
| Size (bytes) | 349,744,320 | 100,013,760 |
| Size | 333.5 MB | 95.4 MB |
| Events in quadrant A | 3,054,301 | 671,306 |
| Events in quadrant B | 2,868,668 | 688,581 |
| Events in quadrant C | 3,394,584 | 650,756 |
| Events in quadrant D | 3,167,051 | 603,123 |
| Mode M9 | |||
|---|---|---|---|
| Quadrant | BADHDUFLAG | Total packets | Discarded packets |
| A | 0 | 24 | 0 |
| B | 0 | 24 | 0 |
| C | 0 | 24 | 0 |
| D | 0 | 25 | 0 |
| Mode SS | |||
|---|---|---|---|
| Quadrant | BADHDUFLAG | Total packets | Discarded packets |
| A | 0 | 122 | 0 |
| B | 0 | 122 | 0 |
| C | 0 | 122 | 0 |
| D | 0 | 122 | 0 |
| Mode M0 | |||
|---|---|---|---|
| Quadrant | BADHDUFLAG | Total packets | Discarded packets |
| A | 0 | 12563 | 3 |
| B | 0 | 12402 | 2 |
| C | 0 | 13743 | 2 |
| D | 0 | 13370 | 2 |
| Quadrant | Total seconds | Saturated seconds | Saturation percentage |
|---|---|---|---|
| A | 5930 | 17 | 0.286678% |
| B | 5930 | 16 | 0.269815% |
| C | 5930 | 49 | 0.826307% |
| D | 5930 | 80 | 1.349073% |
Noise dominated data is calculated using 1-second bins in cleaned event files. If a bin has >2000 counts, and if more than 50% of those come from <1% of pixels, then it is considered to be noise-dominated and hence unusable.
| Quadrant | # 1 sec bins | Bins with >0 counts | Bins with >2000 counts | High rate bins dominated by noise | Noise dominated (total time) | Noise dominated (detector-on time) | Marked lightcurve |
|---|---|---|---|---|---|---|---|
| A | 7213 | 5931 | 3 | 3 | 0.04% | 0.05% | 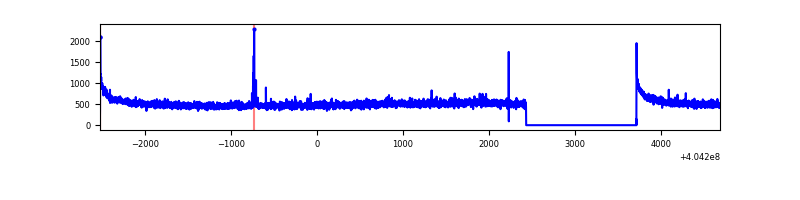 |
| B | 7213 | 5930 | 7 | 7 | 0.10% | 0.12% | 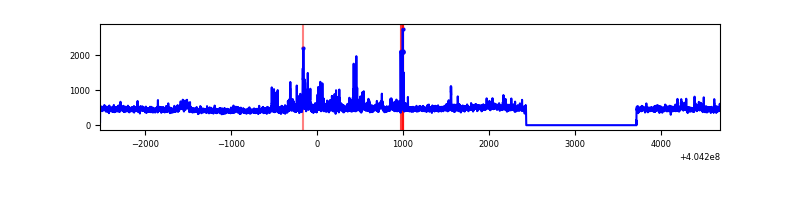 |
| C | 7213 | 5930 | 48 | 48 | 0.67% | 0.81% | 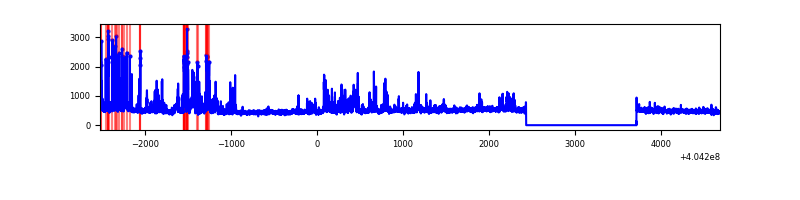 |
| D | 7213 | 5931 | 72 | 72 | 1.00% | 1.21% | 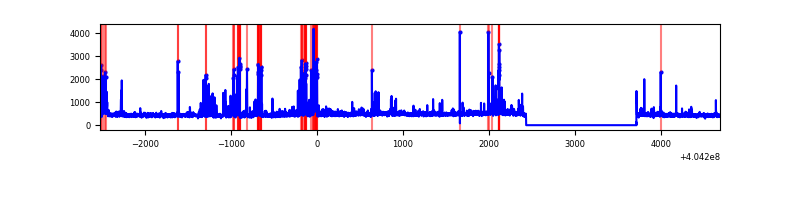 |
Top three noisy pixels from each quadrant. If the there are fewer than three noisy pixels in the level2.evt file, extra rows are filled as -1
| Pixel properties | Quadrant properties | ||||||
|---|---|---|---|---|---|---|---|
| Quadrant | DetID | PixID | Counts | Sigma | Mean | Median | Sigma |
| A | 10 | 83 | 408811 | 2995.9 | 668 | 654 | 136.2 |
| A | 12 | 189 | 39412 | 284.49 | 668 | 654 | 136.2 |
| A | 7 | 3 | 16619 | 117.18 | 668 | 654 | 136.2 |
| B | 0 | 183 | 106040 | 805.77 | 664 | 644 | 130.8 |
| B | 0 | 229 | 78800 | 597.52 | 664 | 644 | 130.8 |
| B | 5 | 172 | 49647 | 374.64 | 664 | 644 | 130.8 |
| C | 3 | 9 | 450874 | 2980.99 | 646 | 651 | 151.0 |
| C | 15 | 214 | 245171 | 1619.0 | 646 | 651 | 151.0 |
| C | 9 | 236 | 119546 | 787.22 | 646 | 651 | 151.0 |
| D | 7 | 55 | 162236 | 1016.73 | 647 | 630 | 158.9 |
| D | 13 | 138 | 161172 | 1010.03 | 647 | 630 | 158.9 |
| D | 13 | 249 | 113176 | 708.07 | 647 | 630 | 158.9 |
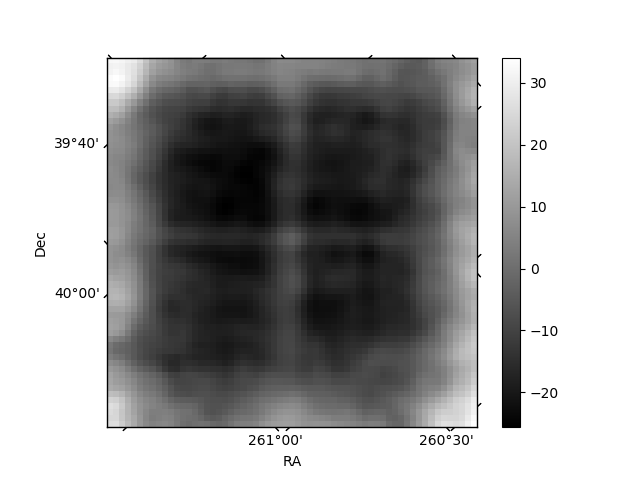
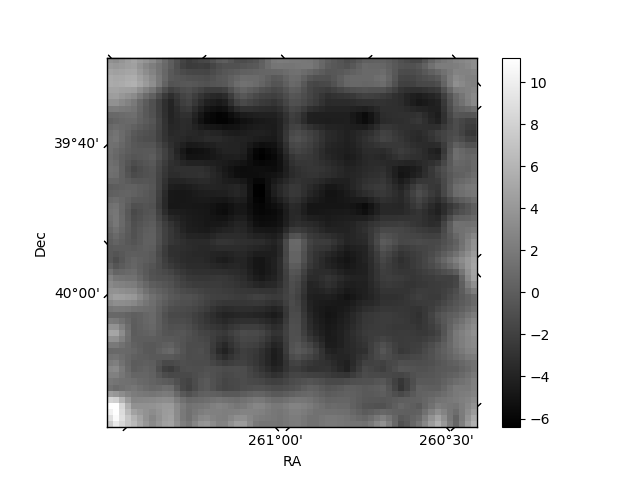
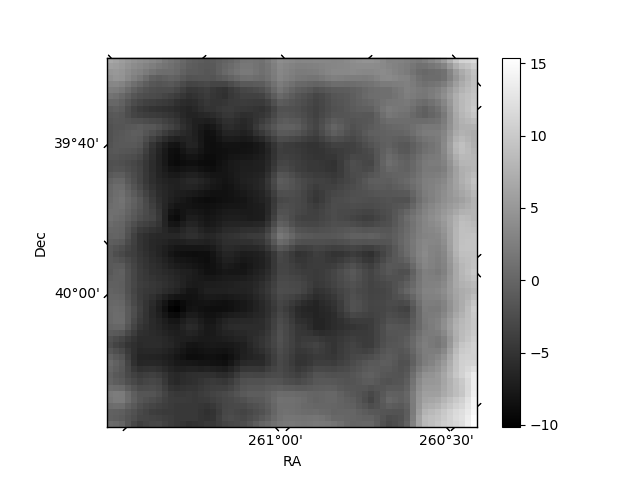
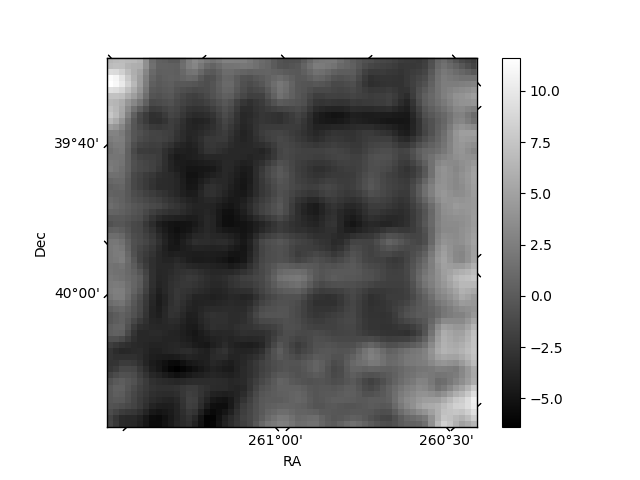
Histogram calculated using DETX and DETY for each event in the final _common_clean file
| Quadrant A | 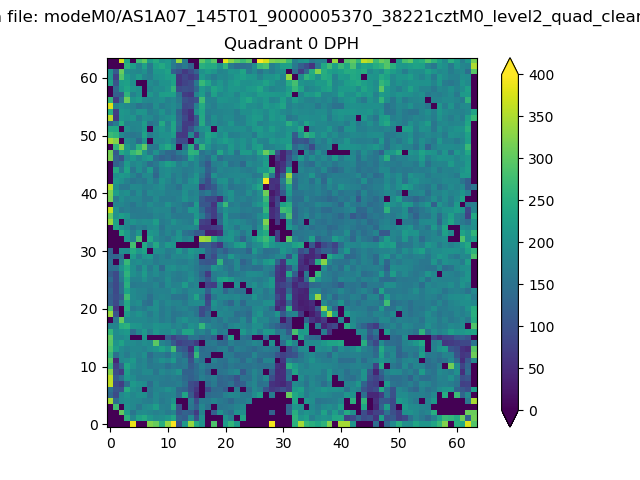 |
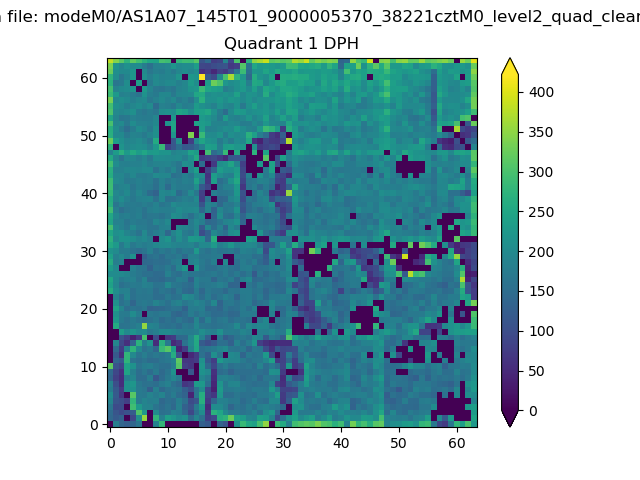 |
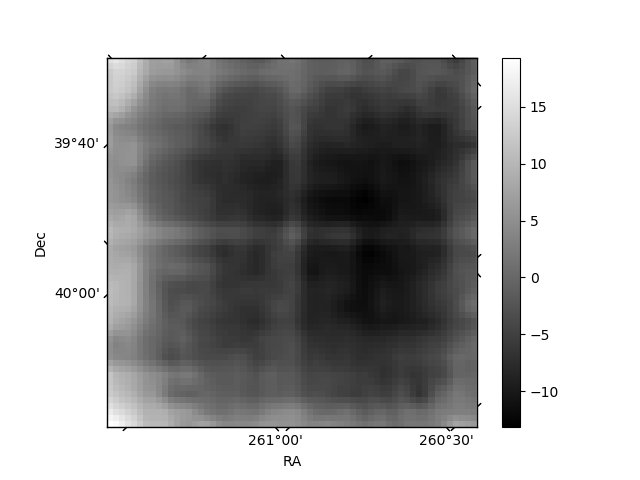
Quadrant B |
|---|---|---|---|
| Quadrant D | 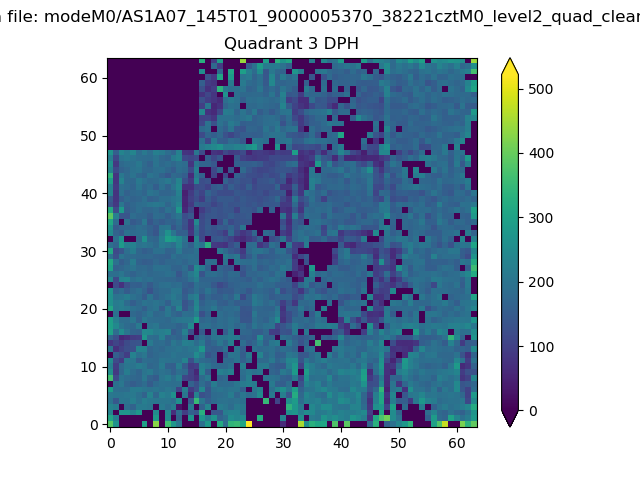 |
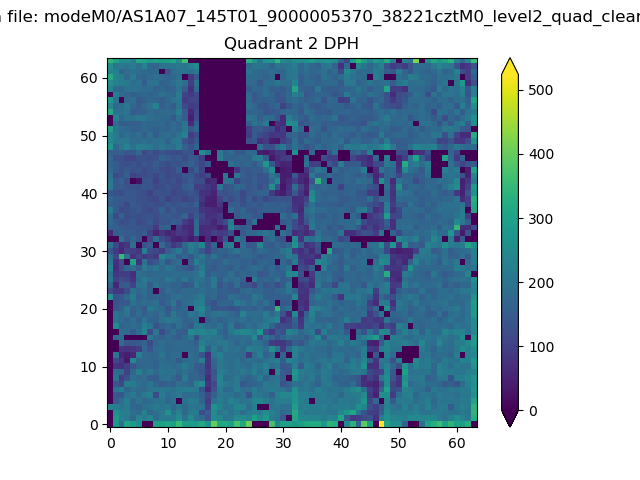 |
Quadrant C |
| Plot type | Count rate plots | Images |
|---|---|---|
| Comparison with Poisson distribution Blue bars denote a histogram of data divided into 1 sec bins. Red curve is a Poisson curve with rate = median count rate of data. |
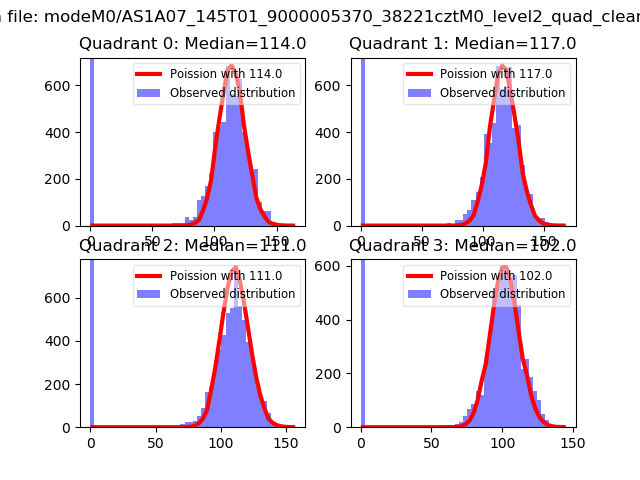 |
 |
| Quadrant-wise count rates Data is divided into 100 sec bins |
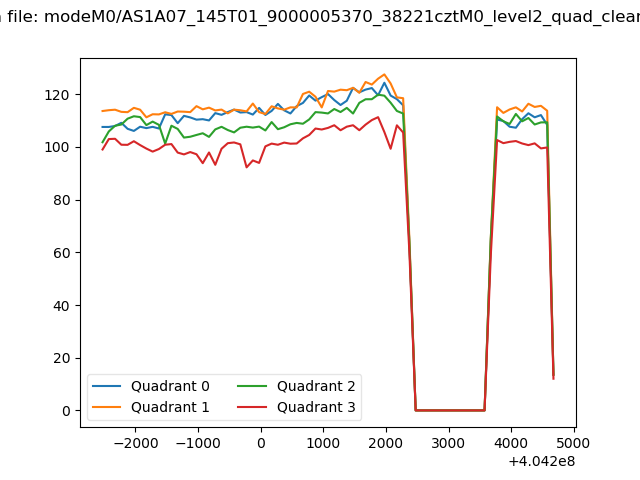 |
|
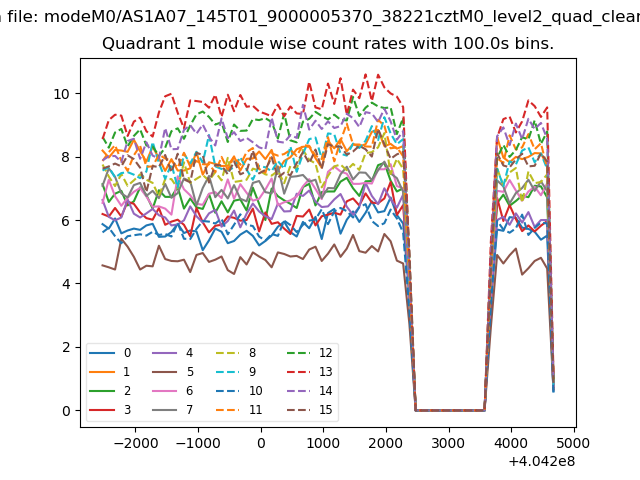
| Module-wise count rates for Quadrant A Data is divided into 100 sec bins |
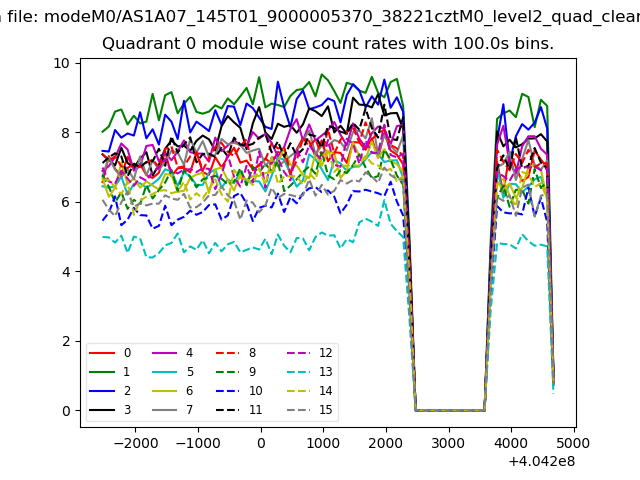 |
 |
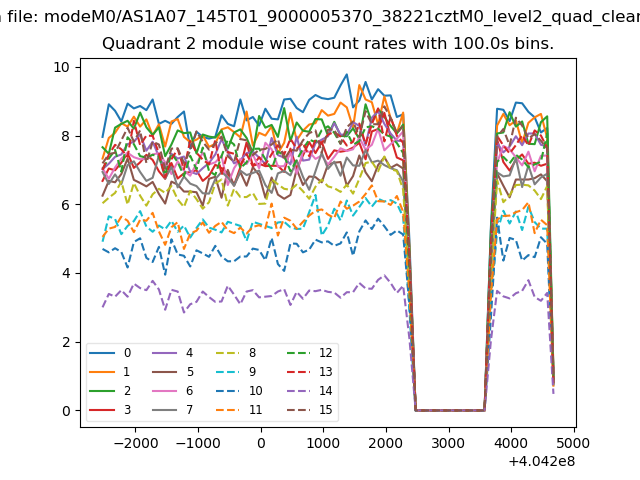
| Module-wise count rates for Quadrant B Data is divided into 100 sec bins |
 |
 |
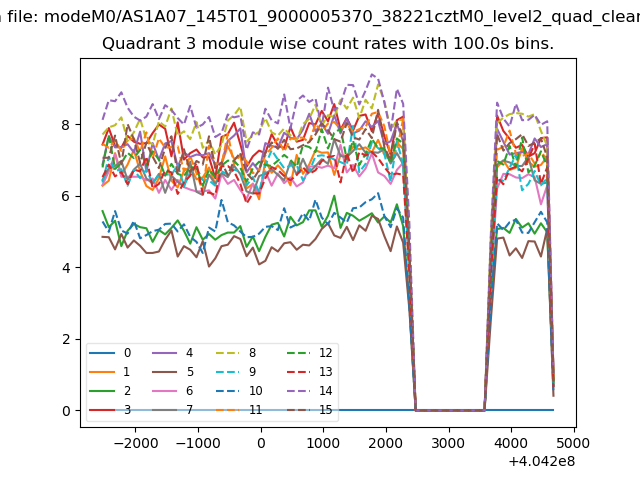
| Module-wise count rates for Quadrant C Data is divided into 100 sec bins |
 |
 |
| Module-wise count rates for Quadrant D Data is divided into 100 sec bins |
 |
 |
| Parameter | Plot |
|---|---|
| CZT HV Monitor | 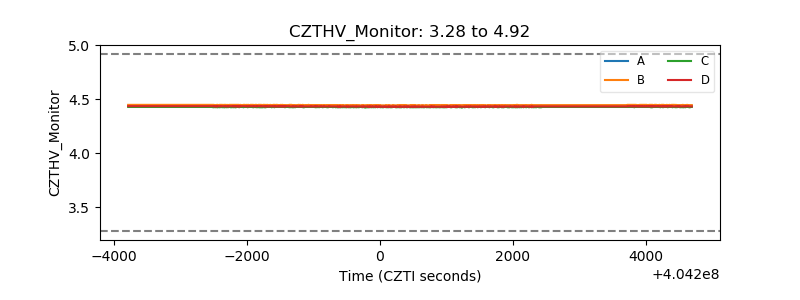 |
| D_VDD | 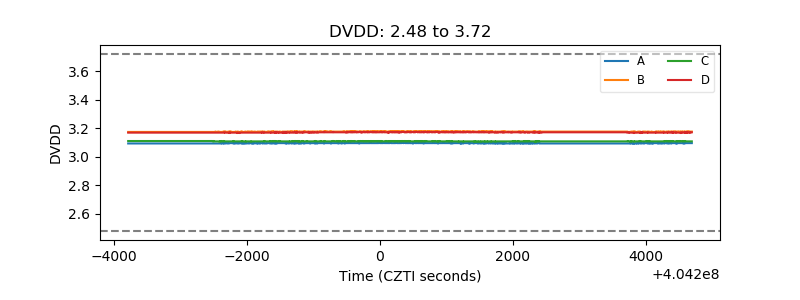 |
| Temperature 1 | 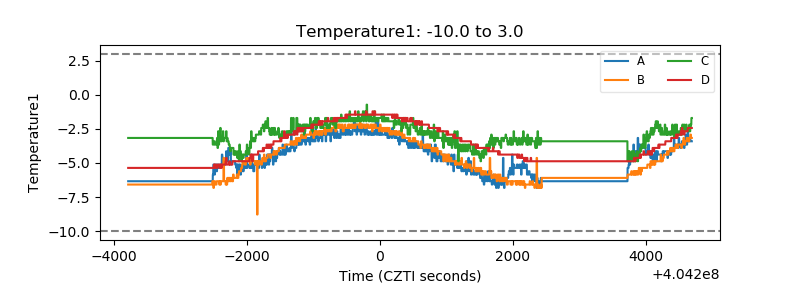 |
| Veto HV Monitor | 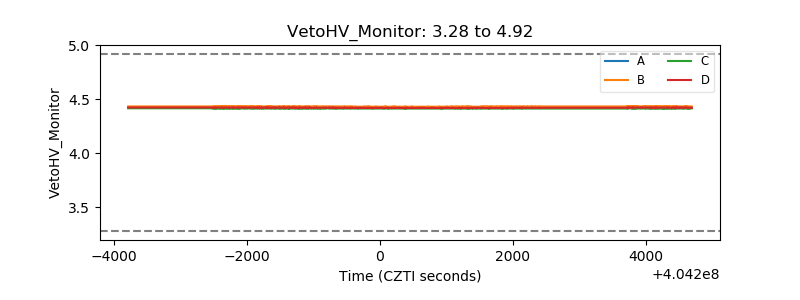 |
| Veto LLD | 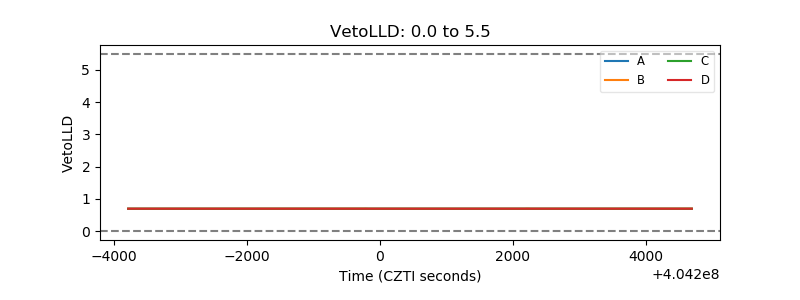 |
| Alpha Counter | 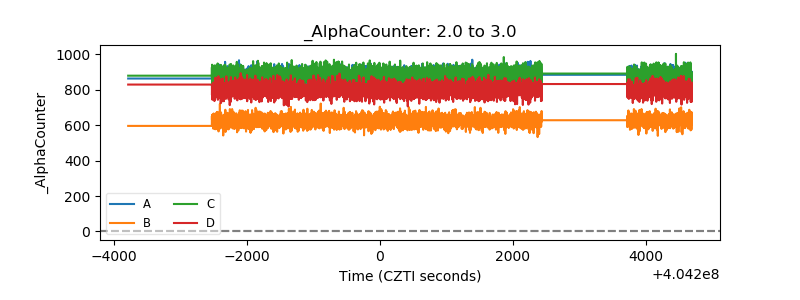 |
| _CPM_Rate | 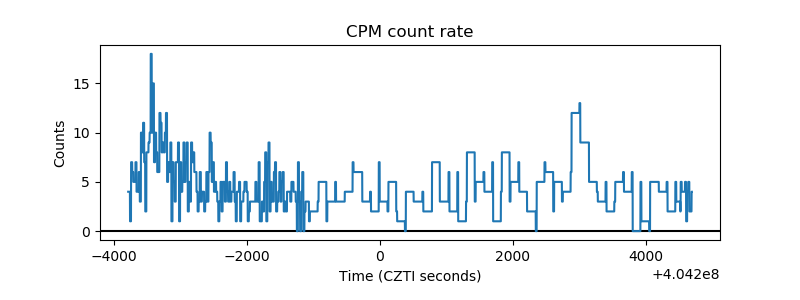 |
| CZT Counter | 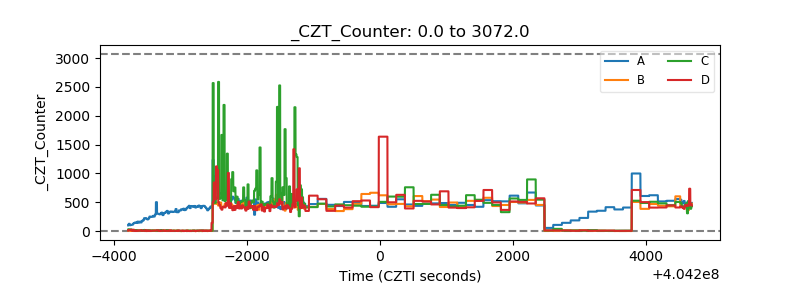 |
| +2.5 Volts monitor | 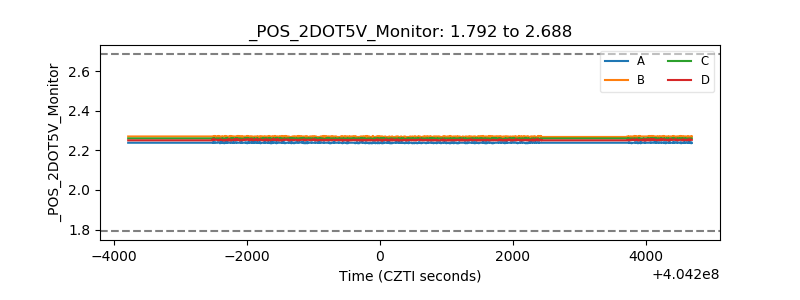 |
| +5 Volts monitor | 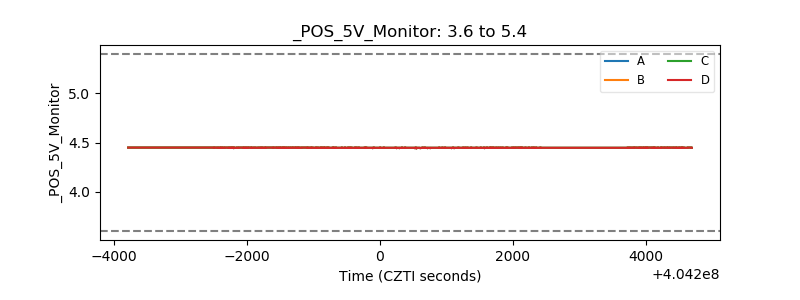 |
| _ROLL_ROT | 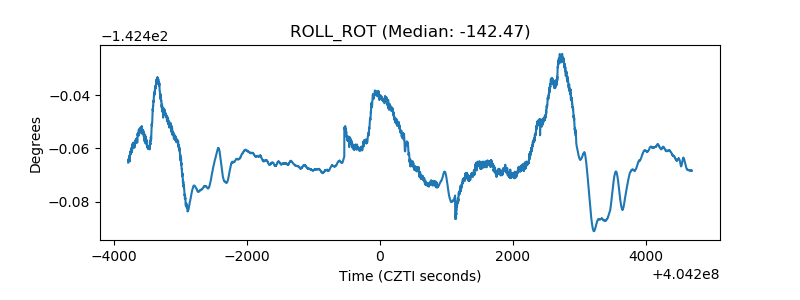 |
| _Roll_DEC | 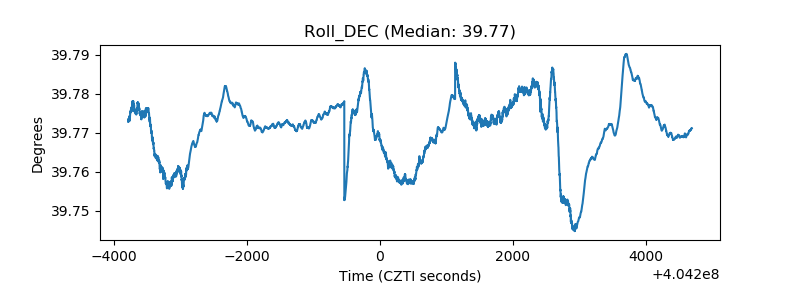 |
| _Roll_RA | 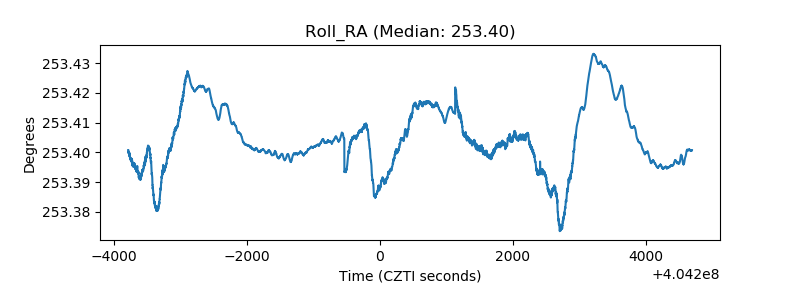 |
| Veto Counter | 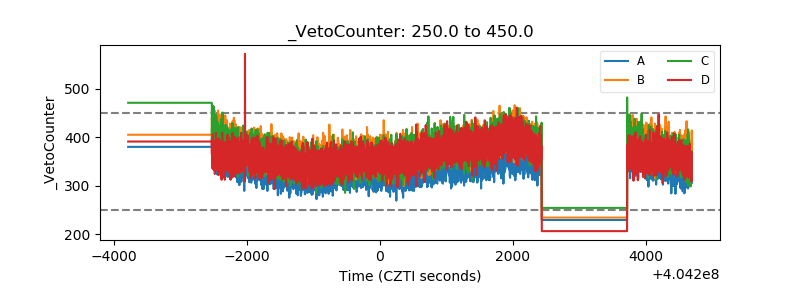 |