| Param | Original file | Final file |
|---|---|---|
| Filename | modeM0/AS1A07_145T01_9000005370_38224cztM0_level2.fits | modeM0/AS1A07_145T01_9000005370_38224cztM0_level2_quad_clean.evt |
| Size (bytes) | 990,610,560 | 250,309,440 |
| Size | 944.7 MB | 238.7 MB |
| Events in quadrant A | 7,967,304 | 1,711,150 |
| Events in quadrant B | 9,063,692 | 1,724,078 |
| Events in quadrant C | 7,883,079 | 1,643,058 |
| Events in quadrant D | 10,558,318 | 1,434,468 |
| Mode M9 | |||
|---|---|---|---|
| Quadrant | BADHDUFLAG | Total packets | Discarded packets |
| A | 0 | 42 | 0 |
| B | 0 | 42 | 0 |
| C | 0 | 42 | 0 |
| D | 0 | 42 | 0 |
| Mode SS | |||
|---|---|---|---|
| Quadrant | BADHDUFLAG | Total packets | Discarded packets |
| A | 0 | 314 | 0 |
| B | 0 | 314 | 0 |
| C | 0 | 314 | 0 |
| D | 0 | 314 | 0 |
| Mode M0 | |||
|---|---|---|---|
| Quadrant | BADHDUFLAG | Total packets | Discarded packets |
| A | 0 | 32837 | 4 |
| B | 0 | 37299 | 3 |
| C | 0 | 33170 | 3 |
| D | 0 | 41620 | 3 |
| Quadrant | Total seconds | Saturated seconds | Saturation percentage |
|---|---|---|---|
| A | 15450 | 43 | 0.278317% |
| B | 15450 | 312 | 2.019417% |
| C | 15450 | 124 | 0.802589% |
| D | 15450 | 1080 | 6.990291% |
Noise dominated data is calculated using 1-second bins in cleaned event files. If a bin has >2000 counts, and if more than 50% of those come from <1% of pixels, then it is considered to be noise-dominated and hence unusable.
| Quadrant | # 1 sec bins | Bins with >0 counts | Bins with >2000 counts | High rate bins dominated by noise | Noise dominated (total time) | Noise dominated (detector-on time) | Marked lightcurve |
|---|---|---|---|---|---|---|---|
| A | 19601 | 15453 | 14 | 14 | 0.07% | 0.09% | 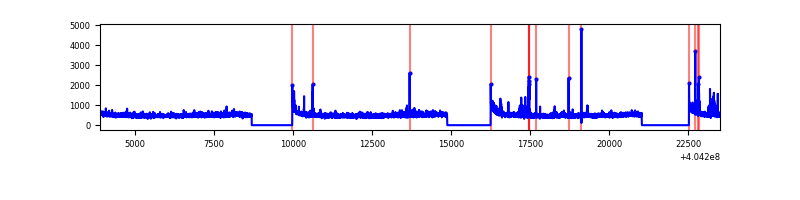 |
| B | 19601 | 15453 | 251 | 251 | 1.28% | 1.62% | 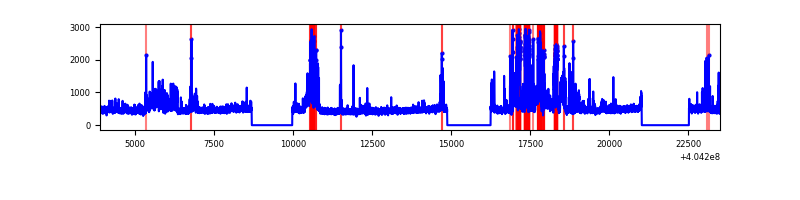 |
| C | 19601 | 15453 | 102 | 102 | 0.52% | 0.66% | 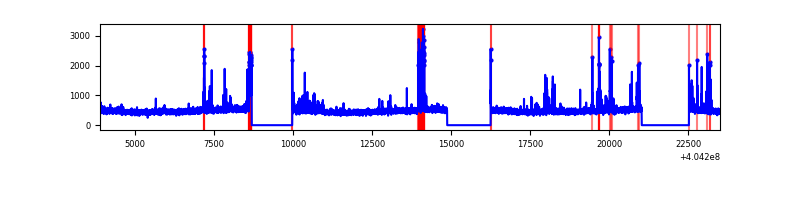 |
| D | 19601 | 15452 | 959 | 959 | 4.89% | 6.21% | 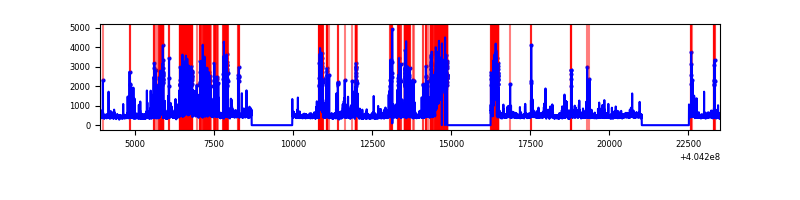 |
Top three noisy pixels from each quadrant. If the there are fewer than three noisy pixels in the level2.evt file, extra rows are filled as -1
| Pixel properties | Quadrant properties | ||||||
|---|---|---|---|---|---|---|---|
| Quadrant | DetID | PixID | Counts | Sigma | Mean | Median | Sigma |
| A | 10 | 83 | 934158 | 2695.49 | 1723 | 1686 | 345.9 |
| A | 12 | 189 | 132135 | 377.09 | 1723 | 1686 | 345.9 |
| A | 9 | 143 | 130299 | 371.78 | 1723 | 1686 | 345.9 |
| B | 0 | 183 | 2048315 | 6272.5 | 1707 | 1662 | 326.3 |
| B | 4 | 232 | 118013 | 356.59 | 1707 | 1662 | 326.3 |
| B | 5 | 172 | 68016 | 203.36 | 1707 | 1662 | 326.3 |
| C | 15 | 214 | 627659 | 1618.75 | 1674 | 1683 | 386.7 |
| C | 9 | 236 | 328960 | 846.32 | 1674 | 1683 | 386.7 |
| C | 3 | 9 | 226417 | 581.15 | 1674 | 1683 | 386.7 |
| D | 2 | 249 | 1909302 | 4869.16 | 1615 | 1572 | 391.8 |
| D | 12 | 227 | 1140095 | 2905.89 | 1615 | 1572 | 391.8 |
| D | 12 | 235 | 215621 | 546.32 | 1615 | 1572 | 391.8 |
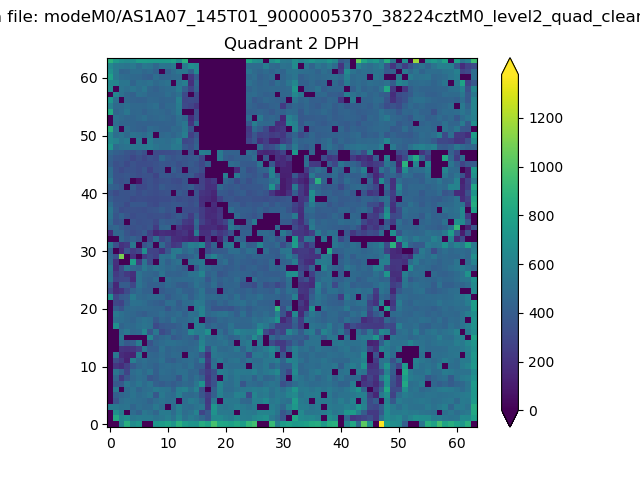
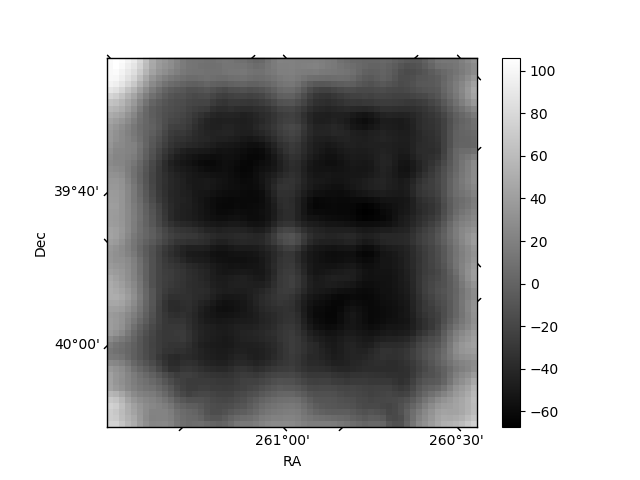
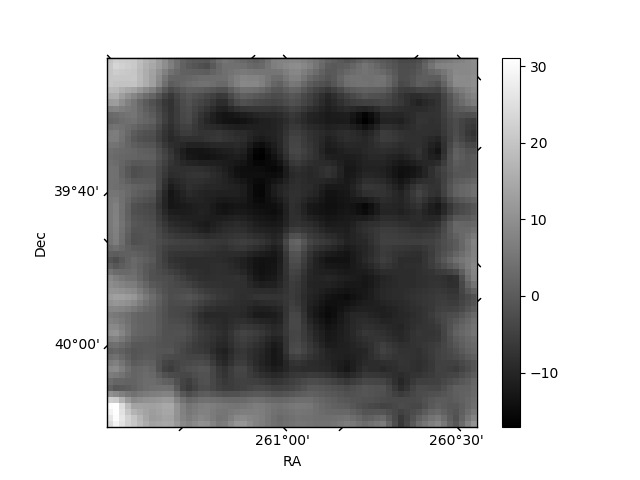
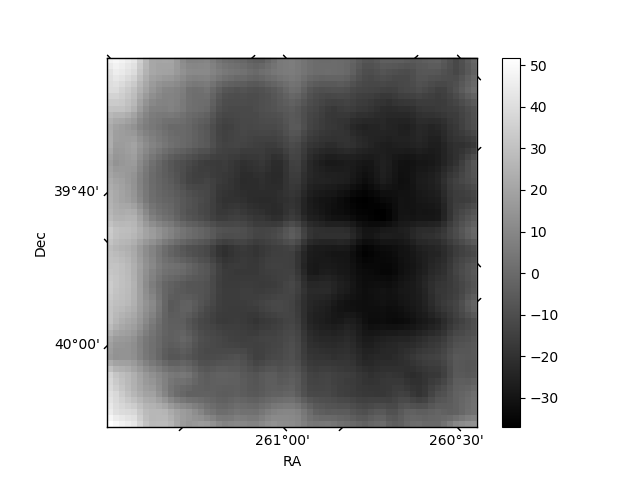
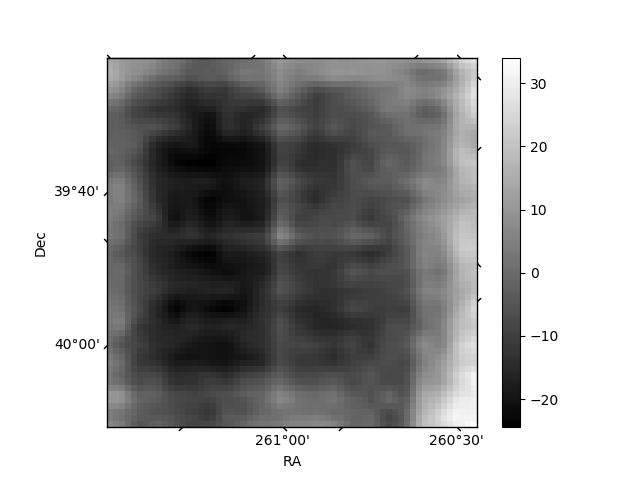
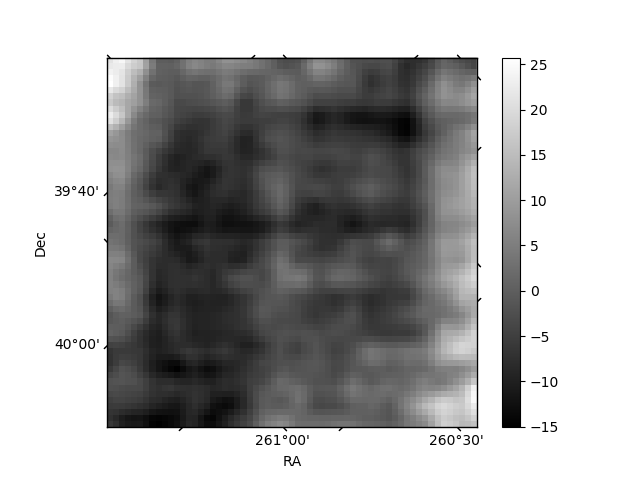
Histogram calculated using DETX and DETY for each event in the final _common_clean file
| Quadrant A | 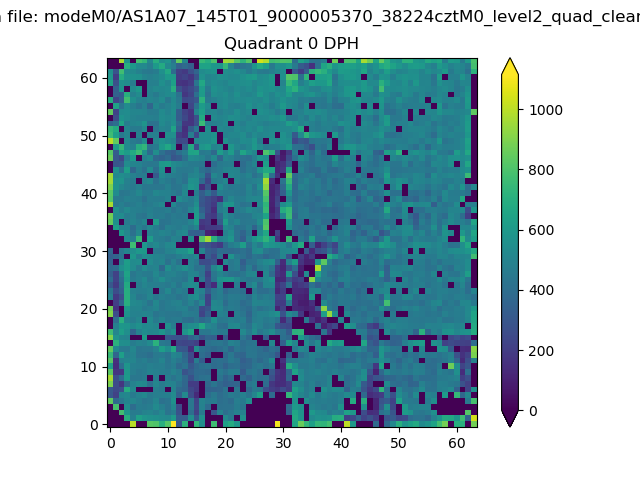 |
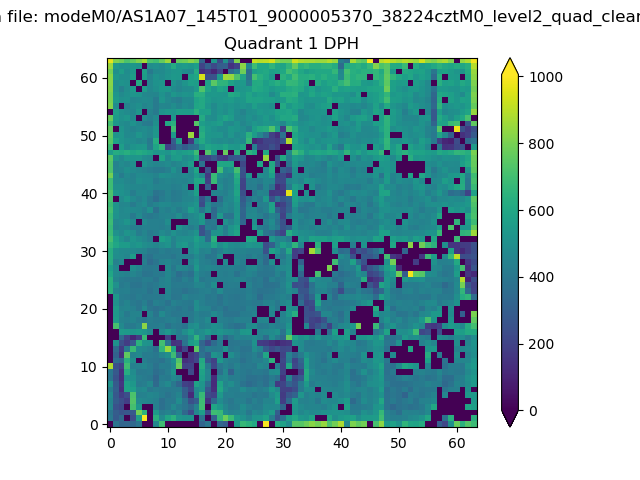 |
Quadrant B |
|---|---|---|---|
| Quadrant D | 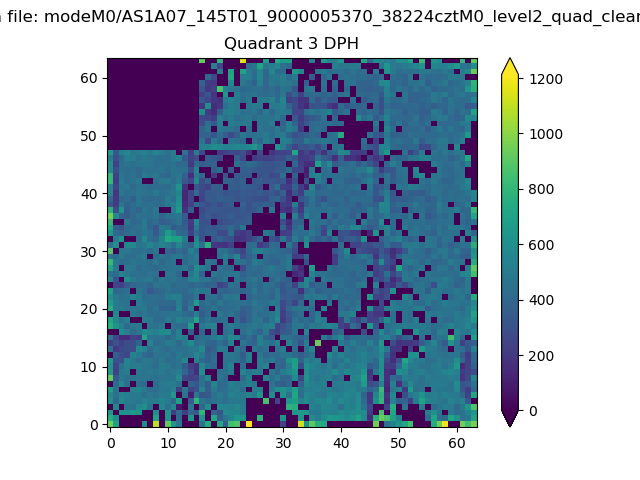 |
 |
Quadrant C |
| Plot type | Count rate plots | Images |
|---|---|---|
| Comparison with Poisson distribution Blue bars denote a histogram of data divided into 1 sec bins. Red curve is a Poisson curve with rate = median count rate of data. |
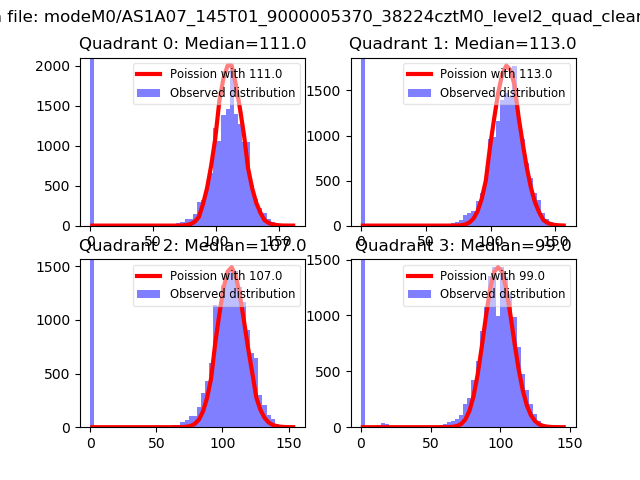 |
 |
| Quadrant-wise count rates Data is divided into 100 sec bins |
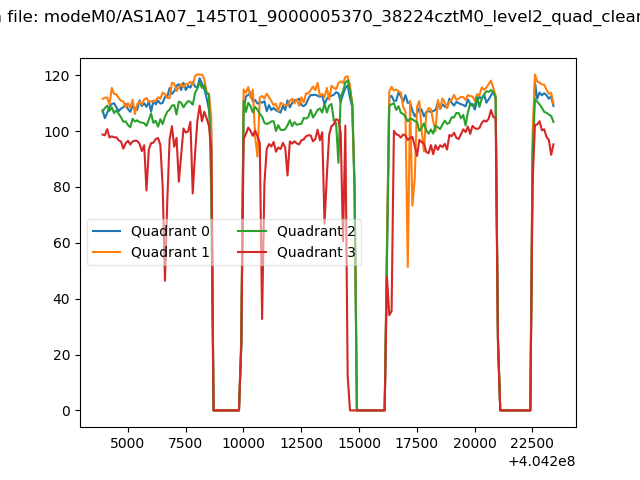 |
|
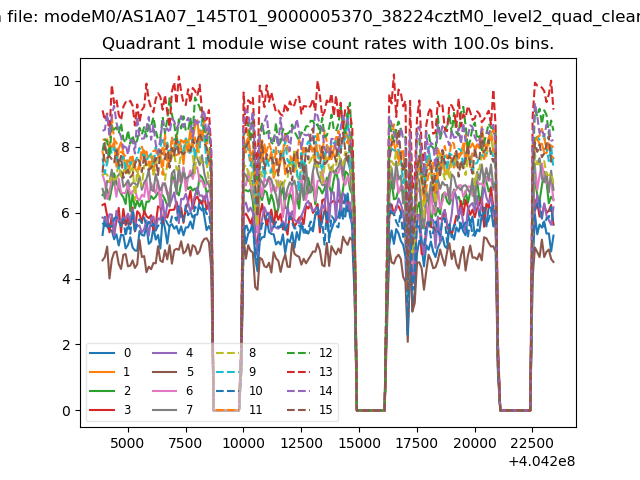
| Module-wise count rates for Quadrant A Data is divided into 100 sec bins |
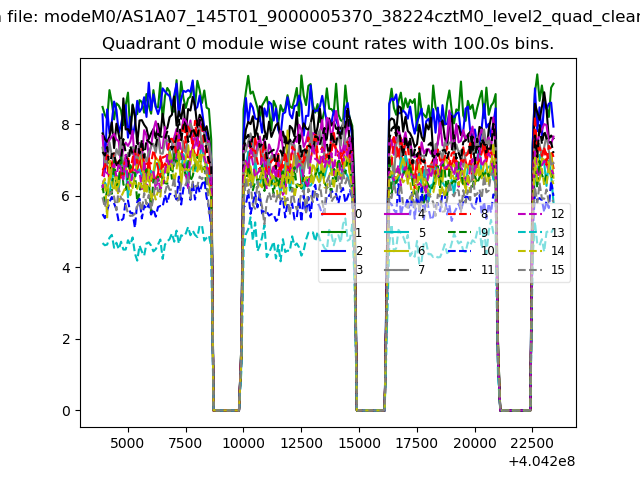 |
 |
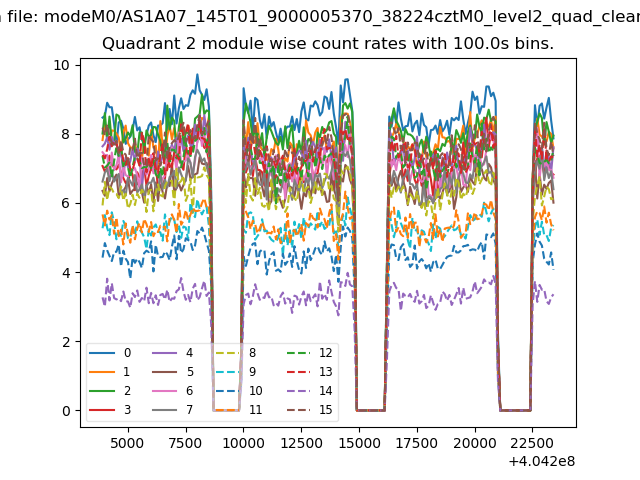
| Module-wise count rates for Quadrant B Data is divided into 100 sec bins |
 |
 |
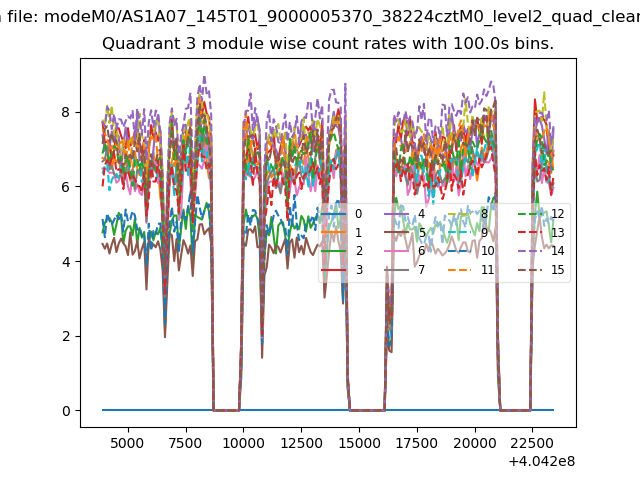
| Module-wise count rates for Quadrant C Data is divided into 100 sec bins |
 |
 |
| Module-wise count rates for Quadrant D Data is divided into 100 sec bins |
 |
 |
| Parameter | Plot |
|---|---|
| CZT HV Monitor | 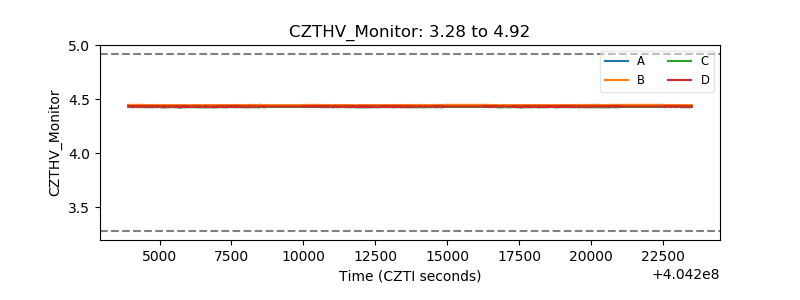 |
| D_VDD | 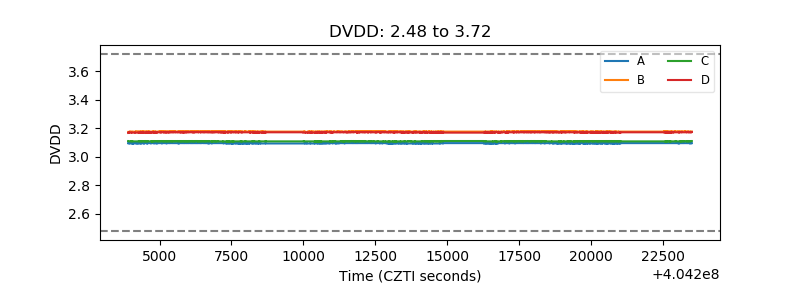 |
| Temperature 1 | 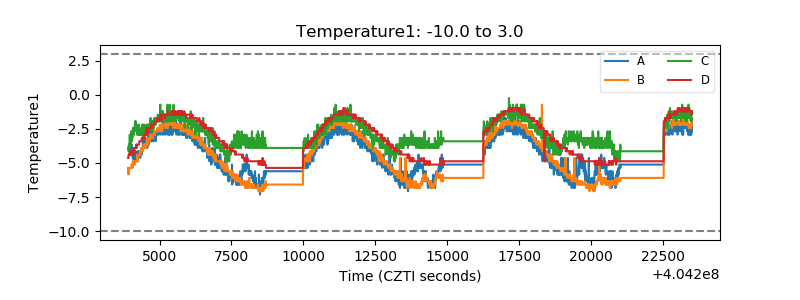 |
| Veto HV Monitor |  |
| Veto LLD | 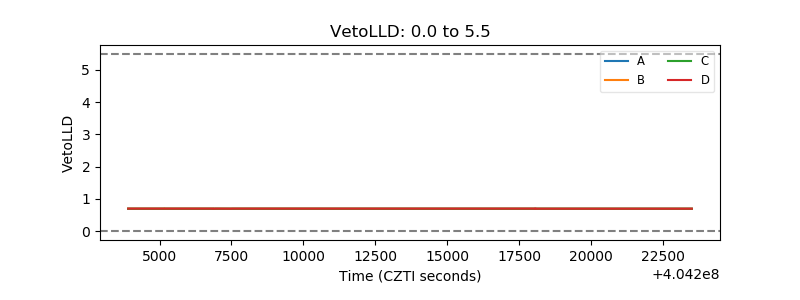 |
| Alpha Counter | 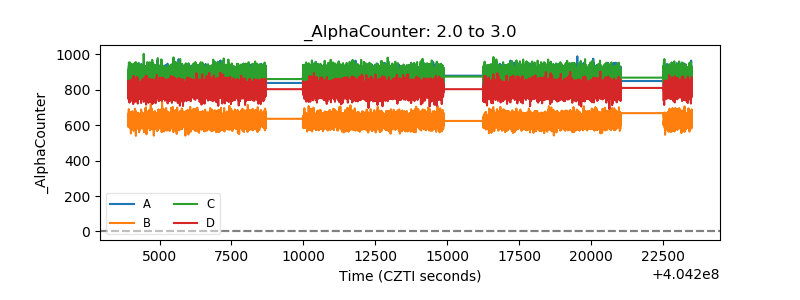 |
| _CPM_Rate | 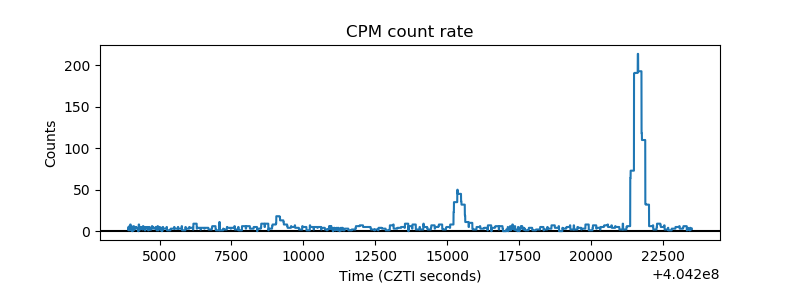 |
| CZT Counter | 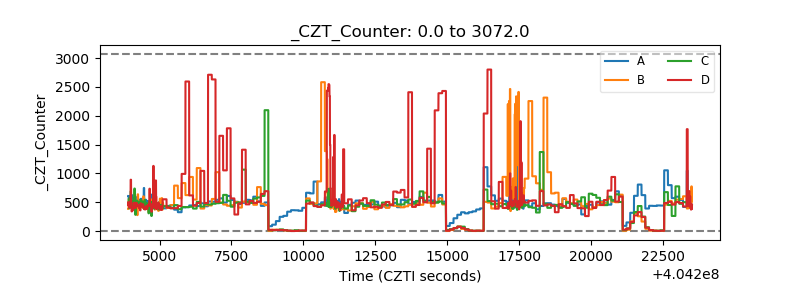 |
| +2.5 Volts monitor | 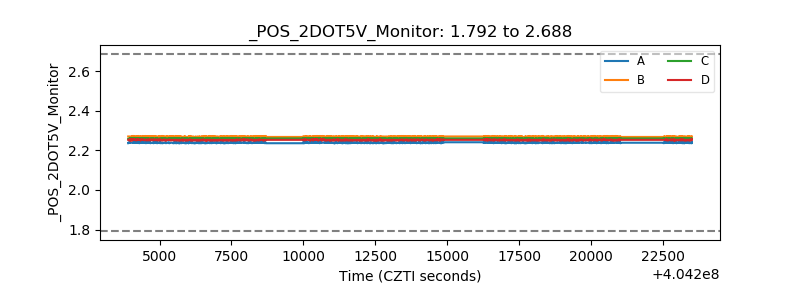 |
| +5 Volts monitor | 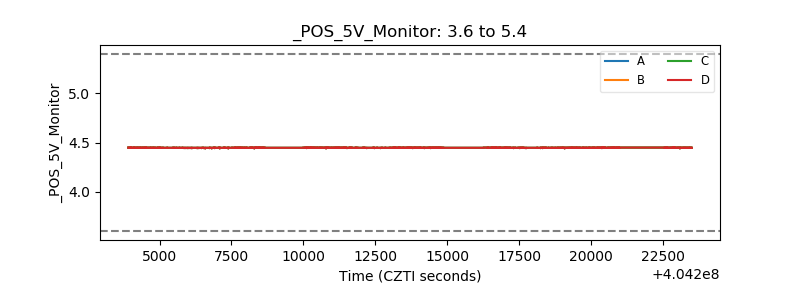 |
| _ROLL_ROT | 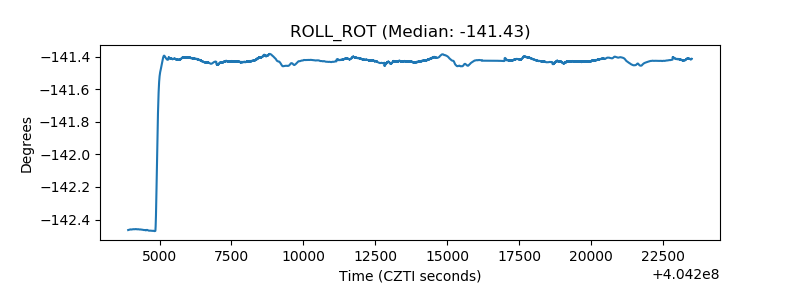 |
| _Roll_DEC | 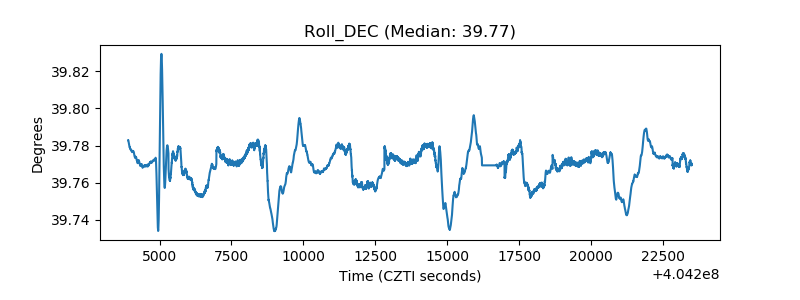 |
| _Roll_RA | 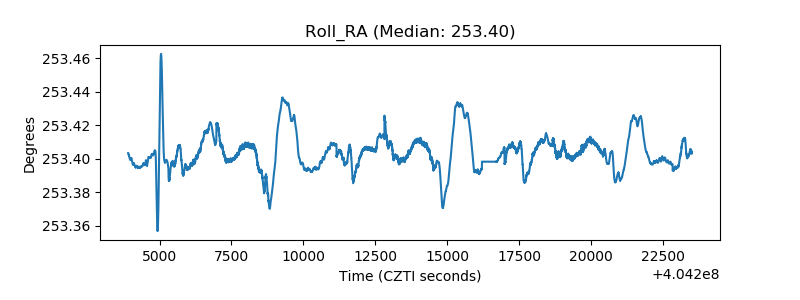 |
| Veto Counter | 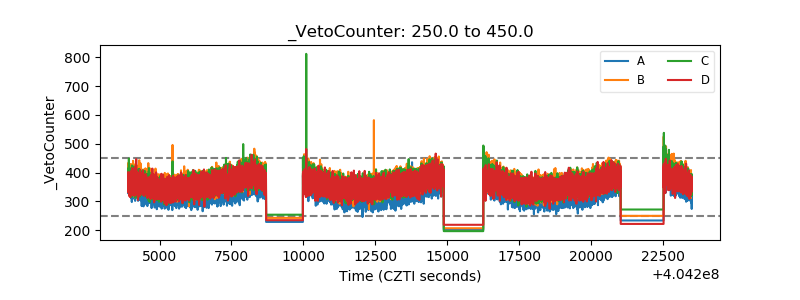 |