| Param | Original file | Final file |
|---|---|---|
| Filename | modeM0/AS1A07_145T01_9000005370_38227cztM0_level2.fits | modeM0/AS1A07_145T01_9000005370_38227cztM0_level2_quad_clean.evt |
| Size (bytes) | 333,682,560 | 94,651,200 |
| Size | 318.2 MB | 90.3 MB |
| Events in quadrant A | 2,882,472 | 639,212 |
| Events in quadrant B | 3,007,126 | 642,052 |
| Events in quadrant C | 2,807,333 | 621,602 |
| Events in quadrant D | 3,226,387 | 578,339 |
| Mode M9 | |||
|---|---|---|---|
| Quadrant | BADHDUFLAG | Total packets | Discarded packets |
| A | 0 | 17 | 0 |
| B | 0 | 17 | 0 |
| C | 0 | 17 | 0 |
| D | 0 | 17 | 0 |
| Mode SS | |||
|---|---|---|---|
| Quadrant | BADHDUFLAG | Total packets | Discarded packets |
| A | 0 | 112 | 0 |
| B | 0 | 112 | 0 |
| C | 0 | 112 | 0 |
| D | 0 | 112 | 0 |
| Mode M0 | |||
|---|---|---|---|
| Quadrant | BADHDUFLAG | Total packets | Discarded packets |
| A | 0 | 11858 | 2 |
| B | 0 | 12635 | 1 |
| C | 0 | 11731 | 1 |
| D | 0 | 13297 | 1 |
| Quadrant | Total seconds | Saturated seconds | Saturation percentage |
|---|---|---|---|
| A | 5501 | 33 | 0.599891% |
| B | 5501 | 143 | 2.599527% |
| C | 5501 | 14 | 0.254499% |
| D | 5501 | 33 | 0.599891% |
Noise dominated data is calculated using 1-second bins in cleaned event files. If a bin has >2000 counts, and if more than 50% of those come from <1% of pixels, then it is considered to be noise-dominated and hence unusable.
| Quadrant | # 1 sec bins | Bins with >0 counts | Bins with >2000 counts | High rate bins dominated by noise | Noise dominated (total time) | Noise dominated (detector-on time) | Marked lightcurve |
|---|---|---|---|---|---|---|---|
| A | 7232 | 5502 | 16 | 16 | 0.22% | 0.29% | 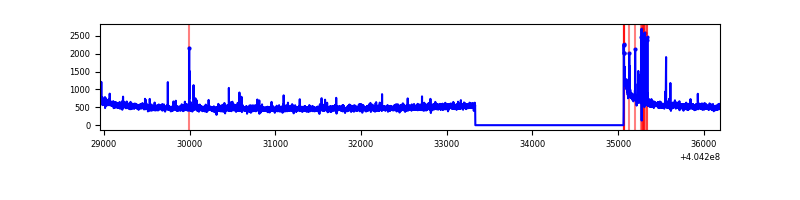 |
| B | 7232 | 5502 | 96 | 96 | 1.33% | 1.74% | 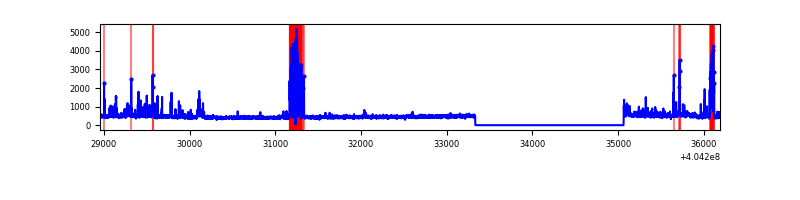 |
| C | 7232 | 5502 | 14 | 14 | 0.19% | 0.25% | 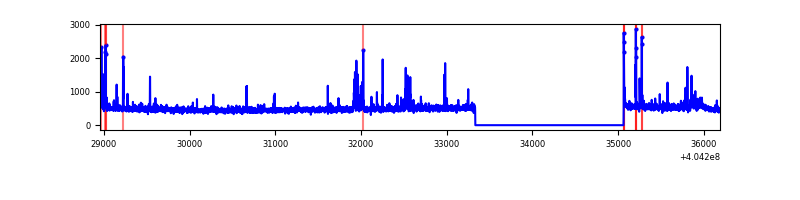 |
| D | 7232 | 5502 | 35 | 35 | 0.48% | 0.64% | 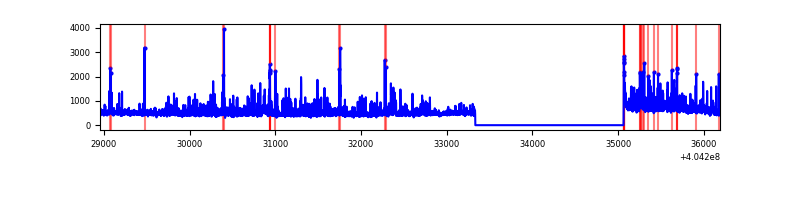 |
Top three noisy pixels from each quadrant. If the there are fewer than three noisy pixels in the level2.evt file, extra rows are filled as -1
| Pixel properties | Quadrant properties | ||||||
|---|---|---|---|---|---|---|---|
| Quadrant | DetID | PixID | Counts | Sigma | Mean | Median | Sigma |
| A | 10 | 83 | 357857 | 2857.91 | 617 | 604 | 125.0 |
| A | 9 | 143 | 78950 | 626.74 | 617 | 604 | 125.0 |
| A | 12 | 189 | 34811 | 273.64 | 617 | 604 | 125.0 |
| B | 5 | 172 | 424075 | 3631.4 | 610 | 593 | 116.6 |
| B | 0 | 229 | 118099 | 1007.62 | 610 | 593 | 116.6 |
| B | 0 | 183 | 20501 | 170.71 | 610 | 593 | 116.6 |
| C | 15 | 214 | 224020 | 1583.82 | 607 | 611 | 141.1 |
| C | 9 | 236 | 127841 | 901.98 | 607 | 611 | 141.1 |
| C | 15 | 159 | 26551 | 183.9 | 607 | 611 | 141.1 |
| D | 7 | 223 | 276515 | 1851.83 | 608 | 591 | 149.0 |
| D | 12 | 235 | 219393 | 1468.46 | 608 | 591 | 149.0 |
| D | 10 | 203 | 100272 | 669.0 | 608 | 591 | 149.0 |
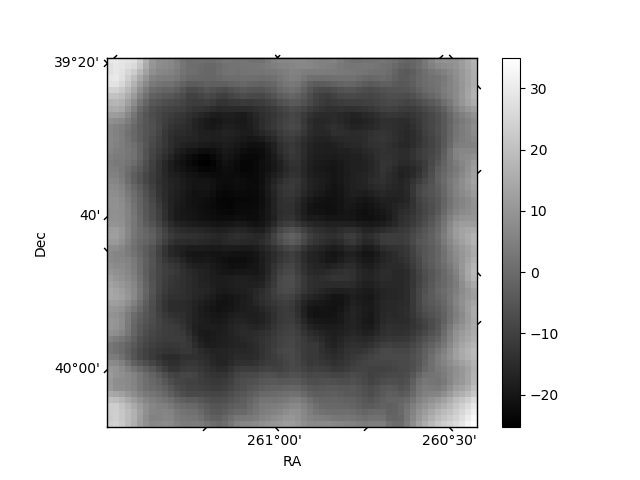
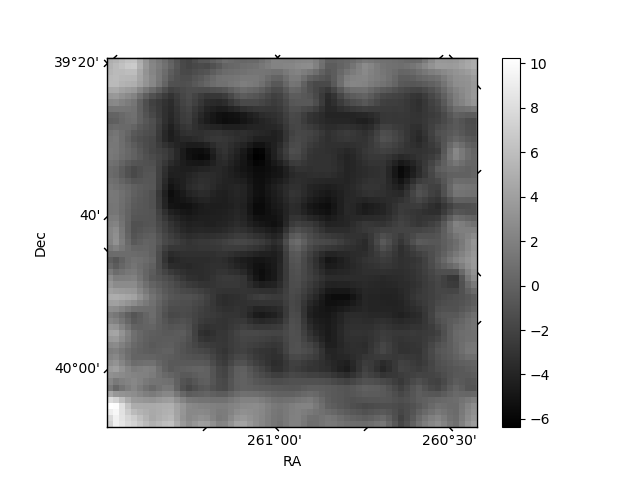
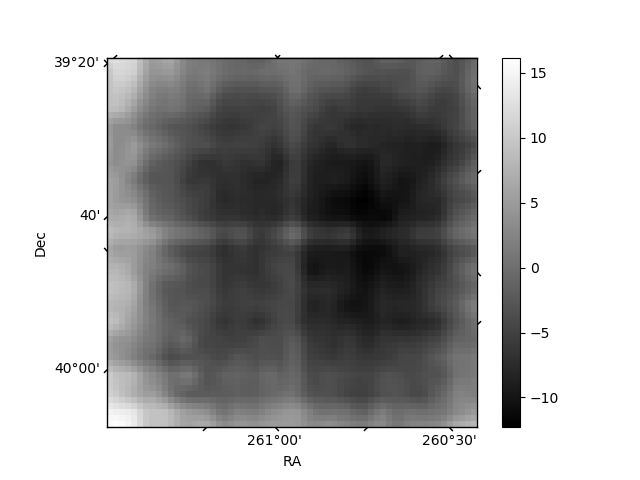
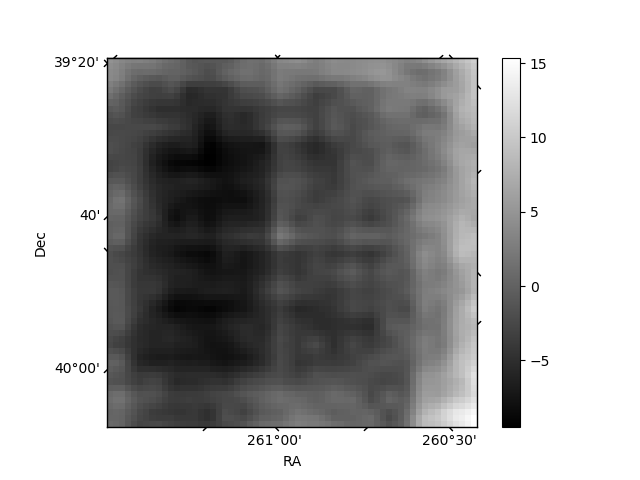
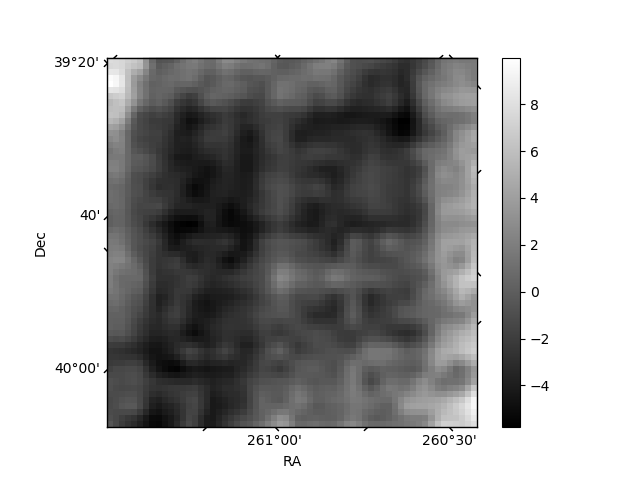
Histogram calculated using DETX and DETY for each event in the final _common_clean file
| Quadrant A | 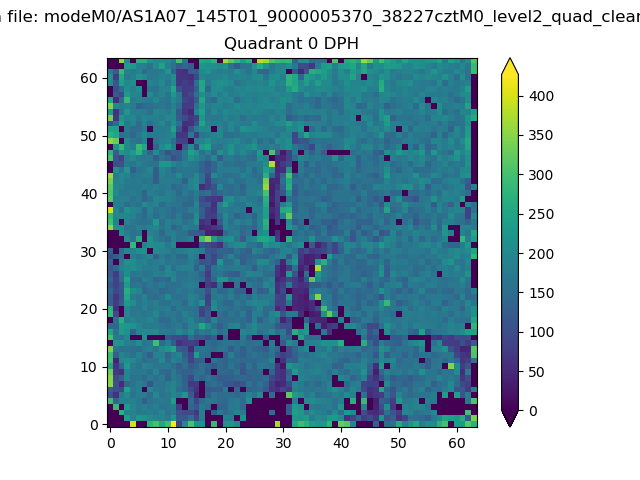 |
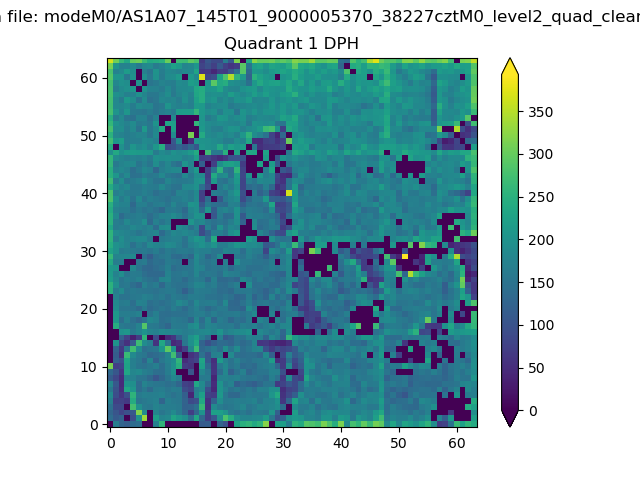 |
Quadrant B |
|---|---|---|---|
| Quadrant D | 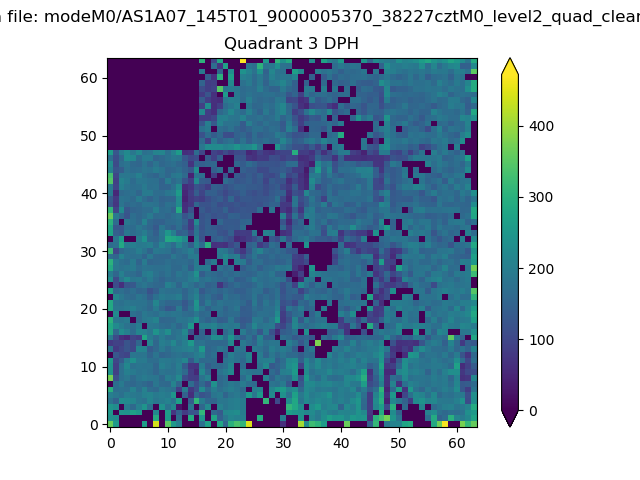 |
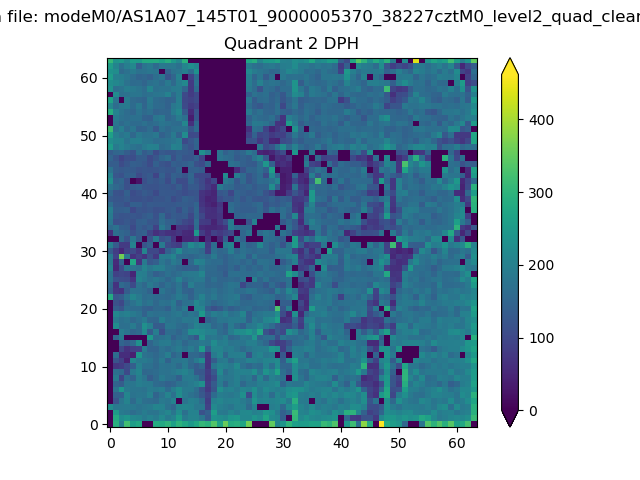 |
Quadrant C |
| Plot type | Count rate plots | Images |
|---|---|---|
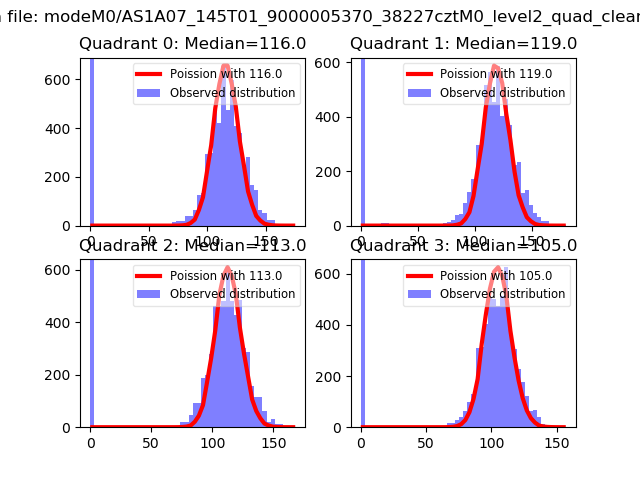
| Comparison with Poisson distribution Blue bars denote a histogram of data divided into 1 sec bins. Red curve is a Poisson curve with rate = median count rate of data. |
 |
 |
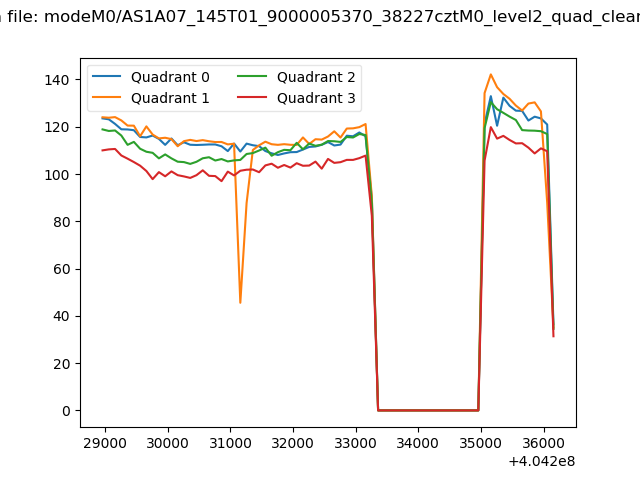
| Quadrant-wise count rates Data is divided into 100 sec bins |
 |
|
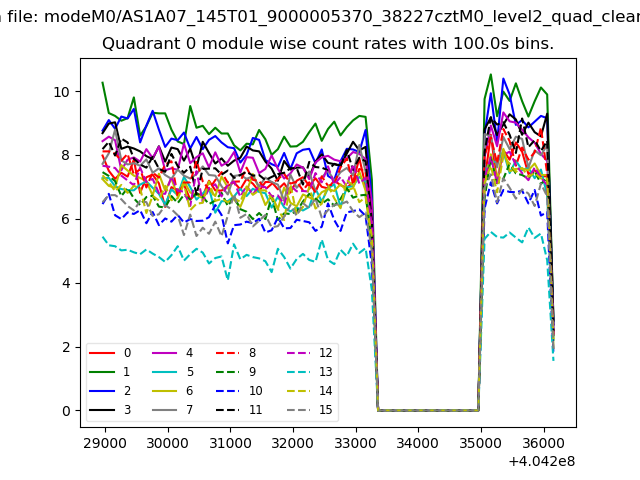
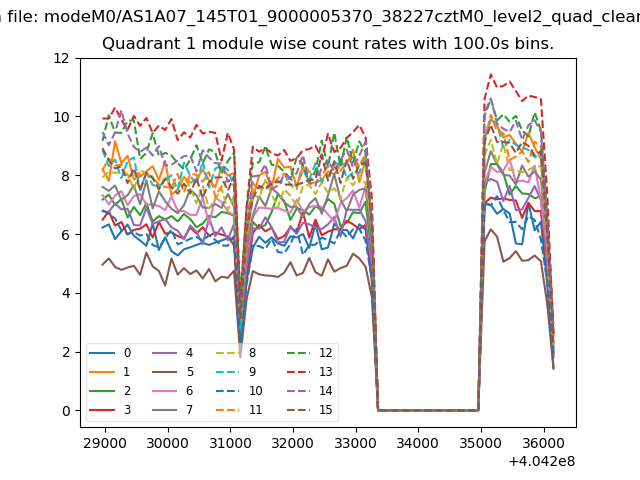
| Module-wise count rates for Quadrant A Data is divided into 100 sec bins |
 |
 |
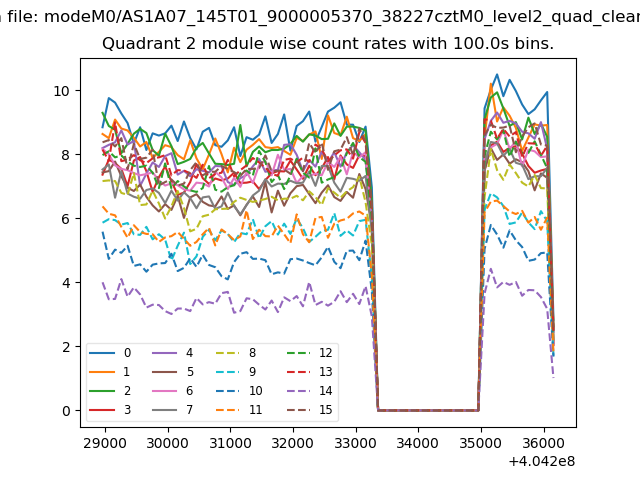
| Module-wise count rates for Quadrant B Data is divided into 100 sec bins |
 |
 |
| Module-wise count rates for Quadrant C Data is divided into 100 sec bins |
 |
 |
| Module-wise count rates for Quadrant D Data is divided into 100 sec bins |
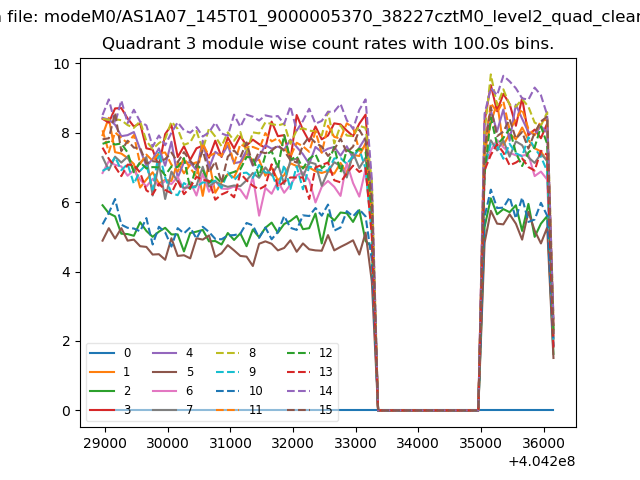 |
 |
| Parameter | Plot |
|---|---|
| CZT HV Monitor | 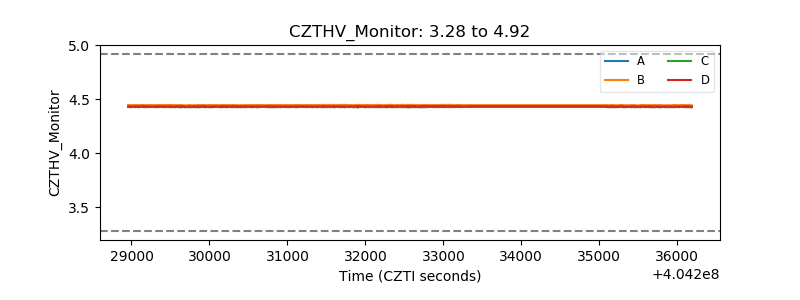 |
| D_VDD | 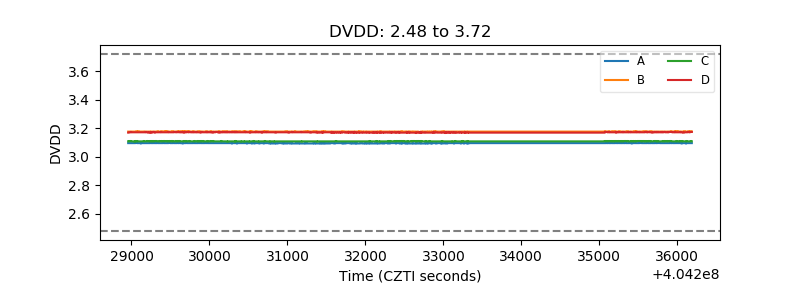 |
| Temperature 1 | 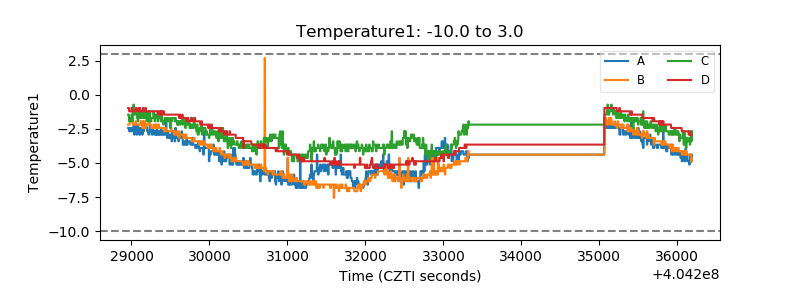 |
| Veto HV Monitor |  |
| Veto LLD | 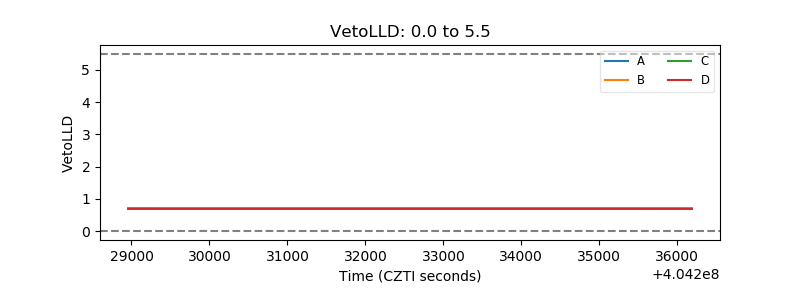 |
| Alpha Counter | 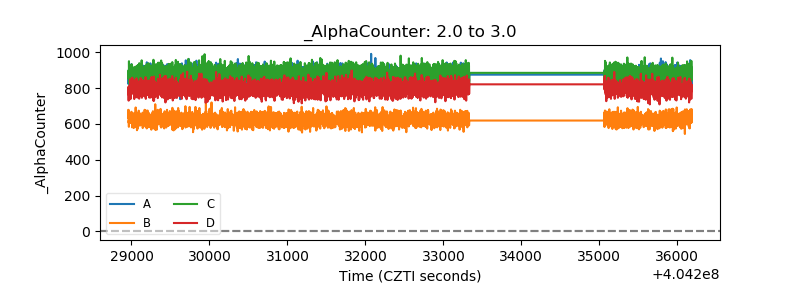 |
| _CPM_Rate | 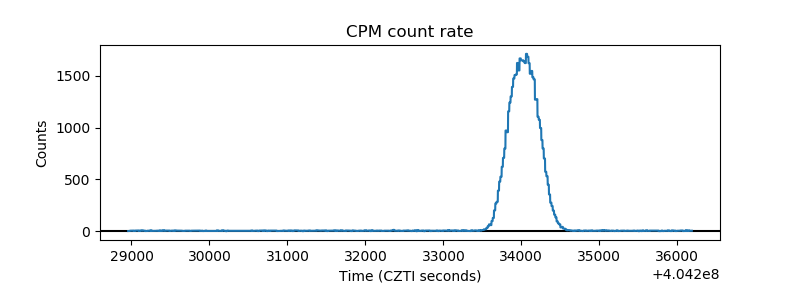 |
| CZT Counter | 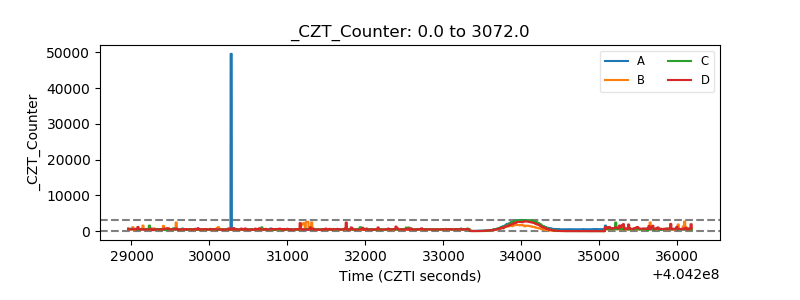 |
| +2.5 Volts monitor | 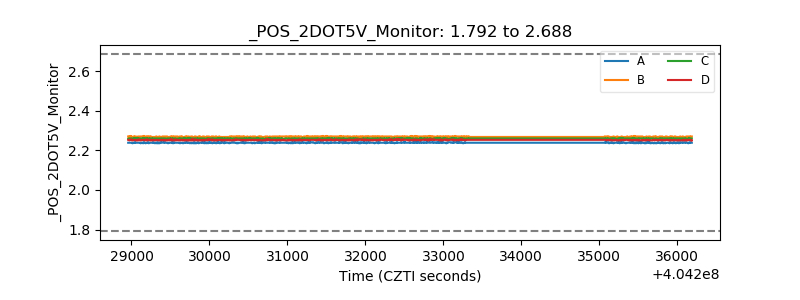 |
| +5 Volts monitor | 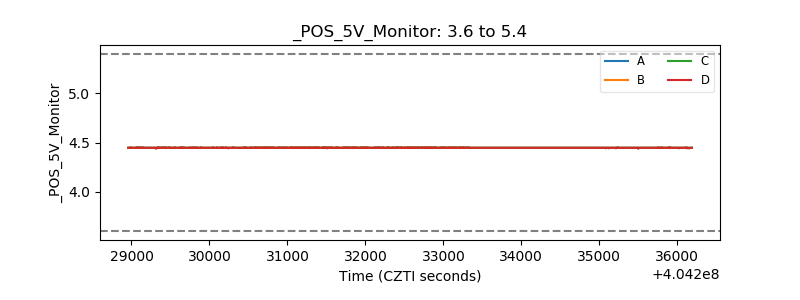 |
| _ROLL_ROT | 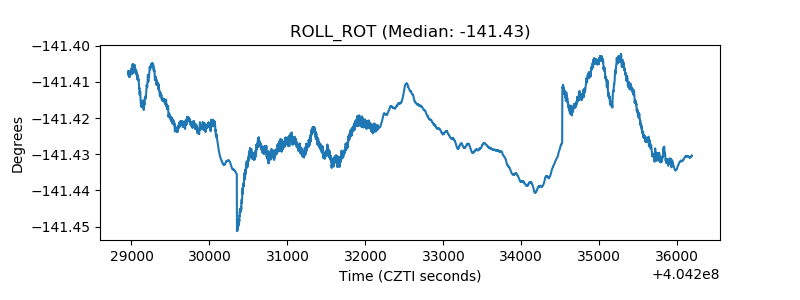 |
| _Roll_DEC | 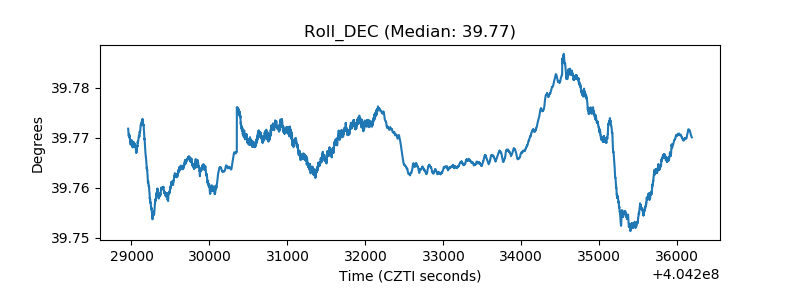 |
| _Roll_RA | 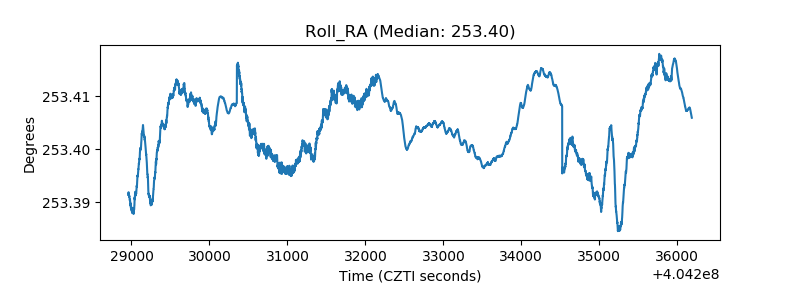 |
| Veto Counter | 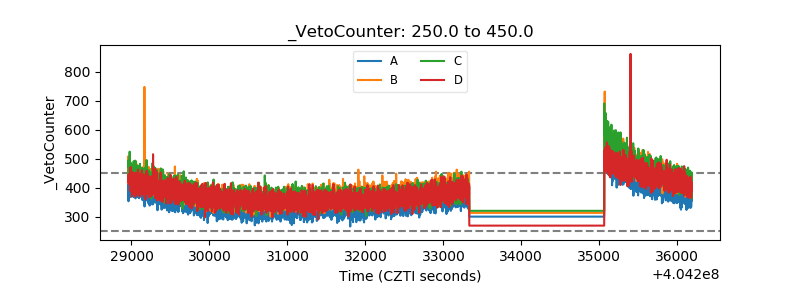 |