| Param | Original file | Final file |
|---|---|---|
| Filename | modeM0/AS1A07_145T01_9000005370_38228cztM0_level2.fits | modeM0/AS1A07_145T01_9000005370_38228cztM0_level2_quad_clean.evt |
| Size (bytes) | 325,272,960 | 91,716,480 |
| Size | 310.2 MB | 87.5 MB |
| Events in quadrant A | 2,817,646 | 616,926 |
| Events in quadrant B | 2,640,091 | 633,997 |
| Events in quadrant C | 2,907,235 | 609,547 |
| Events in quadrant D | 3,277,030 | 558,311 |
| Mode M9 | |||
|---|---|---|---|
| Quadrant | BADHDUFLAG | Total packets | Discarded packets |
| A | 0 | 19 | 0 |
| B | 0 | 19 | 0 |
| C | 0 | 19 | 0 |
| D | 0 | 19 | 0 |
| Mode SS | |||
|---|---|---|---|
| Quadrant | BADHDUFLAG | Total packets | Discarded packets |
| A | 0 | 104 | 0 |
| B | 0 | 104 | 0 |
| C | 0 | 104 | 0 |
| D | 0 | 104 | 0 |
| Mode M0 | |||
|---|---|---|---|
| Quadrant | BADHDUFLAG | Total packets | Discarded packets |
| A | 0 | 11394 | 2 |
| B | 0 | 11170 | 1 |
| C | 0 | 11801 | 1 |
| D | 0 | 13190 | 1 |
| Quadrant | Total seconds | Saturated seconds | Saturation percentage |
|---|---|---|---|
| A | 5117 | 48 | 0.938050% |
| B | 5117 | 63 | 1.231190% |
| C | 5117 | 24 | 0.469025% |
| D | 5117 | 81 | 1.582959% |
Noise dominated data is calculated using 1-second bins in cleaned event files. If a bin has >2000 counts, and if more than 50% of those come from <1% of pixels, then it is considered to be noise-dominated and hence unusable.
| Quadrant | # 1 sec bins | Bins with >0 counts | Bins with >2000 counts | High rate bins dominated by noise | Noise dominated (total time) | Noise dominated (detector-on time) | Marked lightcurve |
|---|---|---|---|---|---|---|---|
| A | 6999 | 5118 | 25 | 25 | 0.36% | 0.49% | 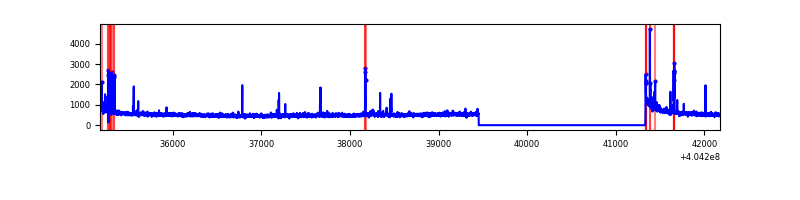 |
| B | 6999 | 5118 | 33 | 33 | 0.47% | 0.64% | 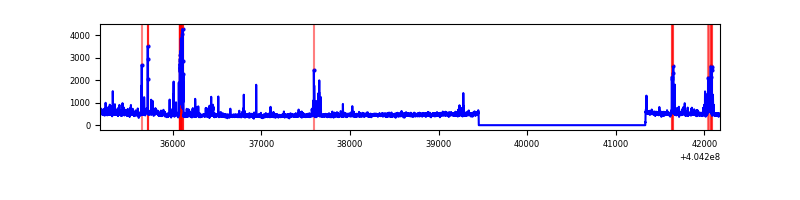 |
| C | 6999 | 5118 | 20 | 20 | 0.29% | 0.39% | 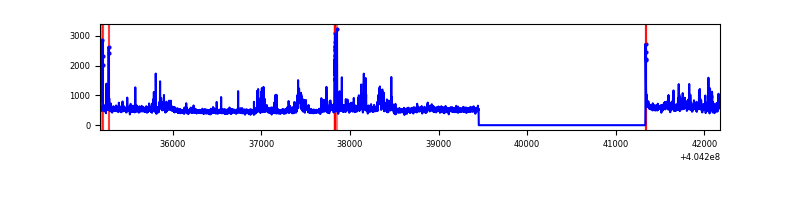 |
| D | 6999 | 5118 | 79 | 79 | 1.13% | 1.54% | 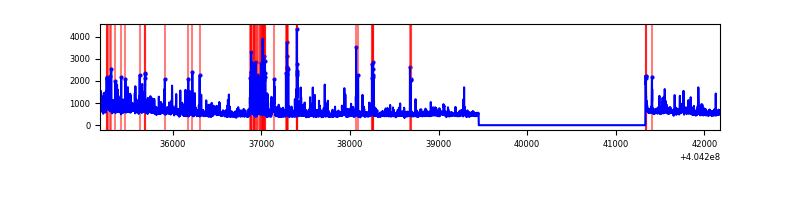 |
Top three noisy pixels from each quadrant. If the there are fewer than three noisy pixels in the level2.evt file, extra rows are filled as -1
| Pixel properties | Quadrant properties | ||||||
|---|---|---|---|---|---|---|---|
| Quadrant | DetID | PixID | Counts | Sigma | Mean | Median | Sigma |
| A | 10 | 83 | 340376 | 2880.01 | 586 | 573 | 118.0 |
| A | 9 | 143 | 139324 | 1175.99 | 586 | 573 | 118.0 |
| A | 12 | 189 | 27179 | 225.5 | 586 | 573 | 118.0 |
| B | 5 | 172 | 206245 | 1812.53 | 589 | 573 | 113.5 |
| B | 0 | 229 | 57281 | 499.75 | 589 | 573 | 113.5 |
| B | 0 | 183 | 19893 | 170.26 | 589 | 573 | 113.5 |
| C | 3 | 9 | 265801 | 1942.2 | 584 | 587 | 136.6 |
| C | 15 | 214 | 211042 | 1541.19 | 584 | 587 | 136.6 |
| C | 14 | 254 | 67477 | 489.85 | 584 | 587 | 136.6 |
| D | 7 | 223 | 235523 | 1676.18 | 579 | 566 | 140.2 |
| D | 12 | 235 | 189288 | 1346.34 | 579 | 566 | 140.2 |
| D | 7 | 55 | 148906 | 1058.26 | 579 | 566 | 140.2 |
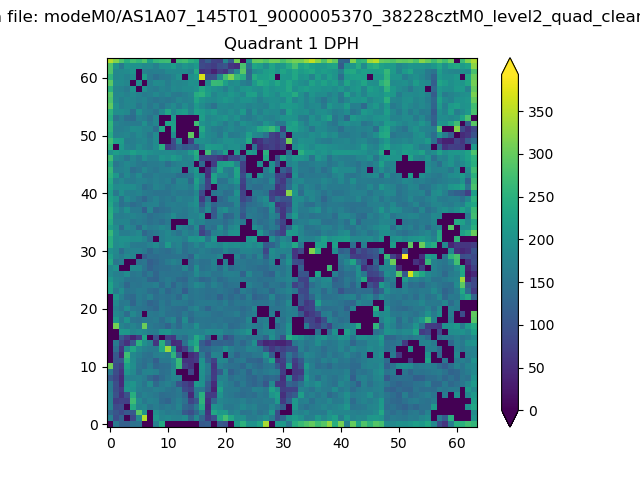
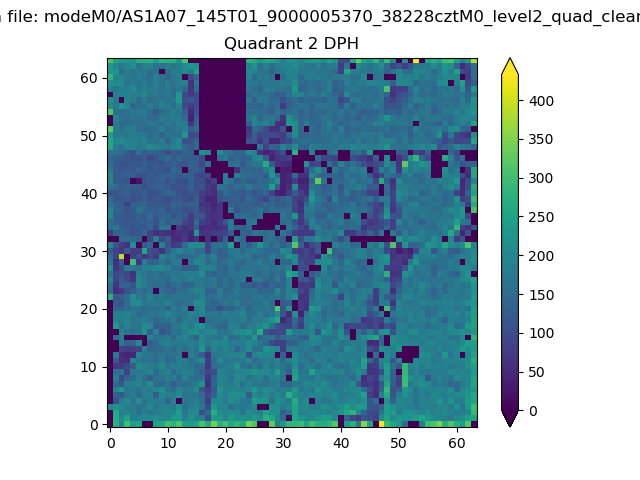
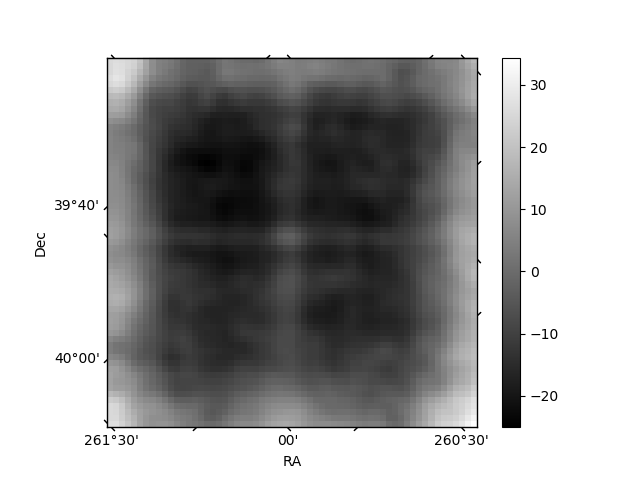
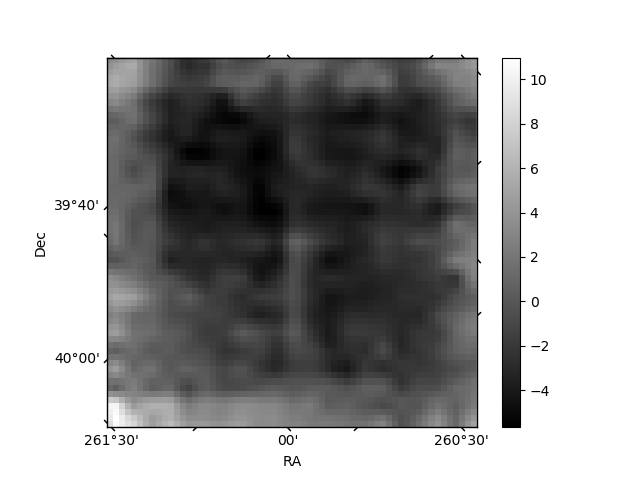
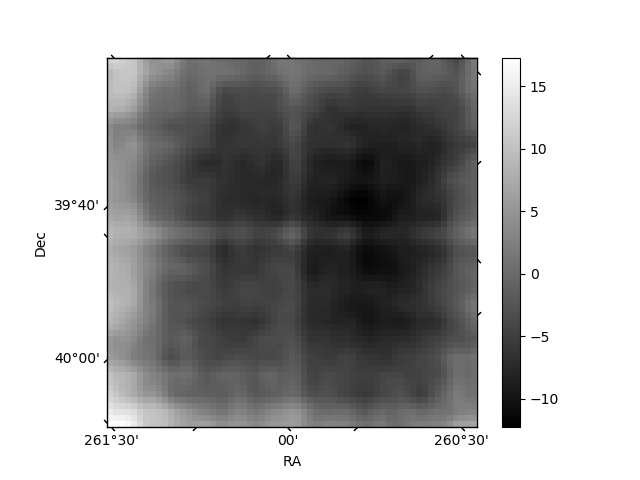
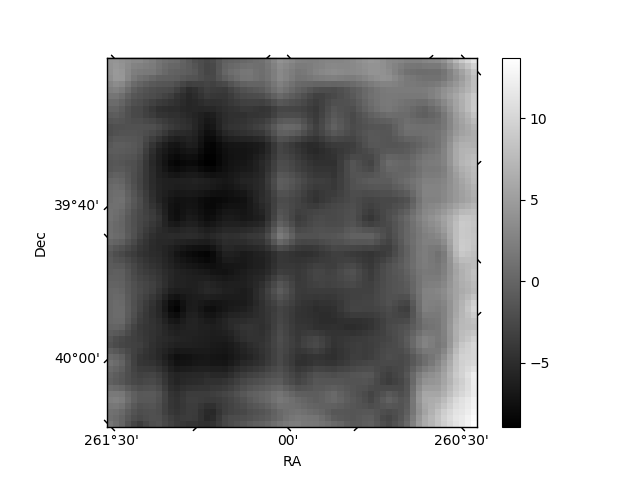
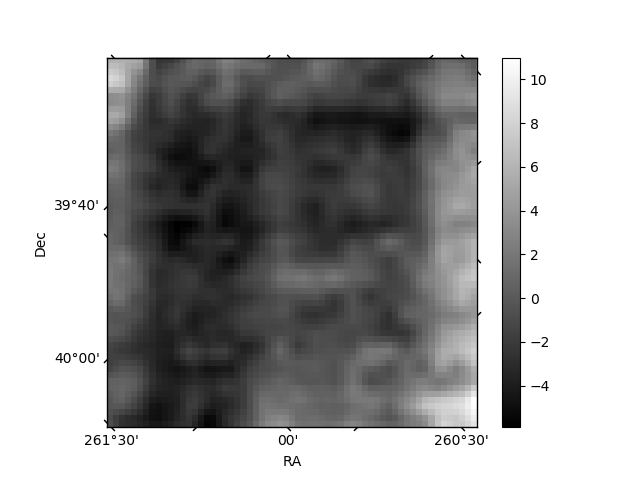
Histogram calculated using DETX and DETY for each event in the final _common_clean file
| Quadrant A |  |
 |
Quadrant B |
|---|---|---|---|
| Quadrant D | 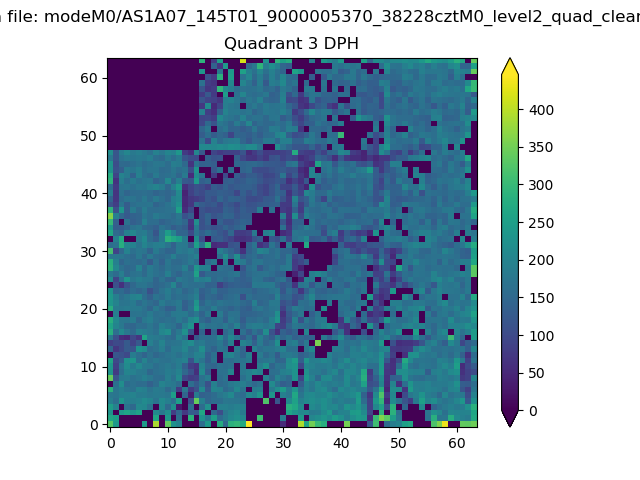 |
 |
Quadrant C |
| Plot type | Count rate plots | Images |
|---|---|---|
| Comparison with Poisson distribution Blue bars denote a histogram of data divided into 1 sec bins. Red curve is a Poisson curve with rate = median count rate of data. |
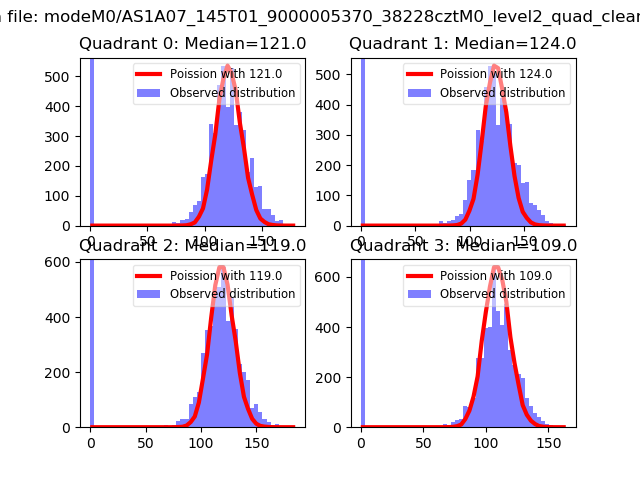 |
 |
| Quadrant-wise count rates Data is divided into 100 sec bins |
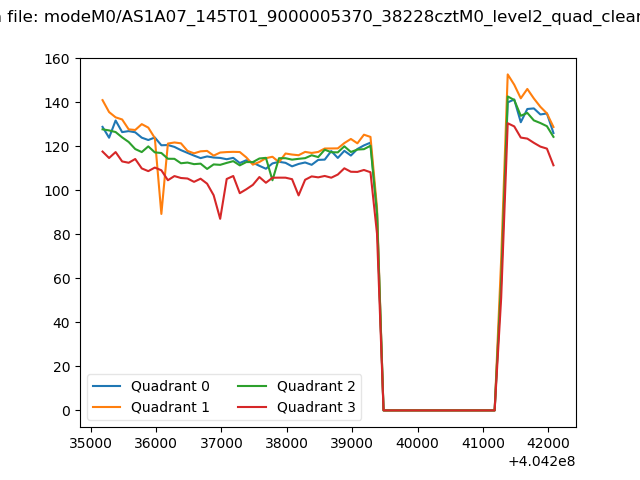 |
|
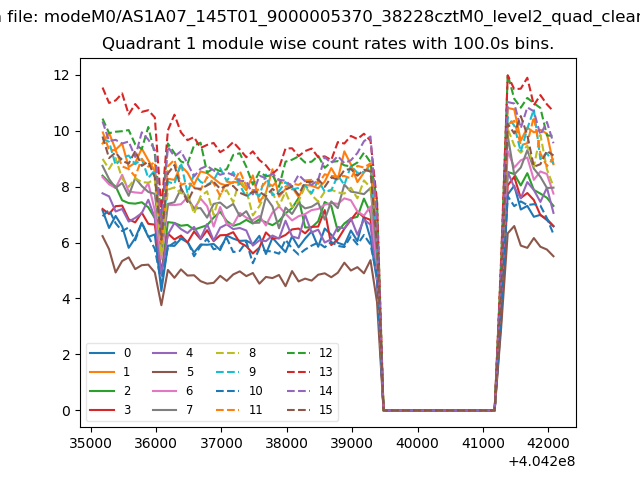
| Module-wise count rates for Quadrant A Data is divided into 100 sec bins |
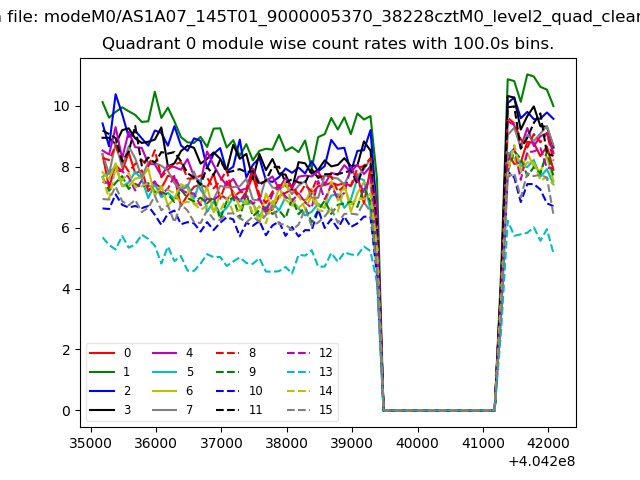 |
 |
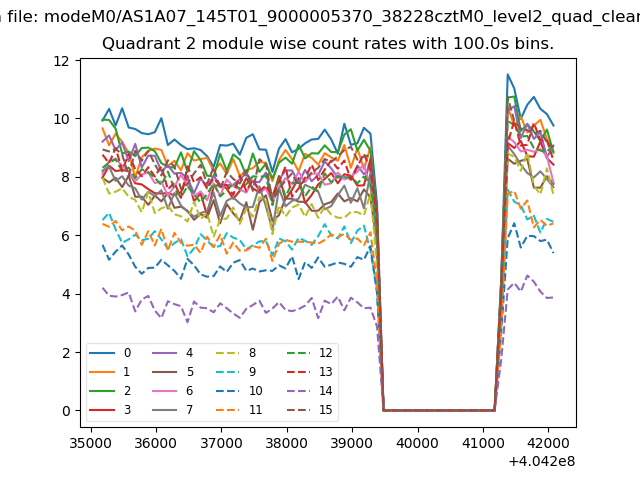
| Module-wise count rates for Quadrant B Data is divided into 100 sec bins |
 |
 |
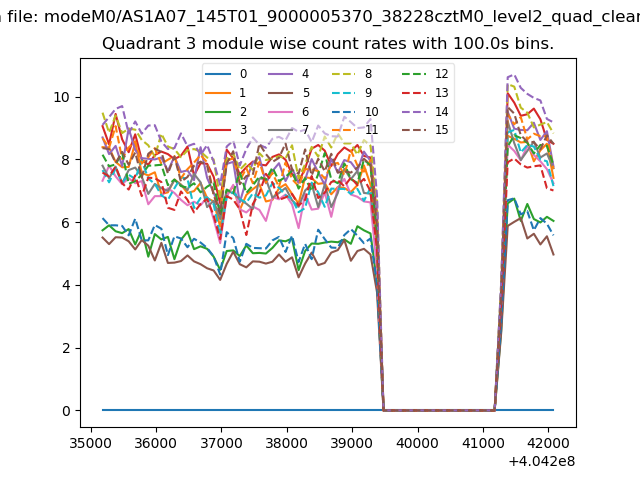
| Module-wise count rates for Quadrant C Data is divided into 100 sec bins |
 |
 |
| Module-wise count rates for Quadrant D Data is divided into 100 sec bins |
 |
 |
| Parameter | Plot |
|---|---|
| CZT HV Monitor | 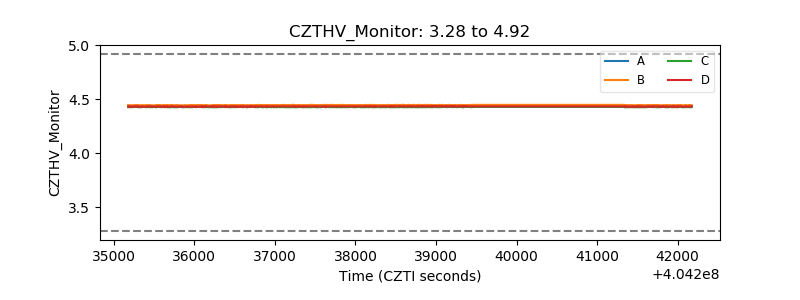 |
| D_VDD | 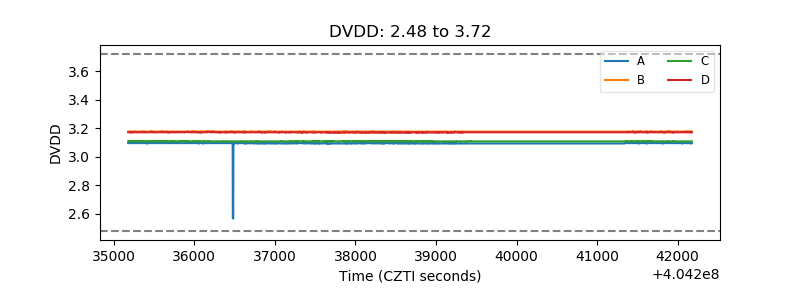 |
| Temperature 1 | 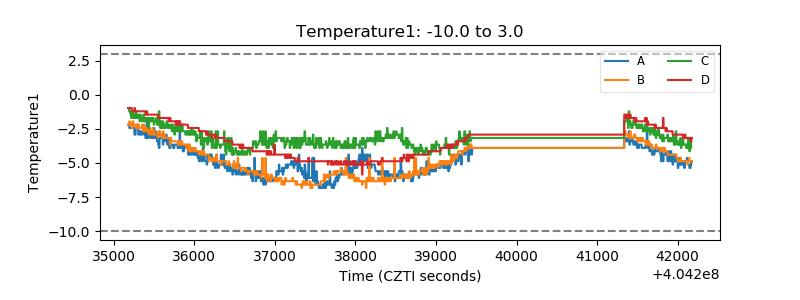 |
| Veto HV Monitor | 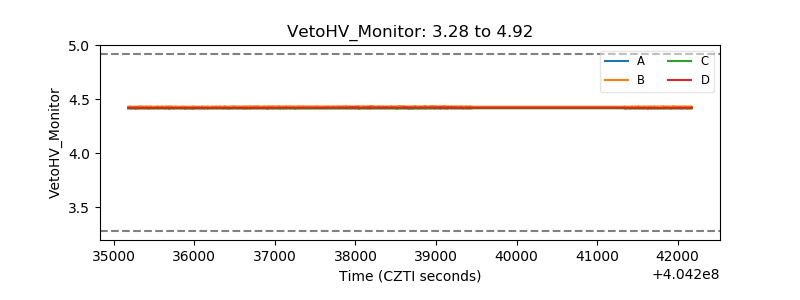 |
| Veto LLD | 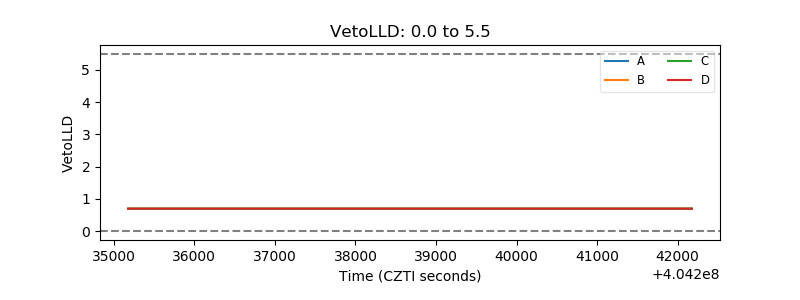 |
| Alpha Counter | 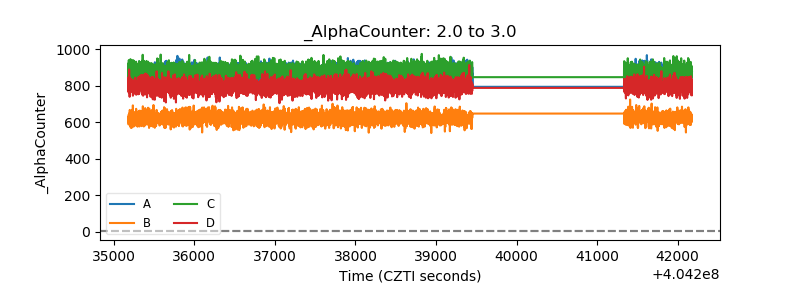 |
| _CPM_Rate | 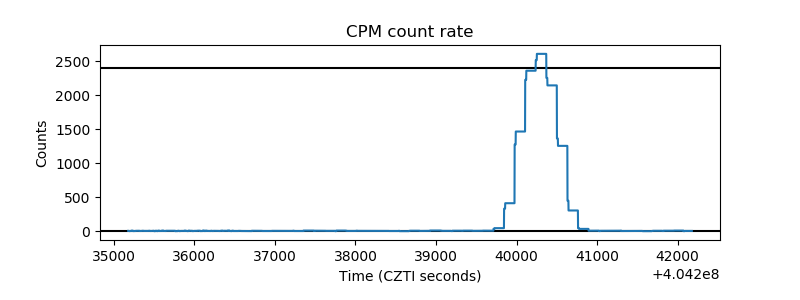 |
| CZT Counter | 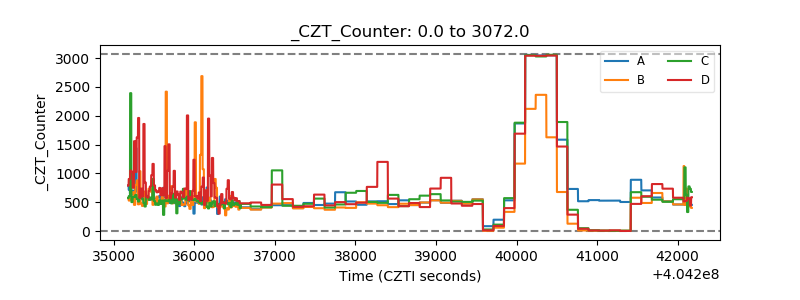 |
| +2.5 Volts monitor | 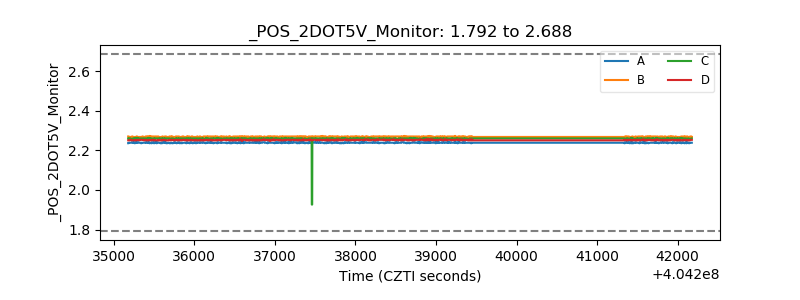 |
| +5 Volts monitor | 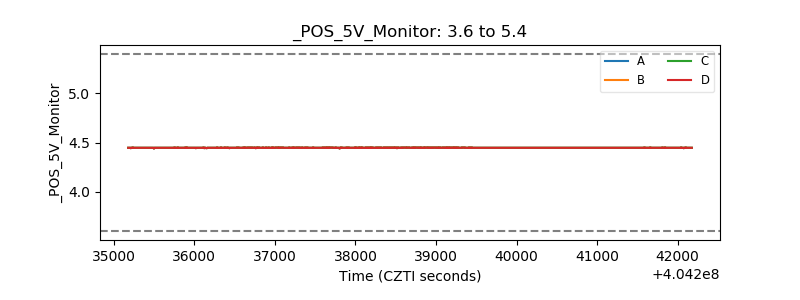 |
| _ROLL_ROT | 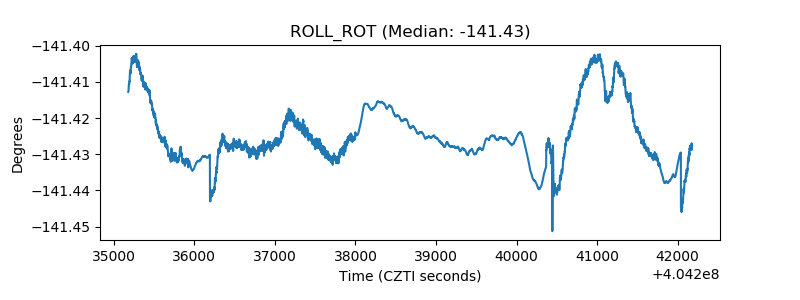 |
| _Roll_DEC | 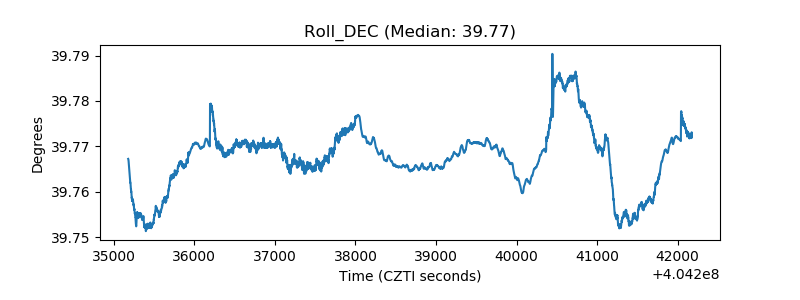 |
| _Roll_RA | 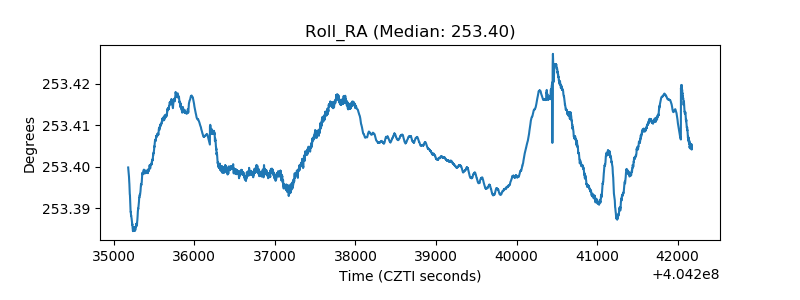 |
| Veto Counter | 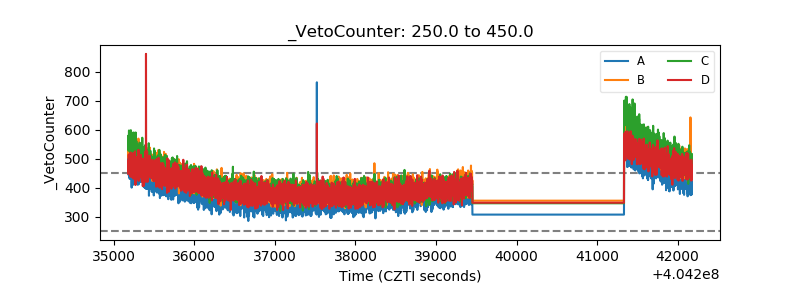 |