| Param | Original file | Final file |
|---|---|---|
| Filename | modeM0/AS1A07_145T01_9000005370_38229cztM0_level2.fits | modeM0/AS1A07_145T01_9000005370_38229cztM0_level2_quad_clean.evt |
| Size (bytes) | 328,752,000 | 93,911,040 |
| Size | 313.5 MB | 89.6 MB |
| Events in quadrant A | 2,849,859 | 629,411 |
| Events in quadrant B | 2,659,747 | 655,084 |
| Events in quadrant C | 3,123,571 | 630,413 |
| Events in quadrant D | 3,145,050 | 576,705 |
| Mode M9 | |||
|---|---|---|---|
| Quadrant | BADHDUFLAG | Total packets | Discarded packets |
| A | 0 | 29 | 0 |
| B | 0 | 29 | 0 |
| C | 0 | 29 | 0 |
| D | 0 | 30 | 0 |
| Mode SS | |||
|---|---|---|---|
| Quadrant | BADHDUFLAG | Total packets | Discarded packets |
| A | 0 | 102 | 0 |
| B | 0 | 102 | 0 |
| C | 0 | 102 | 0 |
| D | 0 | 102 | 0 |
| Mode M0 | |||
|---|---|---|---|
| Quadrant | BADHDUFLAG | Total packets | Discarded packets |
| A | 0 | 11482 | 3 |
| B | 0 | 11062 | 2 |
| C | 0 | 12514 | 2 |
| D | 0 | 12675 | 2 |
| Quadrant | Total seconds | Saturated seconds | Saturation percentage |
|---|---|---|---|
| A | 5024 | 39 | 0.776274% |
| B | 5024 | 43 | 0.855892% |
| C | 5024 | 17 | 0.338376% |
| D | 5024 | 50 | 0.995223% |
Noise dominated data is calculated using 1-second bins in cleaned event files. If a bin has >2000 counts, and if more than 50% of those come from <1% of pixels, then it is considered to be noise-dominated and hence unusable.
| Quadrant | # 1 sec bins | Bins with >0 counts | Bins with >2000 counts | High rate bins dominated by noise | Noise dominated (total time) | Noise dominated (detector-on time) | Marked lightcurve |
|---|---|---|---|---|---|---|---|
| A | 7027 | 5025 | 28 | 28 | 0.40% | 0.56% | 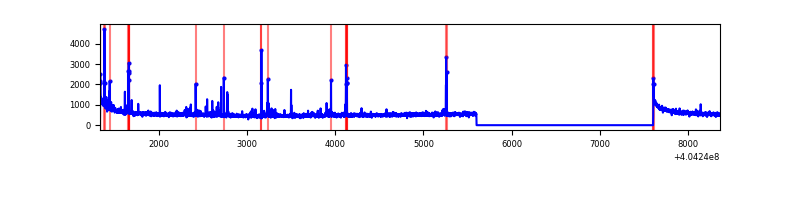 |
| B | 7027 | 5025 | 28 | 28 | 0.40% | 0.56% | 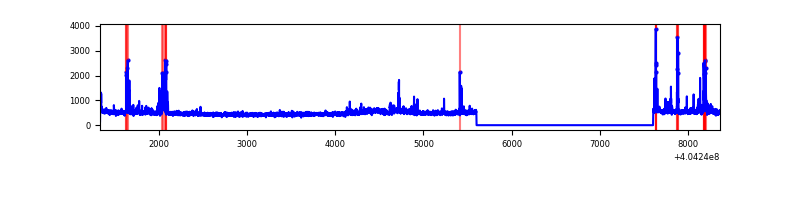 |
| C | 7027 | 5025 | 15 | 15 | 0.21% | 0.30% | 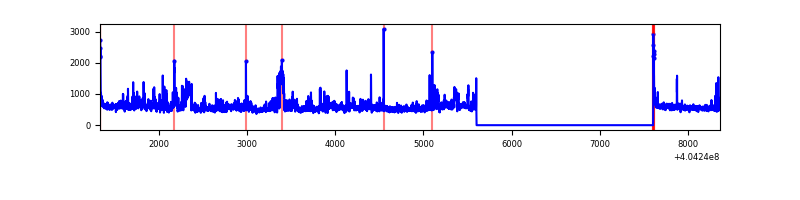 |
| D | 7027 | 5025 | 45 | 45 | 0.64% | 0.90% | 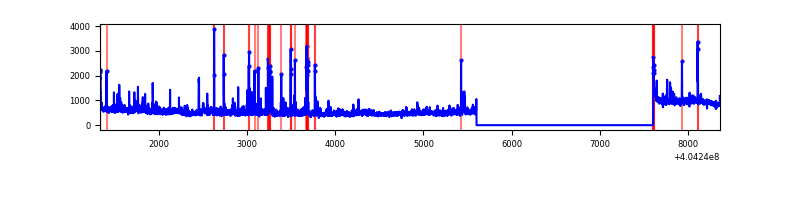 |
Top three noisy pixels from each quadrant. If the there are fewer than three noisy pixels in the level2.evt file, extra rows are filled as -1
| Pixel properties | Quadrant properties | ||||||
|---|---|---|---|---|---|---|---|
| Quadrant | DetID | PixID | Counts | Sigma | Mean | Median | Sigma |
| A | 10 | 83 | 371239 | 3114.87 | 590 | 579 | 119.0 |
| A | 9 | 143 | 138258 | 1157.0 | 590 | 579 | 119.0 |
| A | 12 | 189 | 22627 | 185.28 | 590 | 579 | 119.0 |
| B | 5 | 172 | 197244 | 1724.83 | 596 | 579 | 114.0 |
| B | 4 | 141 | 64441 | 560.1 | 596 | 579 | 114.0 |
| B | 5 | 184 | 30292 | 260.6 | 596 | 579 | 114.0 |
| C | 3 | 9 | 519281 | 3792.67 | 591 | 594 | 136.8 |
| C | 15 | 214 | 208798 | 1522.4 | 591 | 594 | 136.8 |
| C | 0 | 10 | 37941 | 273.08 | 591 | 594 | 136.8 |
| D | 10 | 203 | 311308 | 2209.75 | 584 | 570 | 140.6 |
| D | 7 | 55 | 124716 | 882.84 | 584 | 570 | 140.6 |
| D | 7 | 223 | 114540 | 810.47 | 584 | 570 | 140.6 |
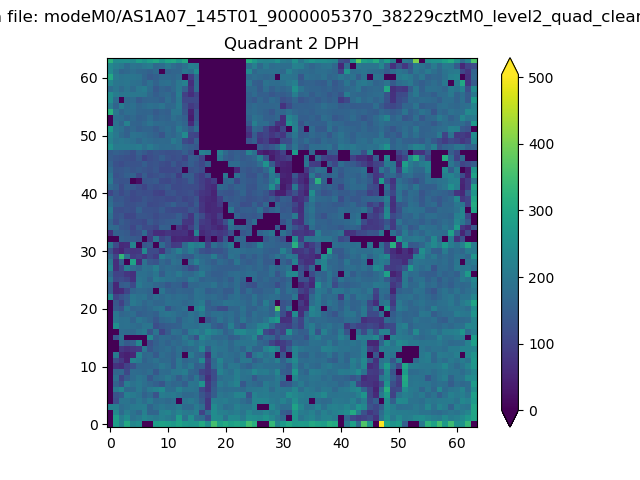
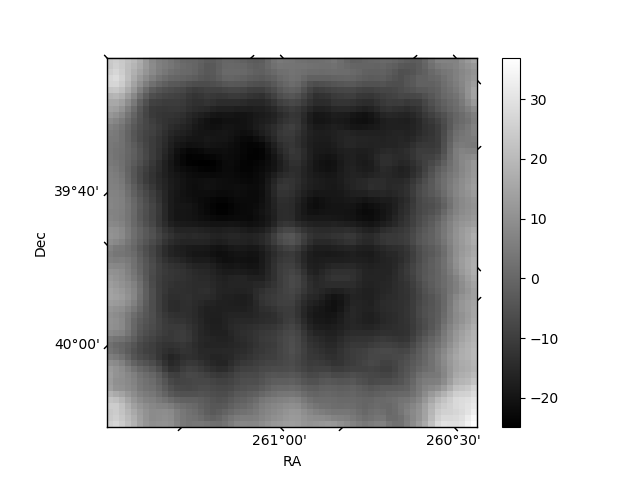
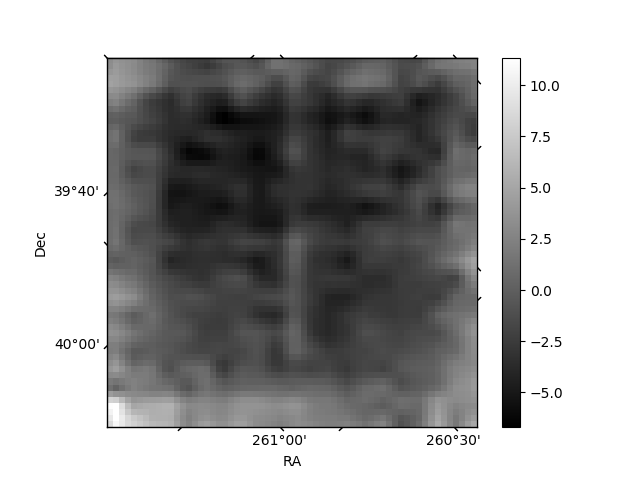
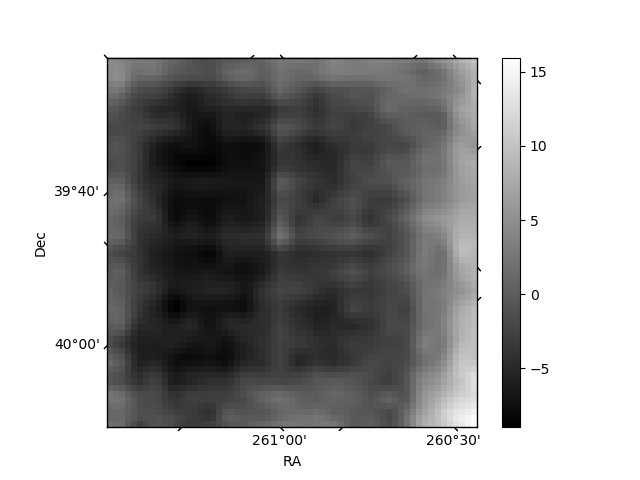
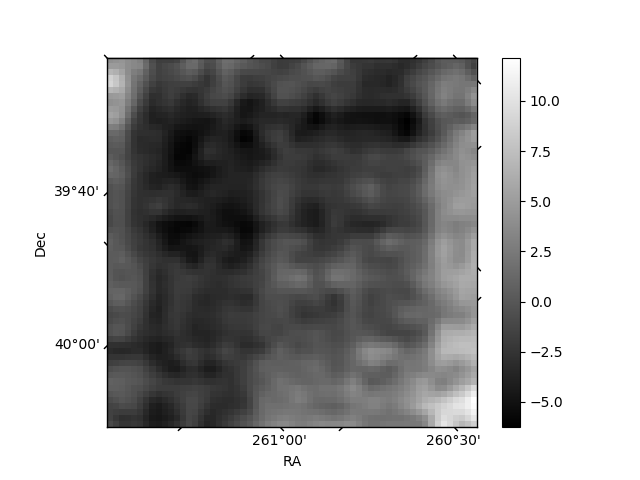
Histogram calculated using DETX and DETY for each event in the final _common_clean file
| Quadrant A | 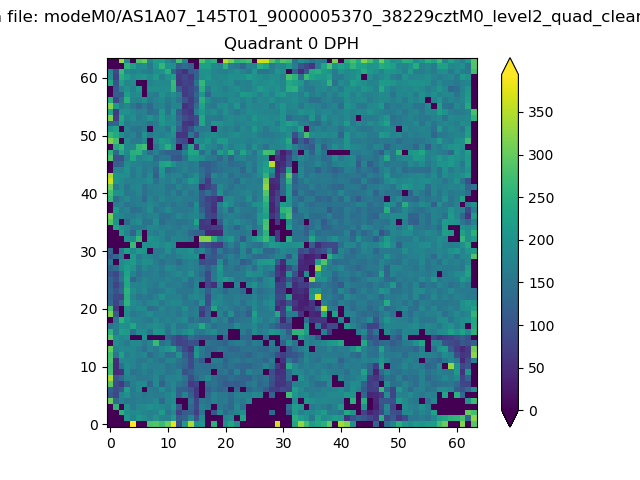 |
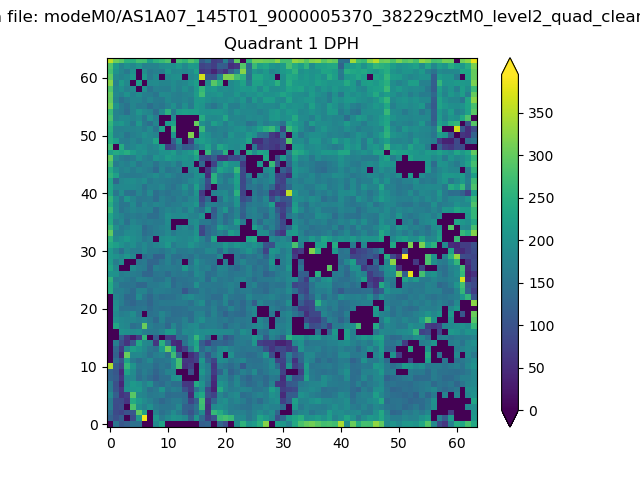 |
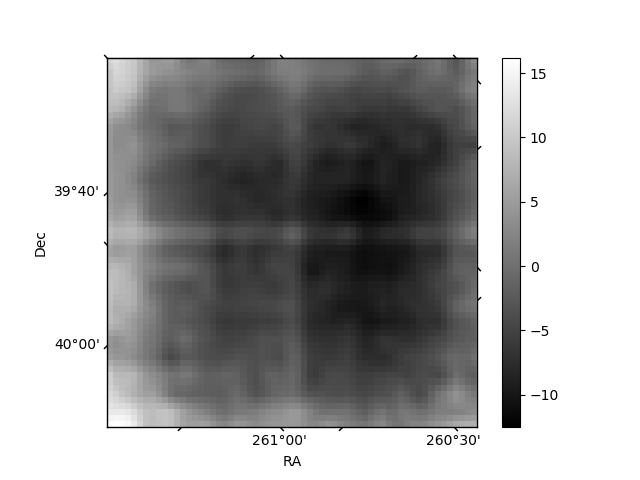
Quadrant B |
|---|---|---|---|
| Quadrant D | 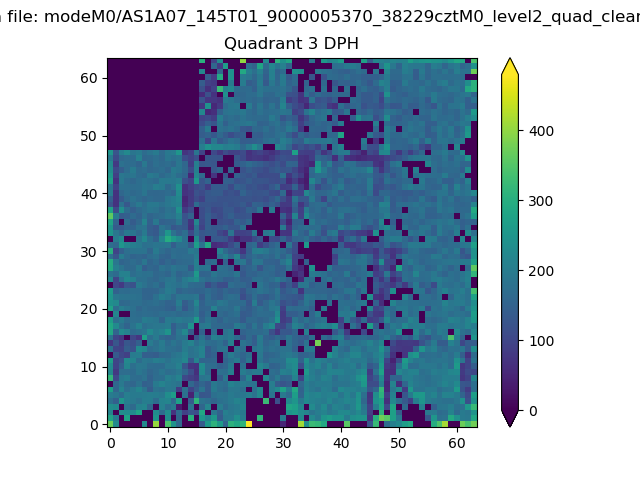 |
 |
Quadrant C |
| Plot type | Count rate plots | Images |
|---|---|---|
| Comparison with Poisson distribution Blue bars denote a histogram of data divided into 1 sec bins. Red curve is a Poisson curve with rate = median count rate of data. |
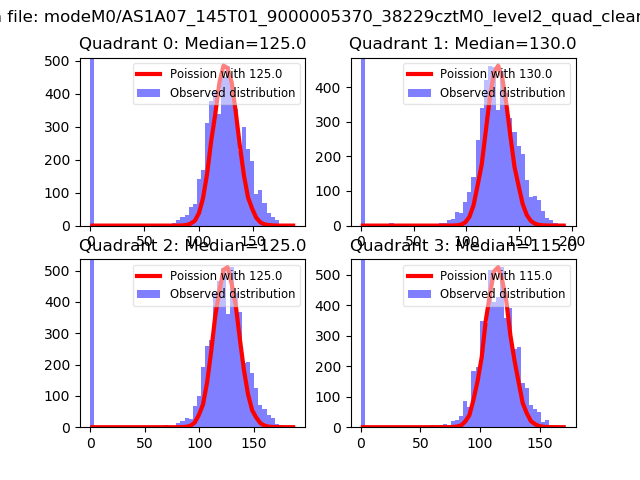 |
 |
| Quadrant-wise count rates Data is divided into 100 sec bins |
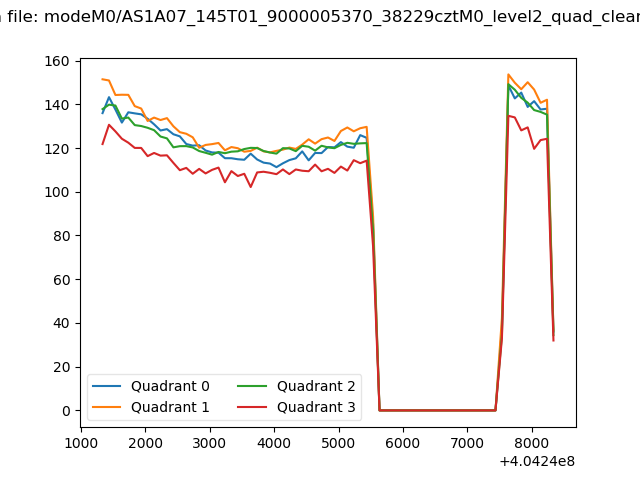 |
|
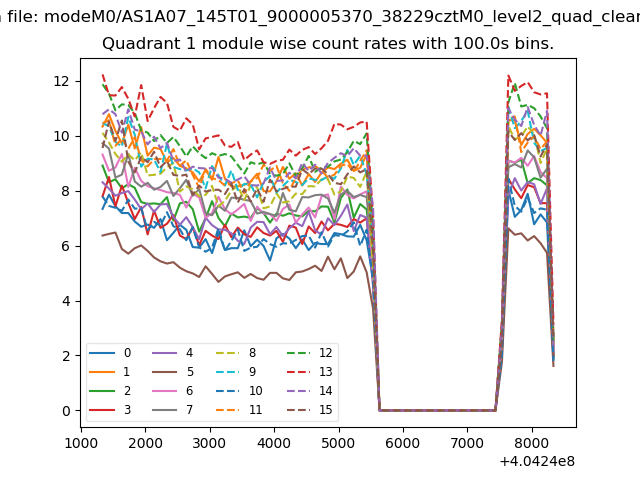
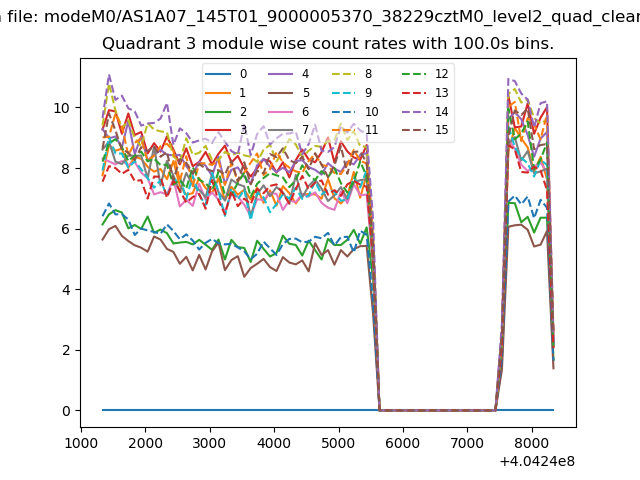
| Module-wise count rates for Quadrant A Data is divided into 100 sec bins |
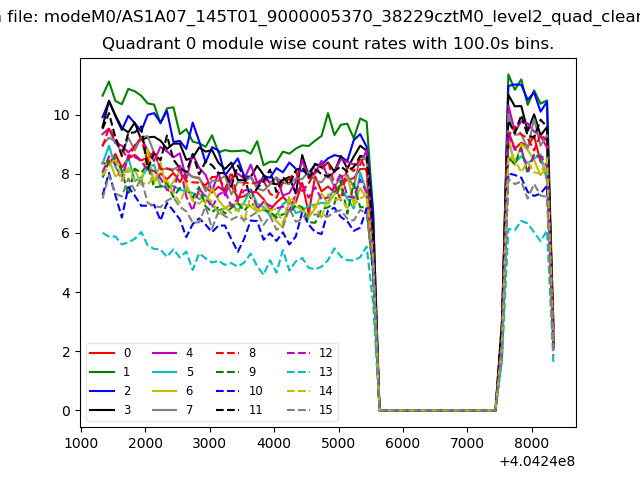 |
 |
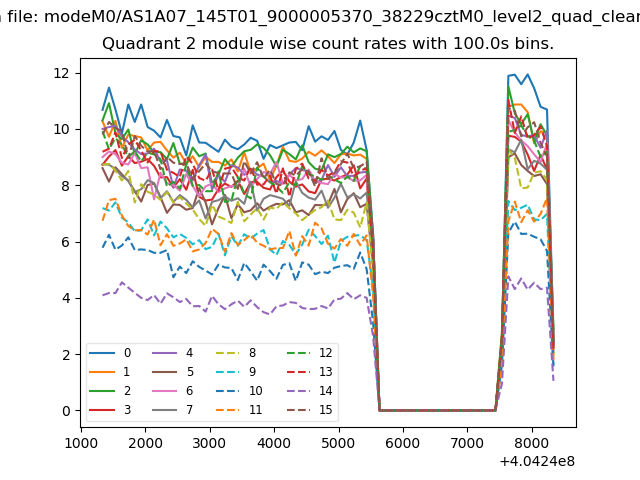
| Module-wise count rates for Quadrant B Data is divided into 100 sec bins |
 |
 |
| Module-wise count rates for Quadrant C Data is divided into 100 sec bins |
 |
 |
| Module-wise count rates for Quadrant D Data is divided into 100 sec bins |
 |
 |
| Parameter | Plot |
|---|---|
| CZT HV Monitor |  |
| D_VDD | 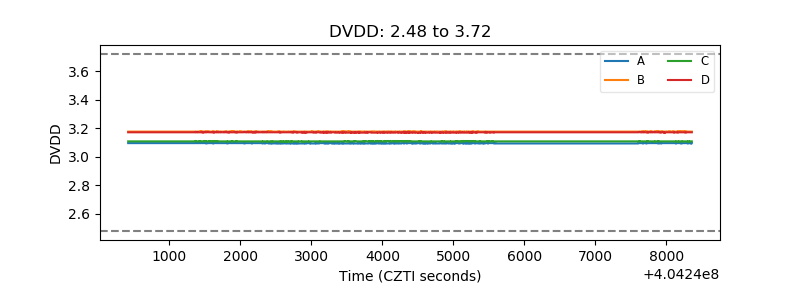 |
| Temperature 1 | 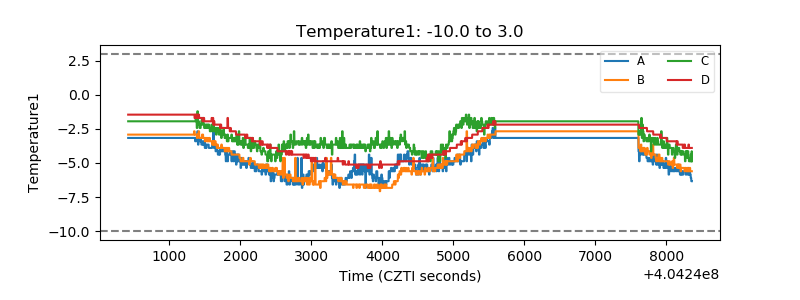 |
| Veto HV Monitor | 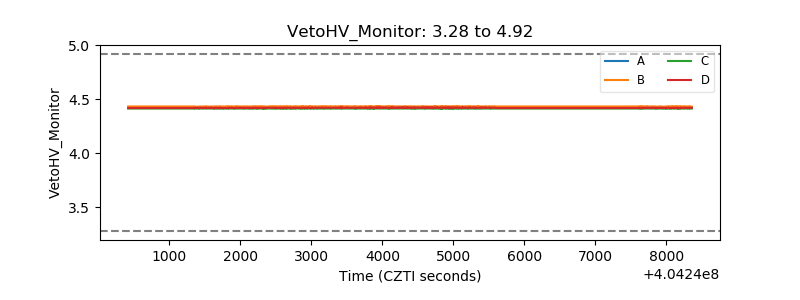 |
| Veto LLD | 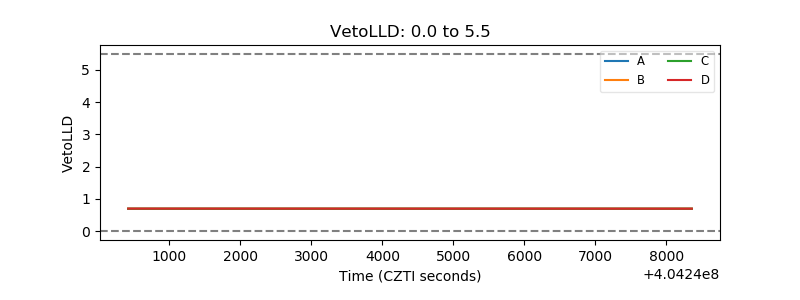 |
| Alpha Counter | 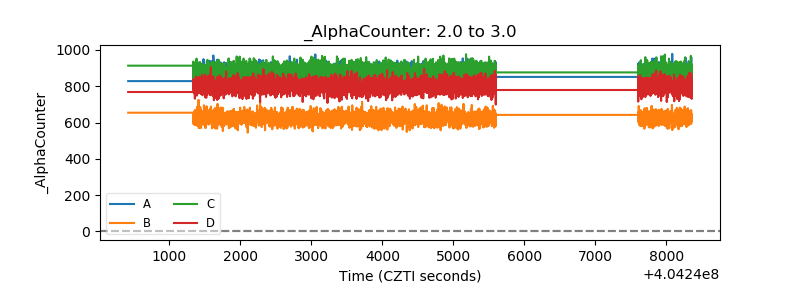 |
| _CPM_Rate | 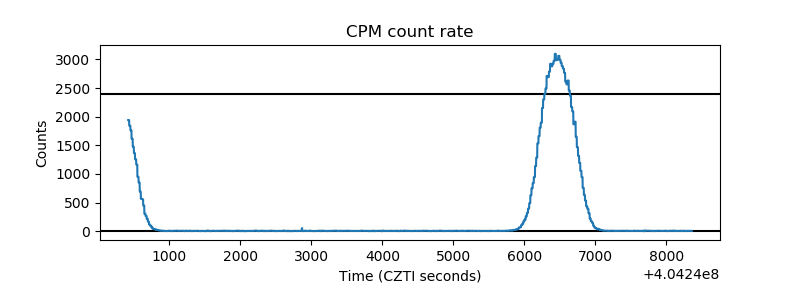 |
| CZT Counter | 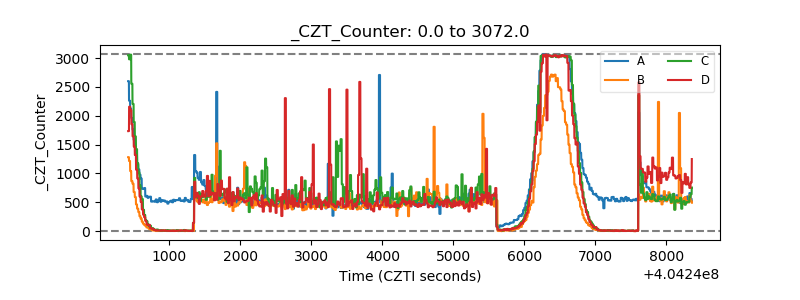 |
| +2.5 Volts monitor | 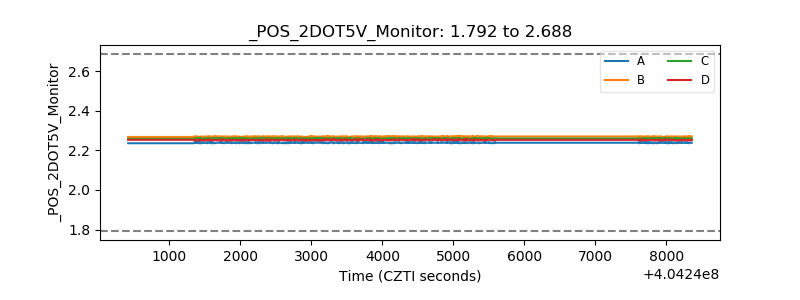 |
| +5 Volts monitor | 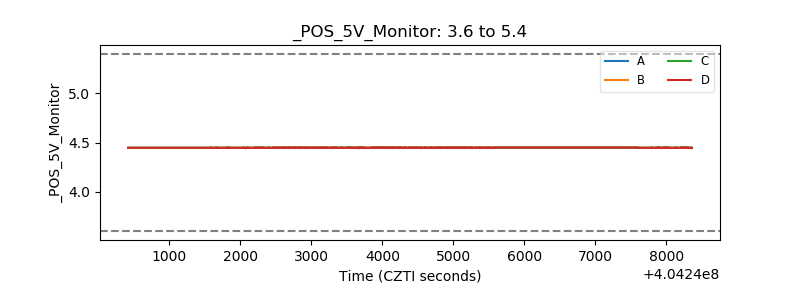 |
| _ROLL_ROT | 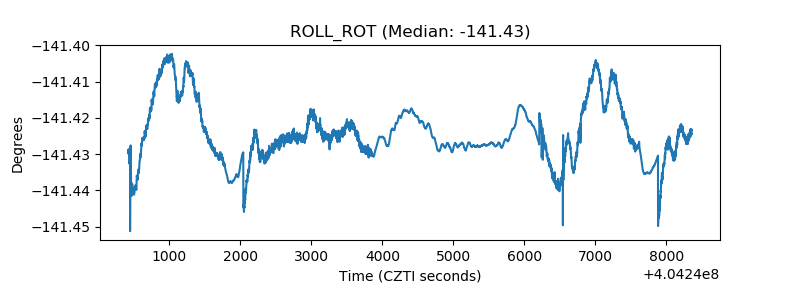 |
| _Roll_DEC | 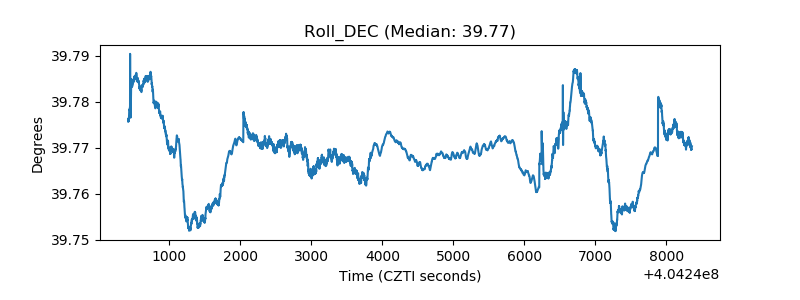 |
| _Roll_RA | 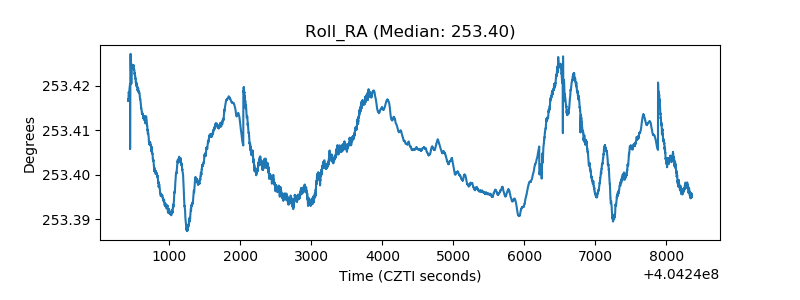 |
| Veto Counter | 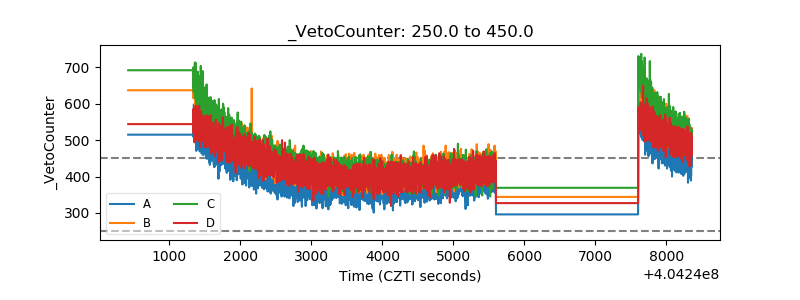 |