| Param | Original file | Final file |
|---|---|---|
| Filename | modeM0/AS1A07_145T01_9000005370_38232cztM0_level2.fits | modeM0/AS1A07_145T01_9000005370_38232cztM0_level2_quad_clean.evt |
| Size (bytes) | 363,519,360 | 93,041,280 |
| Size | 346.7 MB | 88.7 MB |
| Events in quadrant A | 2,951,763 | 624,603 |
| Events in quadrant B | 2,656,763 | 640,227 |
| Events in quadrant C | 2,596,670 | 620,198 |
| Events in quadrant D | 4,847,922 | 568,618 |
| Mode M9 | |||
|---|---|---|---|
| Quadrant | BADHDUFLAG | Total packets | Discarded packets |
| A | 0 | 31 | 0 |
| B | 0 | 31 | 0 |
| C | 0 | 31 | 0 |
| D | 0 | 32 | 0 |
| Mode SS | |||
|---|---|---|---|
| Quadrant | BADHDUFLAG | Total packets | Discarded packets |
| A | 0 | 108 | 0 |
| B | 0 | 108 | 0 |
| C | 0 | 108 | 0 |
| D | 0 | 108 | 0 |
| Mode M0 | |||
|---|---|---|---|
| Quadrant | BADHDUFLAG | Total packets | Discarded packets |
| A | 0 | 11997 | 3 |
| B | 0 | 11248 | 2 |
| C | 0 | 10730 | 2 |
| D | 0 | 18190 | 2 |
| Quadrant | Total seconds | Saturated seconds | Saturation percentage |
|---|---|---|---|
| A | 5188 | 8 | 0.154202% |
| B | 5188 | 58 | 1.117965% |
| C | 5188 | 7 | 0.134927% |
| D | 5188 | 65 | 1.252891% |
Noise dominated data is calculated using 1-second bins in cleaned event files. If a bin has >2000 counts, and if more than 50% of those come from <1% of pixels, then it is considered to be noise-dominated and hence unusable.
| Quadrant | # 1 sec bins | Bins with >0 counts | Bins with >2000 counts | High rate bins dominated by noise | Noise dominated (total time) | Noise dominated (detector-on time) | Marked lightcurve |
|---|---|---|---|---|---|---|---|
| A | 7280 | 5189 | 6 | 6 | 0.08% | 0.12% | 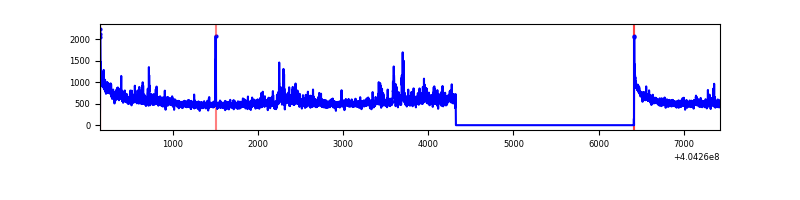 |
| B | 7280 | 5189 | 34 | 34 | 0.47% | 0.66% | 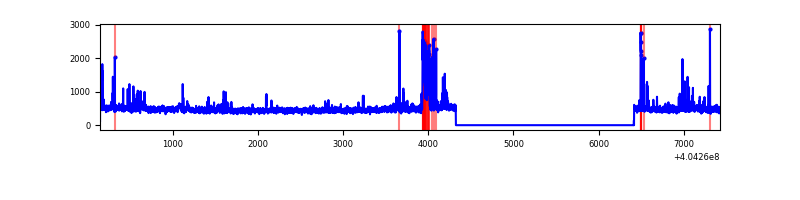 |
| C | 7280 | 5189 | 5 | 5 | 0.07% | 0.10% | 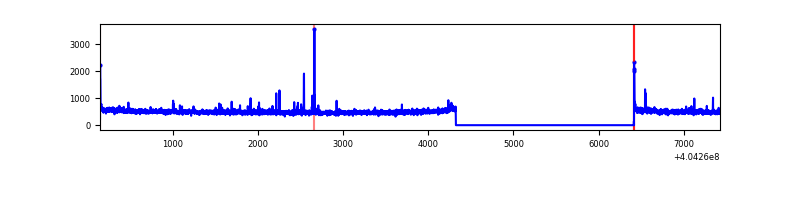 |
| D | 7280 | 5188 | 51 | 51 | 0.70% | 0.98% | 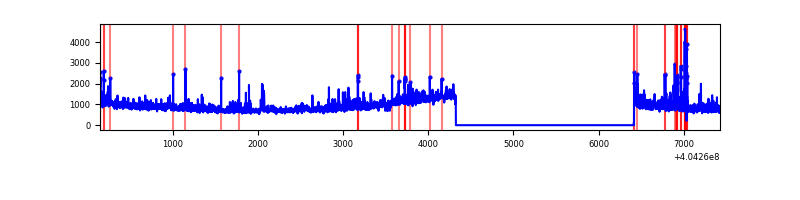 |
Top three noisy pixels from each quadrant. If the there are fewer than three noisy pixels in the level2.evt file, extra rows are filled as -1
| Pixel properties | Quadrant properties | ||||||
|---|---|---|---|---|---|---|---|
| Quadrant | DetID | PixID | Counts | Sigma | Mean | Median | Sigma |
| A | 10 | 83 | 369887 | 3110.96 | 596 | 584 | 118.7 |
| A | 12 | 16 | 160677 | 1348.6 | 596 | 584 | 118.7 |
| A | 12 | 189 | 80489 | 673.11 | 596 | 584 | 118.7 |
| B | 5 | 172 | 260283 | 2284.24 | 595 | 579 | 113.7 |
| B | 0 | 229 | 29815 | 257.15 | 595 | 579 | 113.7 |
| B | 12 | 111 | 13995 | 118.0 | 595 | 579 | 113.7 |
| C | 15 | 214 | 218497 | 1615.81 | 585 | 589 | 134.9 |
| C | 14 | 254 | 35339 | 257.67 | 585 | 589 | 134.9 |
| C | 0 | 10 | 19214 | 138.11 | 585 | 589 | 134.9 |
| D | 10 | 203 | 2002290 | 14217.69 | 577 | 561 | 140.8 |
| D | 7 | 223 | 264880 | 1877.38 | 577 | 561 | 140.8 |
| D | 13 | 249 | 138854 | 982.25 | 577 | 561 | 140.8 |
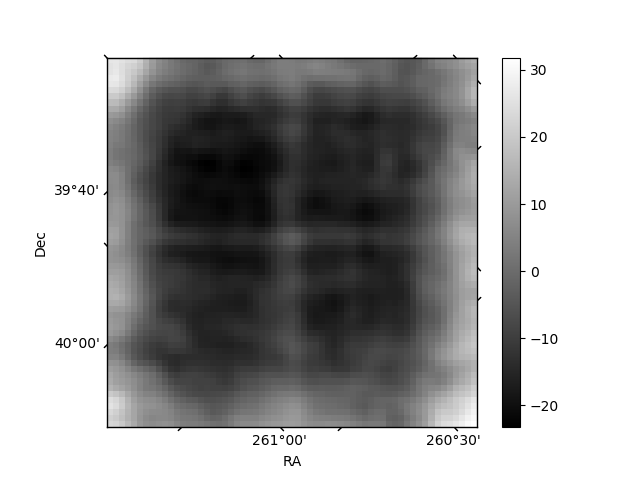
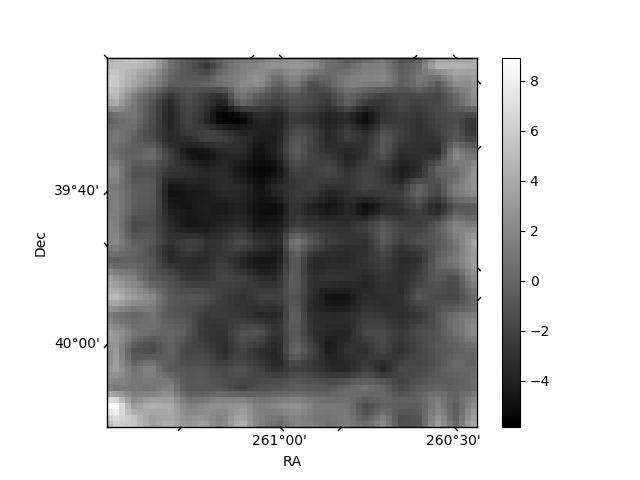
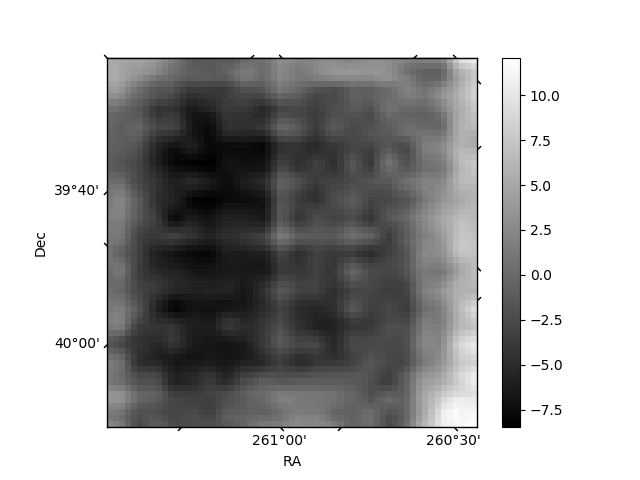
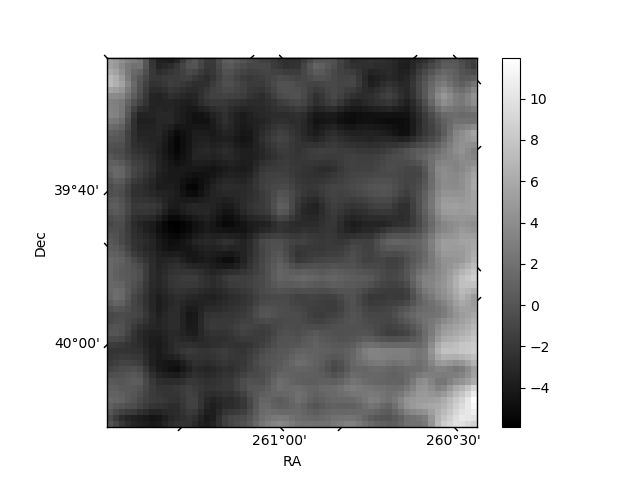
Histogram calculated using DETX and DETY for each event in the final _common_clean file
| Quadrant A | 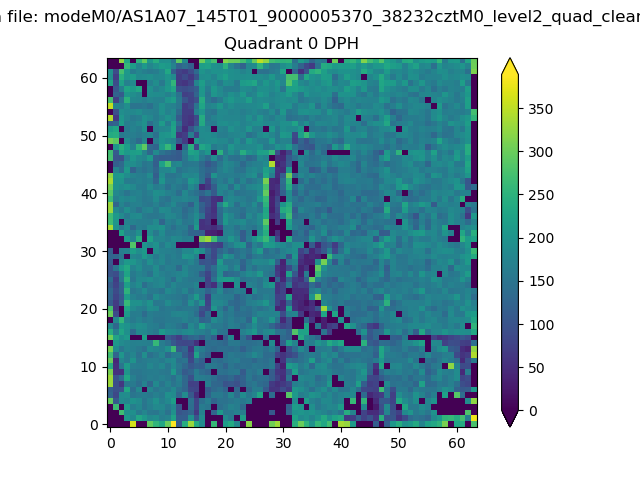 |
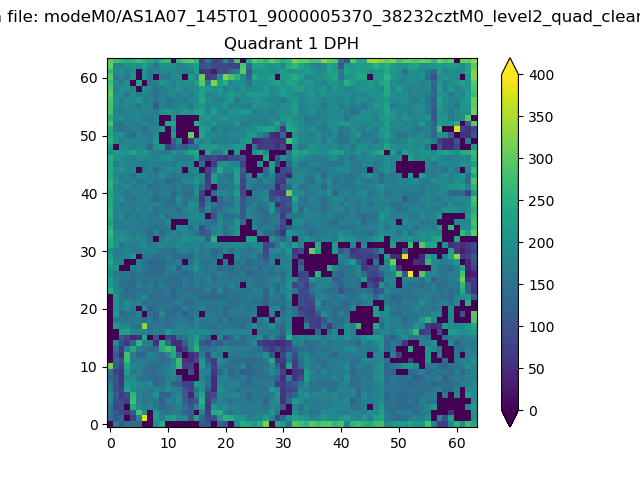 |
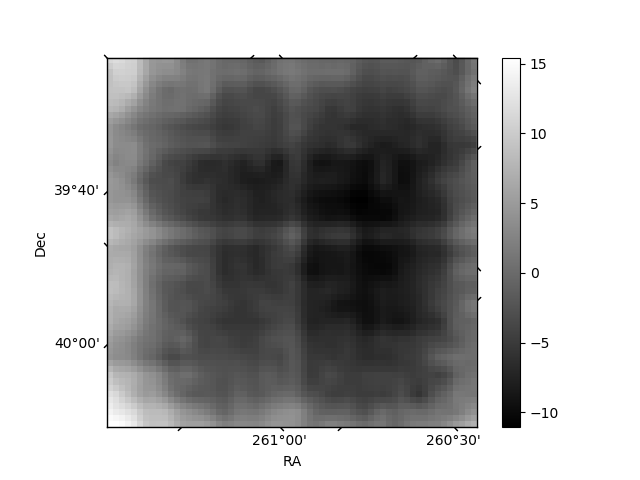
Quadrant B |
|---|---|---|---|
| Quadrant D | 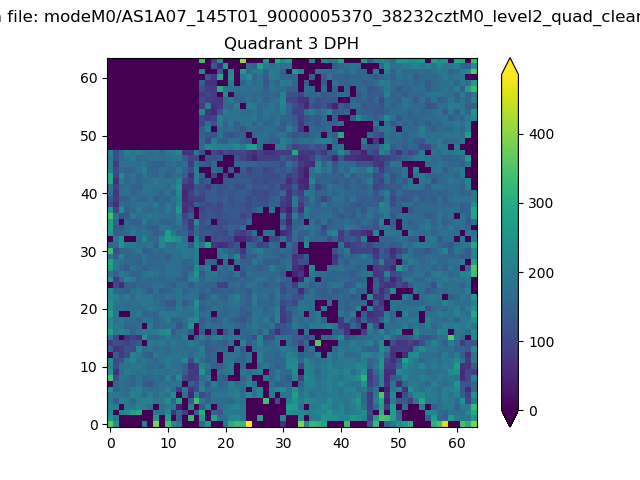 |
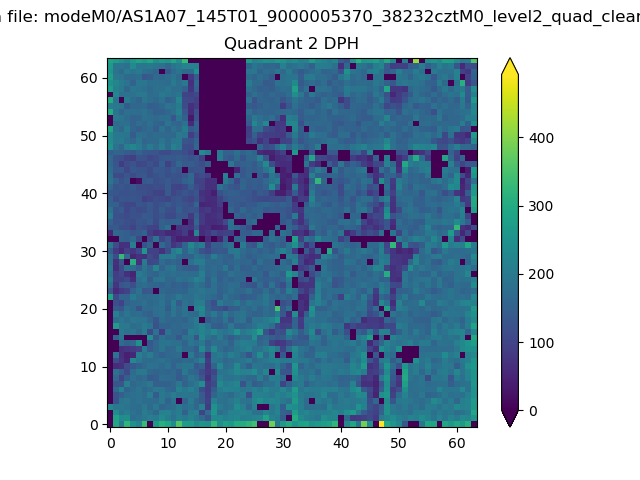 |
Quadrant C |
| Plot type | Count rate plots | Images |
|---|---|---|
| Comparison with Poisson distribution Blue bars denote a histogram of data divided into 1 sec bins. Red curve is a Poisson curve with rate = median count rate of data. |
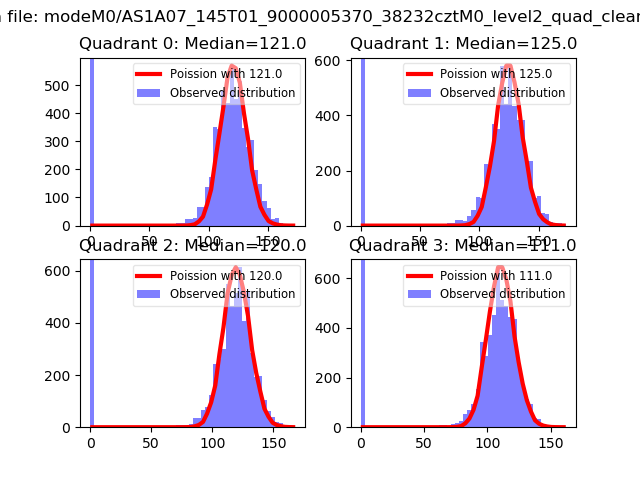 |
 |
| Quadrant-wise count rates Data is divided into 100 sec bins |
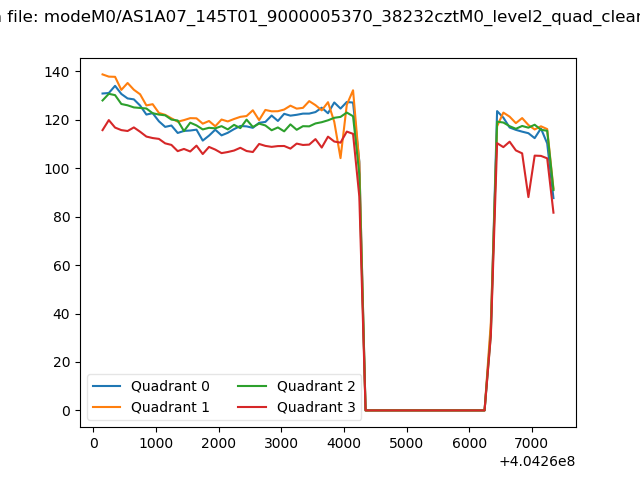 |
|
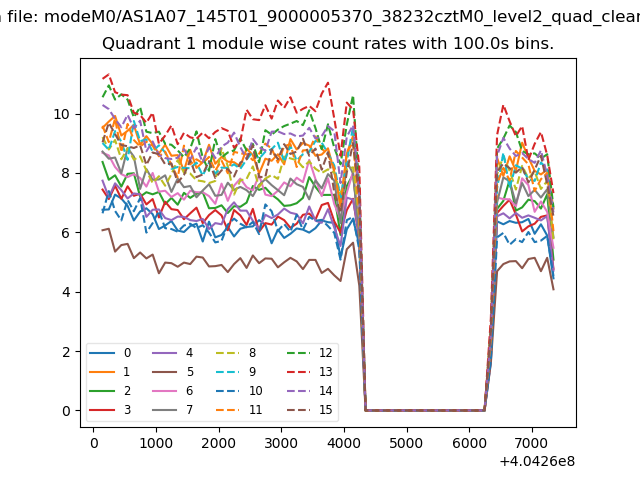
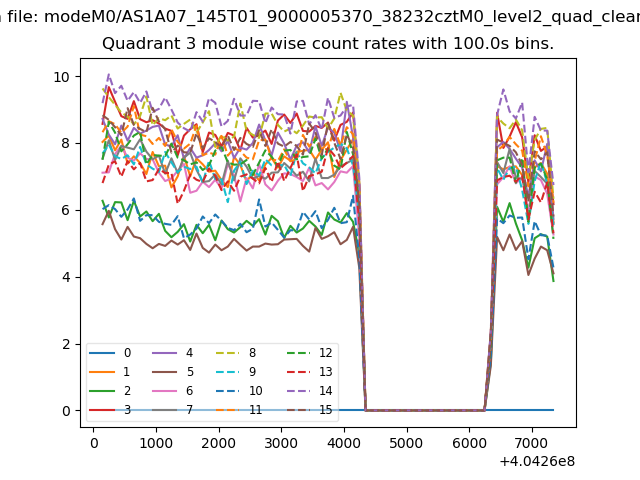
| Module-wise count rates for Quadrant A Data is divided into 100 sec bins |
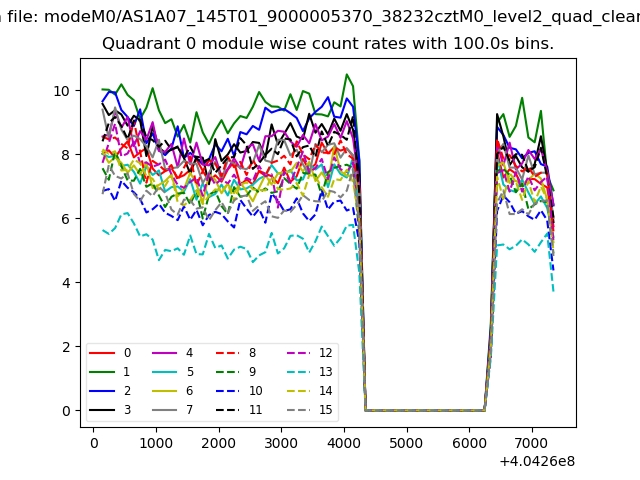 |
 |
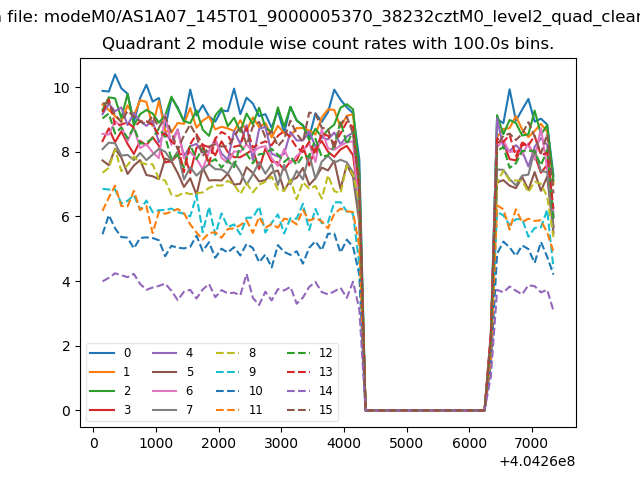
| Module-wise count rates for Quadrant B Data is divided into 100 sec bins |
 |
 |
| Module-wise count rates for Quadrant C Data is divided into 100 sec bins |
 |
 |
| Module-wise count rates for Quadrant D Data is divided into 100 sec bins |
 |
 |
| Parameter | Plot |
|---|---|
| CZT HV Monitor | 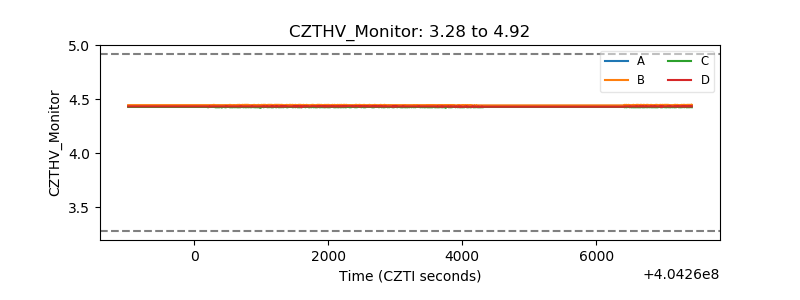 |
| D_VDD | 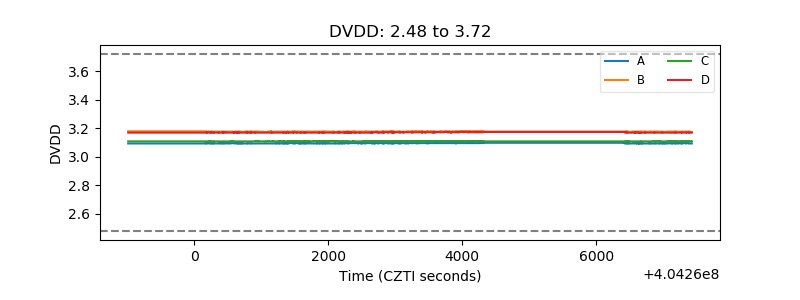 |
| Temperature 1 | 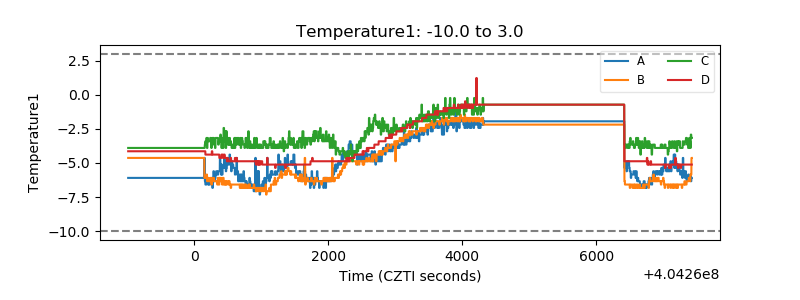 |
| Veto HV Monitor | 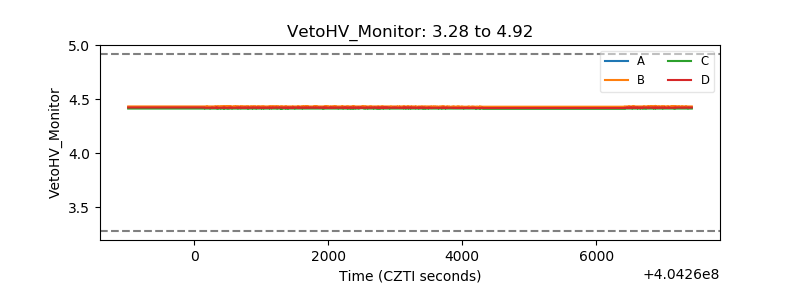 |
| Veto LLD | 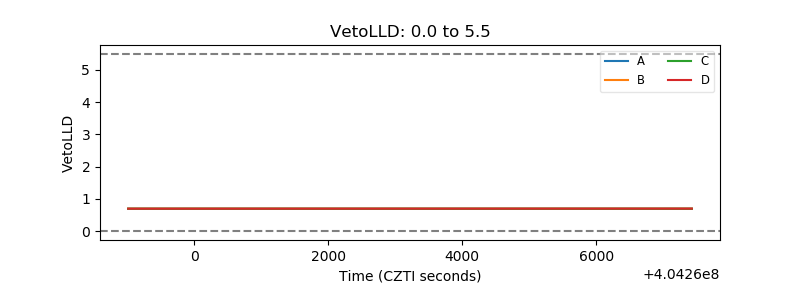 |
| Alpha Counter | 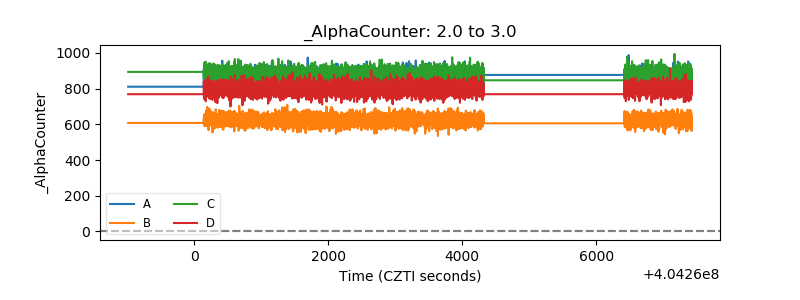 |
| _CPM_Rate | 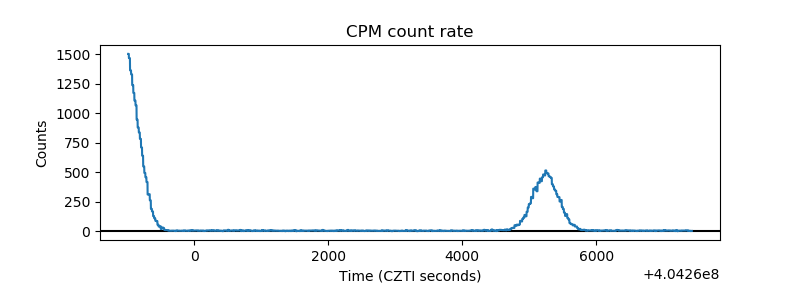 |
| CZT Counter | 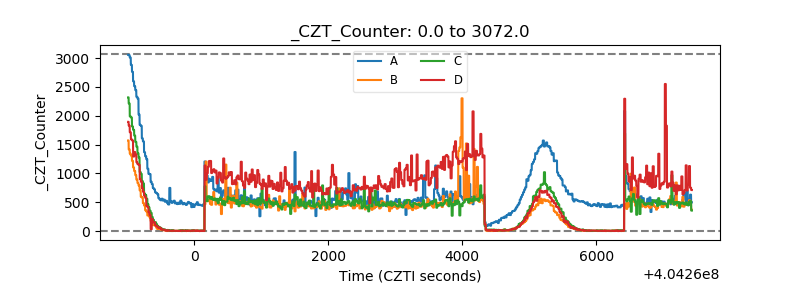 |
| +2.5 Volts monitor | 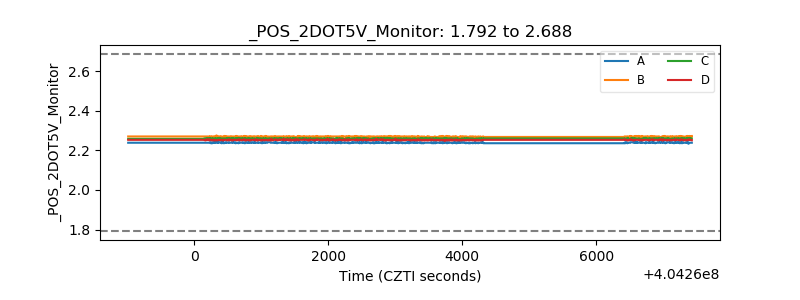 |
| +5 Volts monitor | 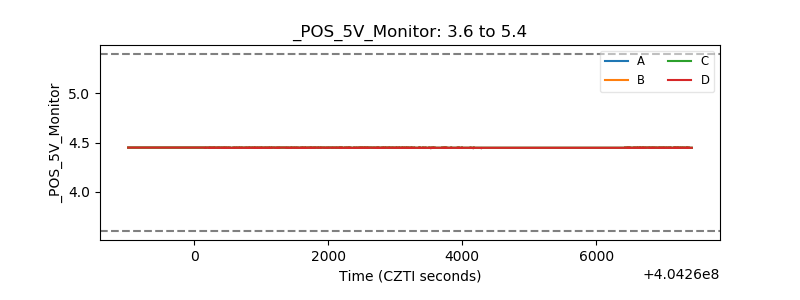 |
| _ROLL_ROT | 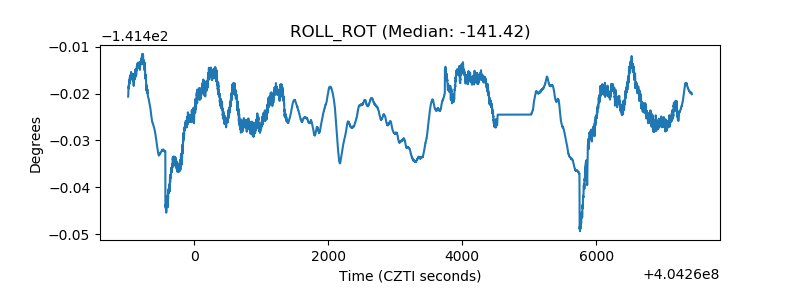 |
| _Roll_DEC | 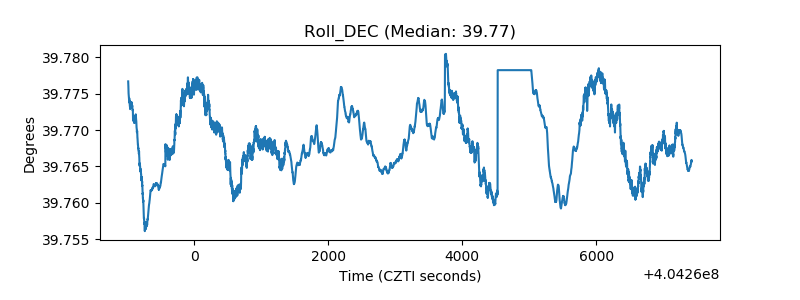 |
| _Roll_RA | 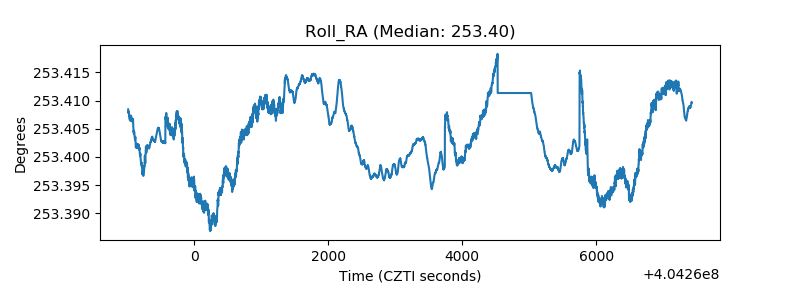 |
| Veto Counter | 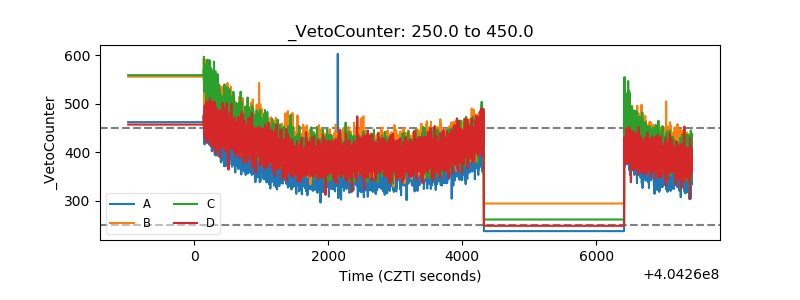 |