| Param | Original file | Final file |
|---|---|---|
| Filename | modeM0/AS1A07_145T01_9000005370_38233cztM0_level2.fits | modeM0/AS1A07_145T01_9000005370_38233cztM0_level2_quad_clean.evt |
| Size (bytes) | 363,882,240 | 90,411,840 |
| Size | 347.0 MB | 86.2 MB |
| Events in quadrant A | 2,805,840 | 604,111 |
| Events in quadrant B | 2,700,715 | 621,070 |
| Events in quadrant C | 2,610,098 | 600,054 |
| Events in quadrant D | 4,945,232 | 544,771 |
| Mode M9 | |||
|---|---|---|---|
| Quadrant | BADHDUFLAG | Total packets | Discarded packets |
| A | 0 | 31 | 0 |
| B | 0 | 31 | 0 |
| C | 0 | 31 | 0 |
| D | 0 | 32 | 0 |
| Mode SS | |||
|---|---|---|---|
| Quadrant | BADHDUFLAG | Total packets | Discarded packets |
| A | 0 | 108 | 0 |
| B | 0 | 108 | 0 |
| C | 0 | 108 | 0 |
| D | 0 | 108 | 0 |
| Mode M0 | |||
|---|---|---|---|
| Quadrant | BADHDUFLAG | Total packets | Discarded packets |
| A | 0 | 11401 | 3 |
| B | 0 | 11518 | 2 |
| C | 0 | 10930 | 2 |
| D | 0 | 18514 | 2 |
| Quadrant | Total seconds | Saturated seconds | Saturation percentage |
|---|---|---|---|
| A | 5245 | 10 | 0.190658% |
| B | 5245 | 32 | 0.610105% |
| C | 5245 | 16 | 0.305052% |
| D | 5245 | 140 | 2.669209% |
Noise dominated data is calculated using 1-second bins in cleaned event files. If a bin has >2000 counts, and if more than 50% of those come from <1% of pixels, then it is considered to be noise-dominated and hence unusable.
| Quadrant | # 1 sec bins | Bins with >0 counts | Bins with >2000 counts | High rate bins dominated by noise | Noise dominated (total time) | Noise dominated (detector-on time) | Marked lightcurve |
|---|---|---|---|---|---|---|---|
| A | 7156 | 5246 | 6 | 6 | 0.08% | 0.11% | 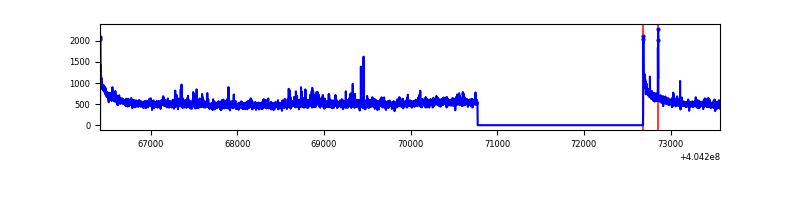 |
| B | 7156 | 5246 | 20 | 20 | 0.28% | 0.38% | 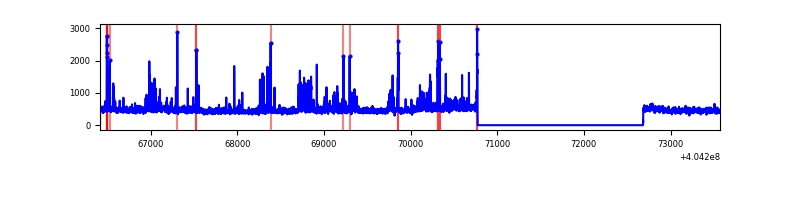 |
| C | 7156 | 5246 | 12 | 12 | 0.17% | 0.23% | 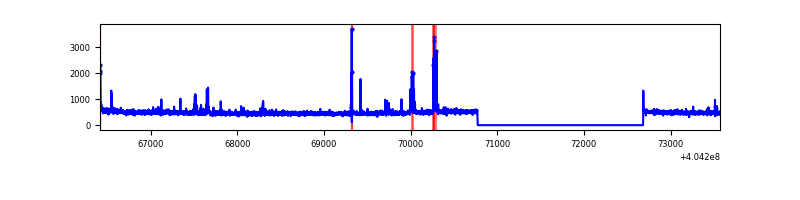 |
| D | 7156 | 5245 | 113 | 113 | 1.58% | 2.15% | 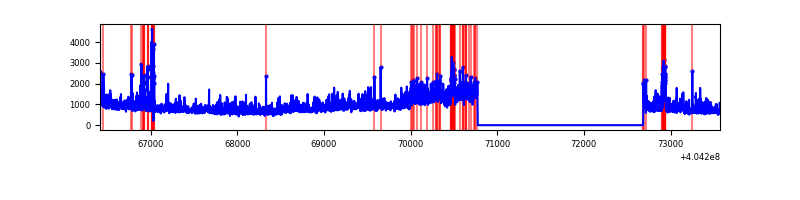 |
Top three noisy pixels from each quadrant. If the there are fewer than three noisy pixels in the level2.evt file, extra rows are filled as -1
| Pixel properties | Quadrant properties | ||||||
|---|---|---|---|---|---|---|---|
| Quadrant | DetID | PixID | Counts | Sigma | Mean | Median | Sigma |
| A | 10 | 83 | 378168 | 3158.1 | 590 | 578 | 119.6 |
| A | 12 | 189 | 60612 | 502.11 | 590 | 578 | 119.6 |
| A | 12 | 16 | 59457 | 492.45 | 590 | 578 | 119.6 |
| B | 5 | 172 | 290452 | 2572.68 | 586 | 570 | 112.7 |
| B | 0 | 229 | 48710 | 427.24 | 586 | 570 | 112.7 |
| B | 4 | 141 | 35002 | 305.58 | 586 | 570 | 112.7 |
| C | 15 | 214 | 220165 | 1632.34 | 575 | 579 | 134.5 |
| C | 14 | 254 | 50301 | 369.62 | 575 | 579 | 134.5 |
| C | 1 | 23 | 37837 | 276.96 | 575 | 579 | 134.5 |
| D | 10 | 203 | 1749410 | 12542.59 | 568 | 552 | 139.4 |
| D | 7 | 223 | 478685 | 3429.11 | 568 | 552 | 139.4 |
| D | 12 | 233 | 135036 | 964.5 | 568 | 552 | 139.4 |
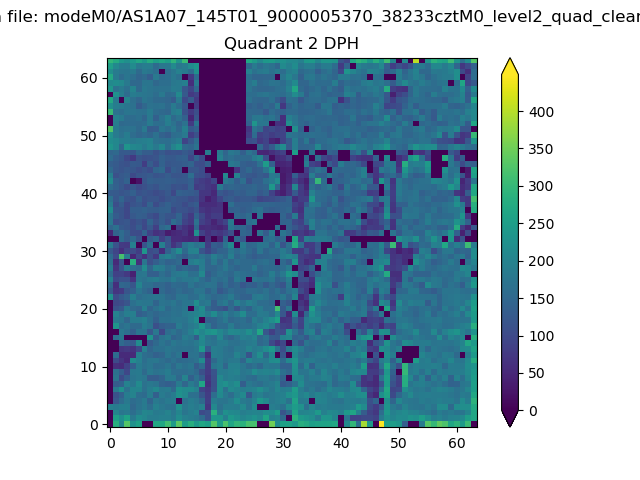
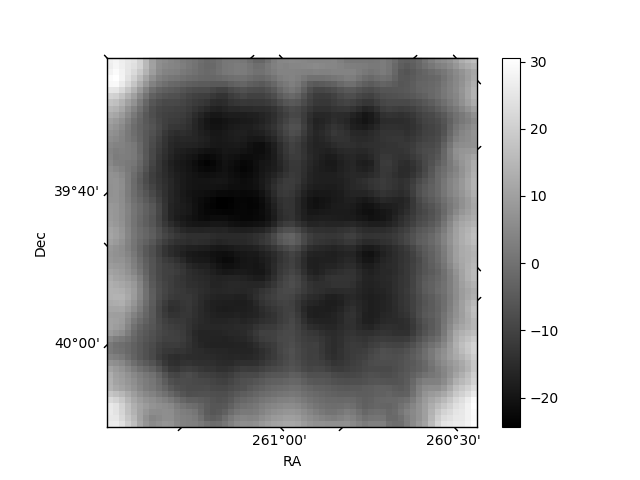
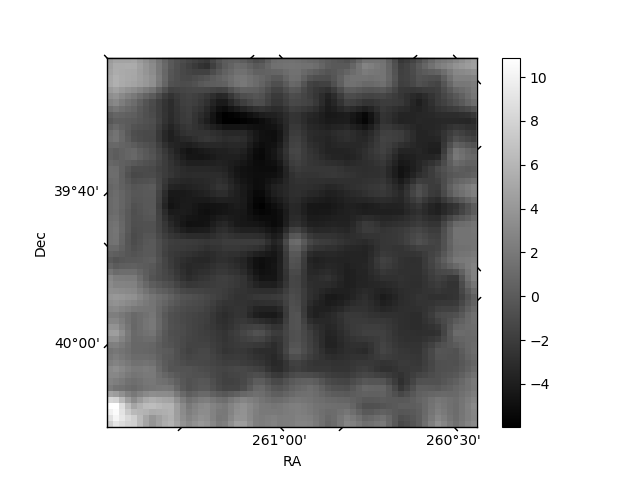
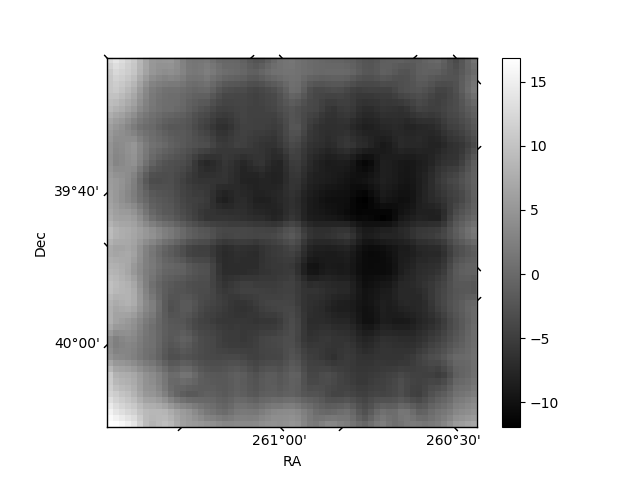
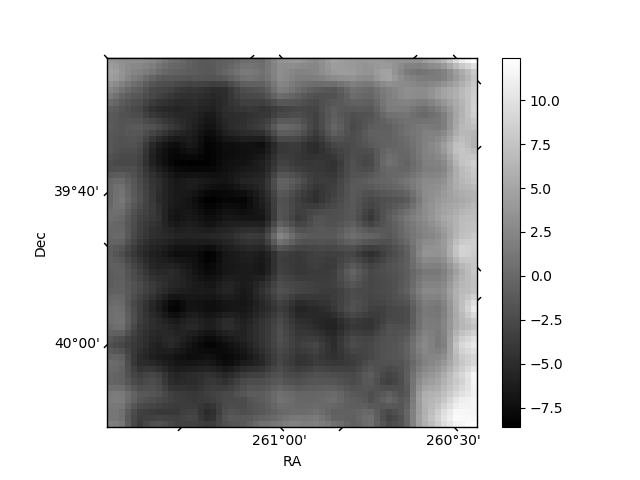
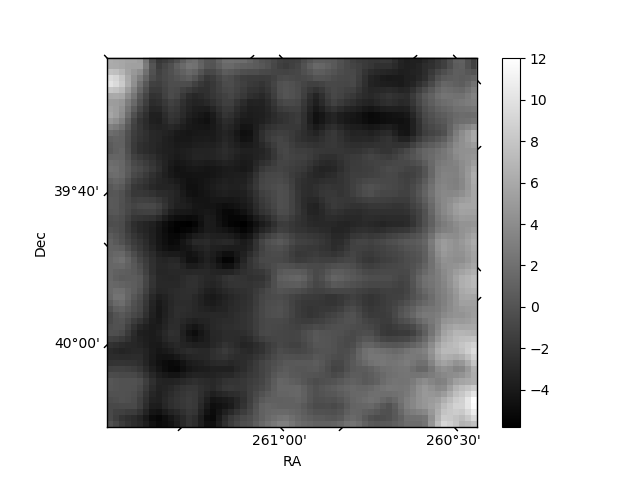
Histogram calculated using DETX and DETY for each event in the final _common_clean file
| Quadrant A | 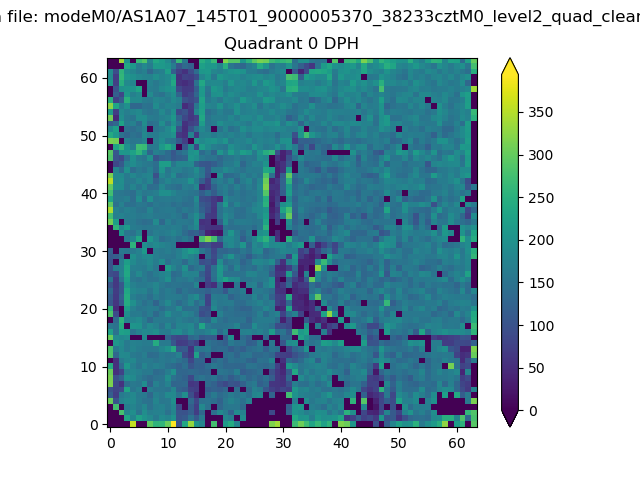 |
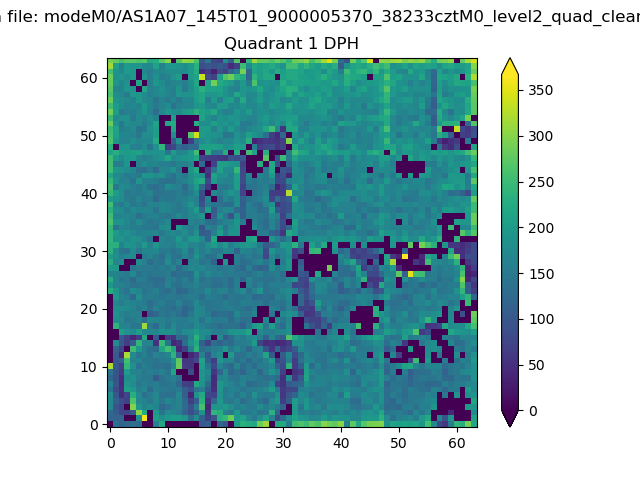 |
Quadrant B |
|---|---|---|---|
| Quadrant D | 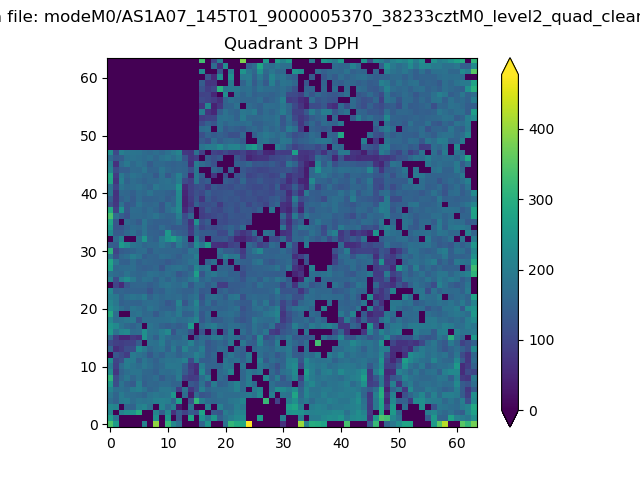 |
 |
Quadrant C |
| Plot type | Count rate plots | Images |
|---|---|---|
| Comparison with Poisson distribution Blue bars denote a histogram of data divided into 1 sec bins. Red curve is a Poisson curve with rate = median count rate of data. |
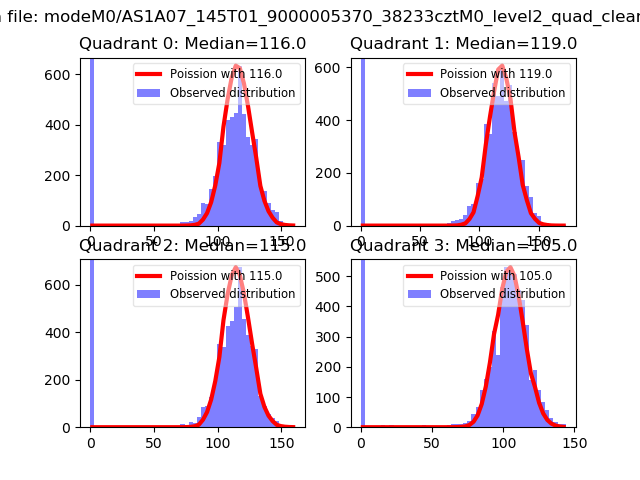 |
 |
| Quadrant-wise count rates Data is divided into 100 sec bins |
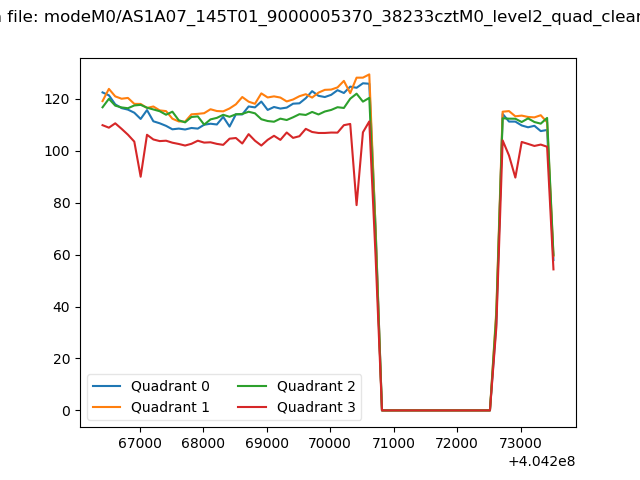 |
|
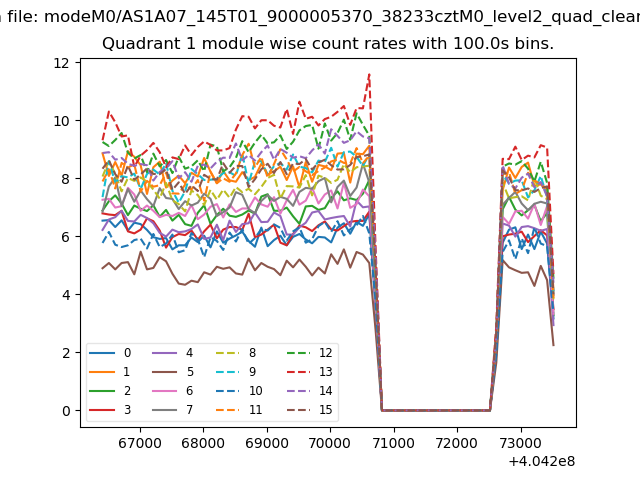
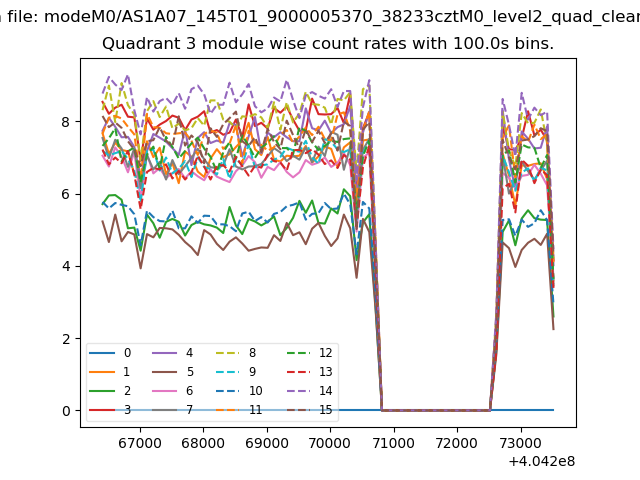
| Module-wise count rates for Quadrant A Data is divided into 100 sec bins |
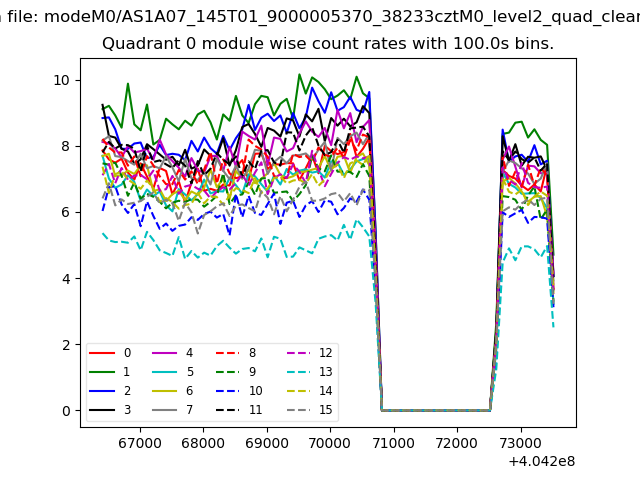 |
 |
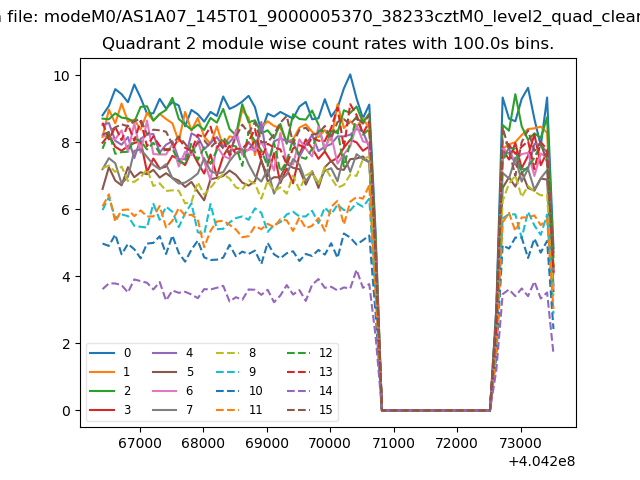
| Module-wise count rates for Quadrant B Data is divided into 100 sec bins |
 |
 |
| Module-wise count rates for Quadrant C Data is divided into 100 sec bins |
 |
 |
| Module-wise count rates for Quadrant D Data is divided into 100 sec bins |
 |
 |
| Parameter | Plot |
|---|---|
| CZT HV Monitor | 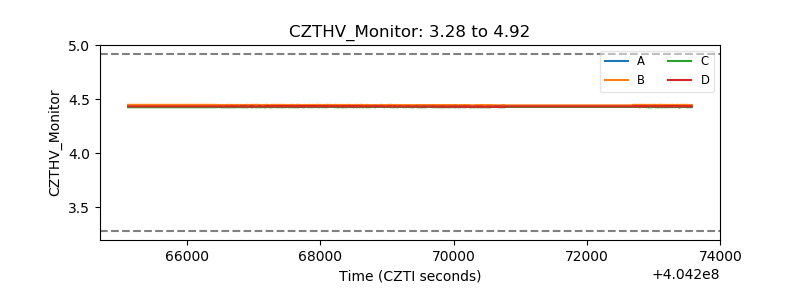 |
| D_VDD | 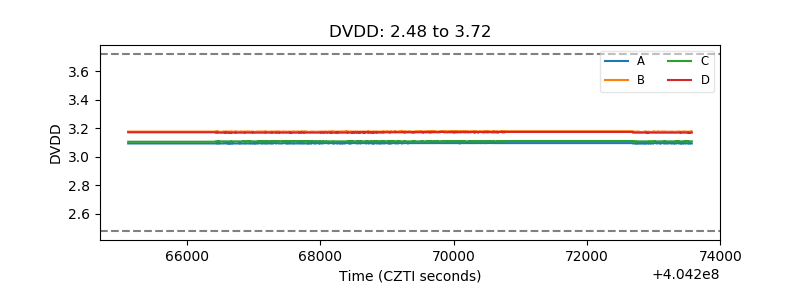 |
| Temperature 1 | 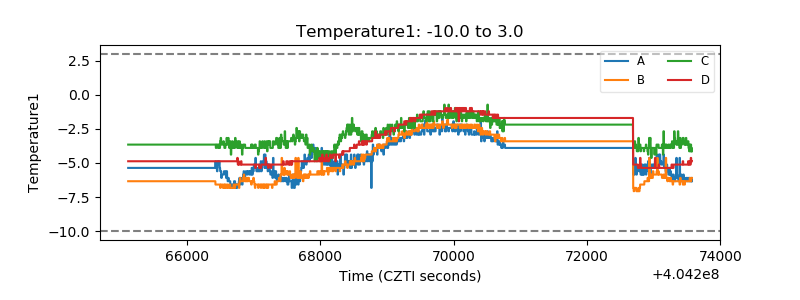 |
| Veto HV Monitor | 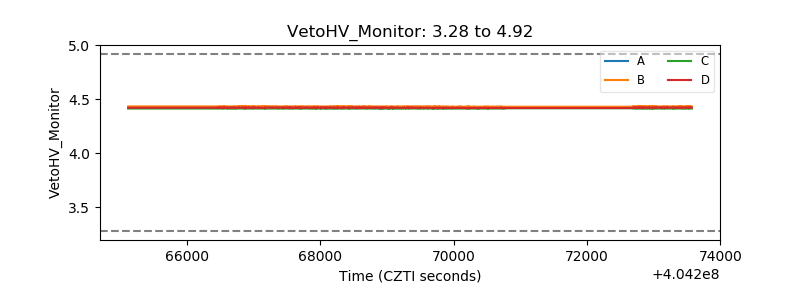 |
| Veto LLD | 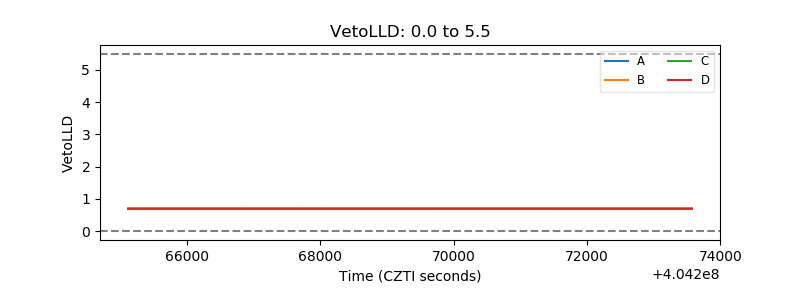 |
| Alpha Counter | 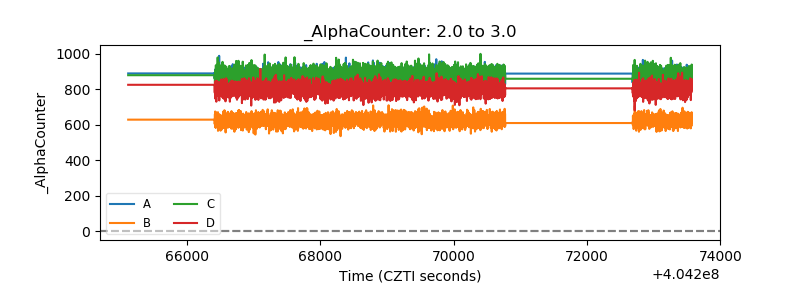 |
| _CPM_Rate | 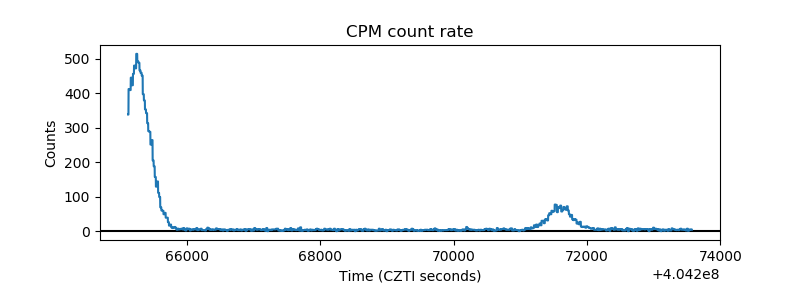 |
| CZT Counter | 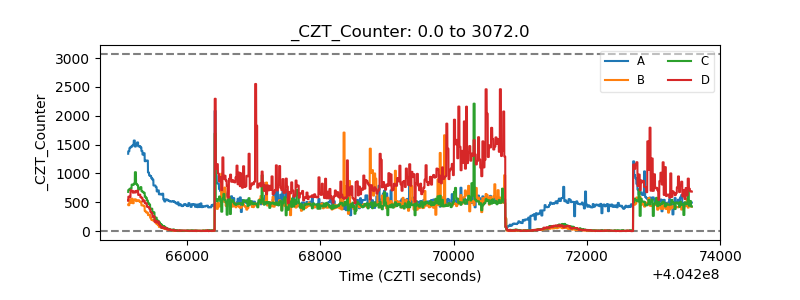 |
| +2.5 Volts monitor | 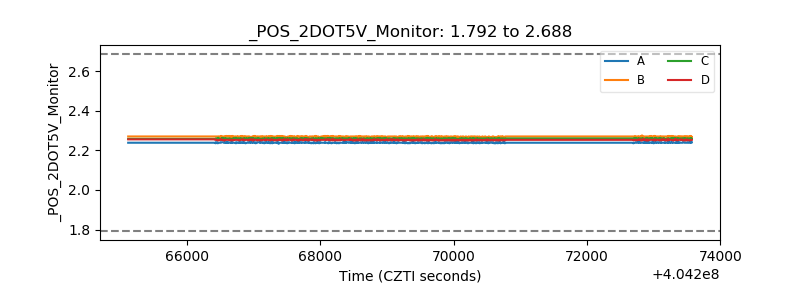 |
| +5 Volts monitor | 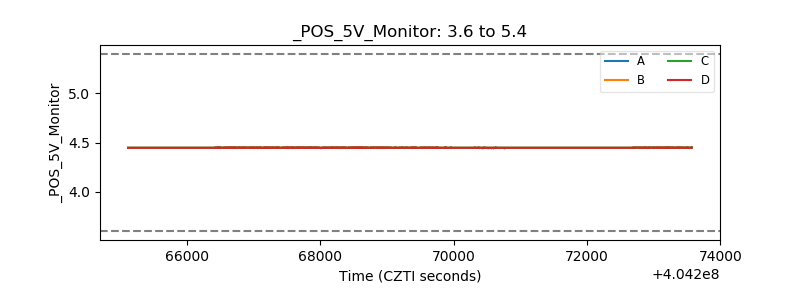 |
| _ROLL_ROT | 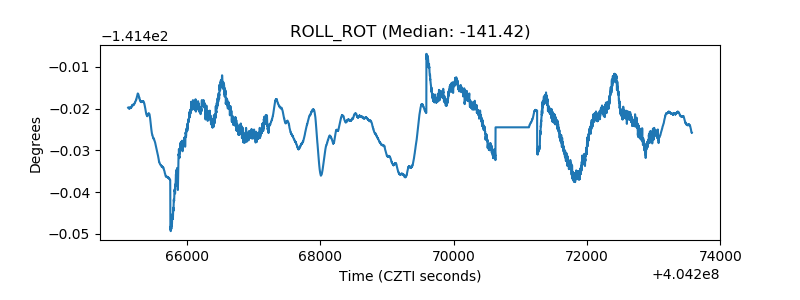 |
| _Roll_DEC | 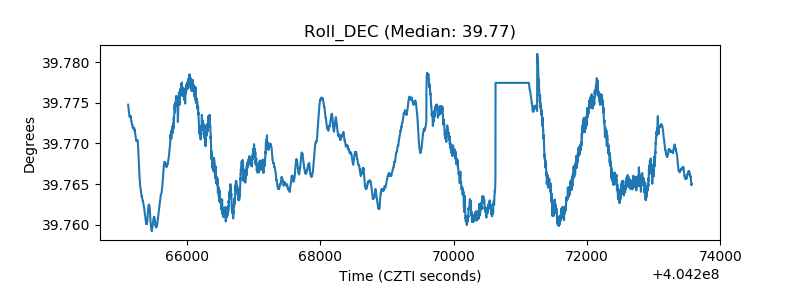 |
| _Roll_RA | 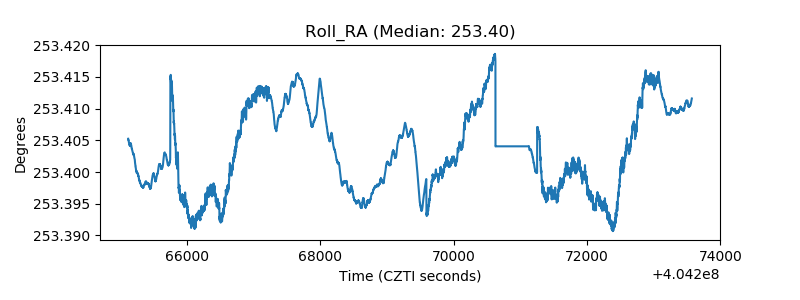 |
| Veto Counter | 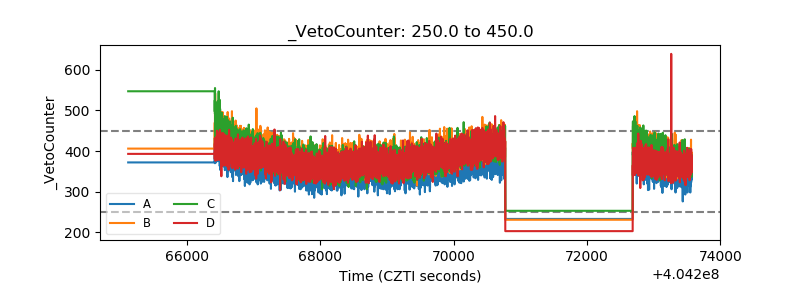 |