| Param | Original file | Final file |
|---|---|---|
| Filename | modeM0/AS1A07_145T01_9000005370_38234cztM0_level2.fits | modeM0/AS1A07_145T01_9000005370_38234cztM0_level2_quad_clean.evt |
| Size (bytes) | 372,562,560 | 93,798,720 |
| Size | 355.3 MB | 89.5 MB |
| Events in quadrant A | 2,906,314 | 623,652 |
| Events in quadrant B | 2,501,355 | 647,985 |
| Events in quadrant C | 2,653,399 | 617,539 |
| Events in quadrant D | 5,297,346 | 562,200 |
| Mode M9 | |||
|---|---|---|---|
| Quadrant | BADHDUFLAG | Total packets | Discarded packets |
| A | 0 | 30 | 0 |
| B | 0 | 30 | 0 |
| C | 0 | 30 | 0 |
| D | 0 | 31 | 0 |
| Mode SS | |||
|---|---|---|---|
| Quadrant | BADHDUFLAG | Total packets | Discarded packets |
| A | 0 | 112 | 0 |
| B | 0 | 112 | 0 |
| C | 0 | 112 | 0 |
| D | 0 | 112 | 0 |
| Mode M0 | |||
|---|---|---|---|
| Quadrant | BADHDUFLAG | Total packets | Discarded packets |
| A | 0 | 11963 | 3 |
| B | 0 | 11244 | 2 |
| C | 0 | 11303 | 2 |
| D | 0 | 19822 | 2 |
| Quadrant | Total seconds | Saturated seconds | Saturation percentage |
|---|---|---|---|
| A | 5564 | 20 | 0.359454% |
| B | 5564 | 5 | 0.089863% |
| C | 5564 | 12 | 0.215672% |
| D | 5564 | 150 | 2.695902% |
Noise dominated data is calculated using 1-second bins in cleaned event files. If a bin has >2000 counts, and if more than 50% of those come from <1% of pixels, then it is considered to be noise-dominated and hence unusable.
| Quadrant | # 1 sec bins | Bins with >0 counts | Bins with >2000 counts | High rate bins dominated by noise | Noise dominated (total time) | Noise dominated (detector-on time) | Marked lightcurve |
|---|---|---|---|---|---|---|---|
| A | 7117 | 5565 | 12 | 12 | 0.17% | 0.22% | 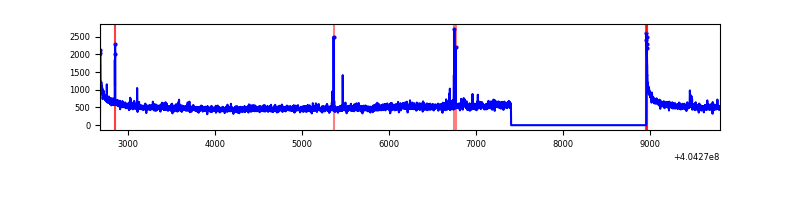 |
| B | 7117 | 5565 | 0 | 0 | 0.00% | 0.00% | 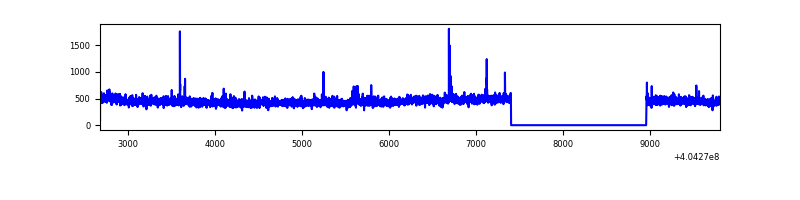 |
| C | 7117 | 5565 | 8 | 8 | 0.11% | 0.14% | 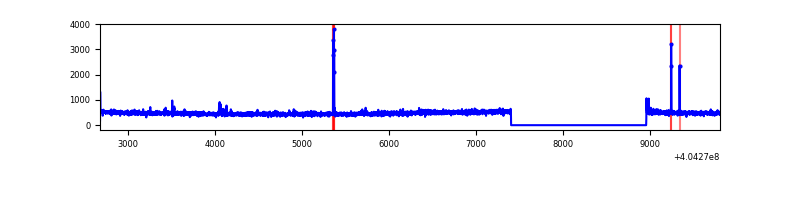 |
| D | 7117 | 5565 | 133 | 133 | 1.87% | 2.39% | 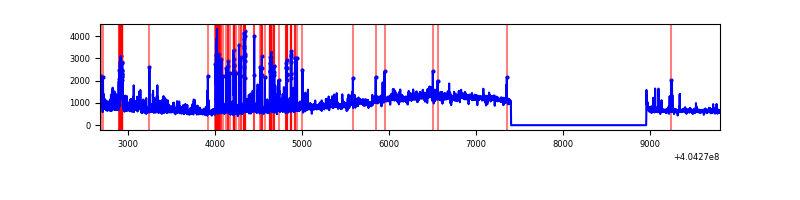 |
Top three noisy pixels from each quadrant. If the there are fewer than three noisy pixels in the level2.evt file, extra rows are filled as -1
| Pixel properties | Quadrant properties | ||||||
|---|---|---|---|---|---|---|---|
| Quadrant | DetID | PixID | Counts | Sigma | Mean | Median | Sigma |
| A | 10 | 83 | 390072 | 3072.08 | 620 | 606 | 126.8 |
| A | 12 | 189 | 66608 | 520.62 | 620 | 606 | 126.8 |
| A | 9 | 143 | 14521 | 109.76 | 620 | 606 | 126.8 |
| B | 5 | 172 | 32097 | 261.42 | 619 | 601 | 120.5 |
| B | 12 | 111 | 14914 | 118.8 | 619 | 601 | 120.5 |
| B | 11 | 111 | 13963 | 110.91 | 619 | 601 | 120.5 |
| C | 15 | 214 | 231724 | 1629.65 | 607 | 610 | 141.8 |
| C | 15 | 159 | 28689 | 197.99 | 607 | 610 | 141.8 |
| C | 5 | 250 | 8723 | 57.21 | 607 | 610 | 141.8 |
| D | 10 | 203 | 2093469 | 14279.91 | 597 | 579 | 146.6 |
| D | 12 | 235 | 338797 | 2307.68 | 597 | 579 | 146.6 |
| D | 7 | 223 | 284816 | 1939.37 | 597 | 579 | 146.6 |
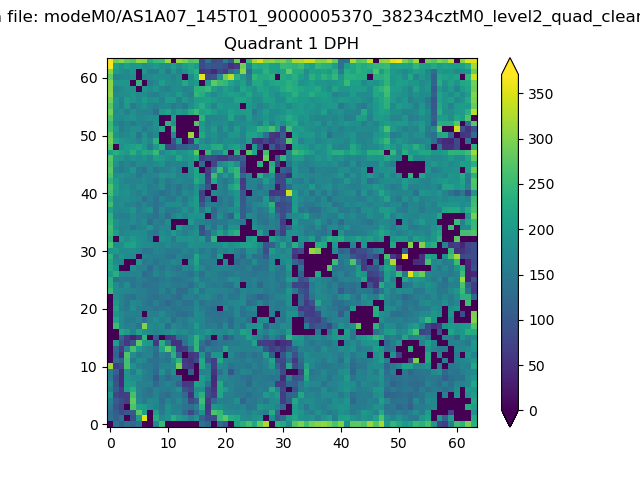
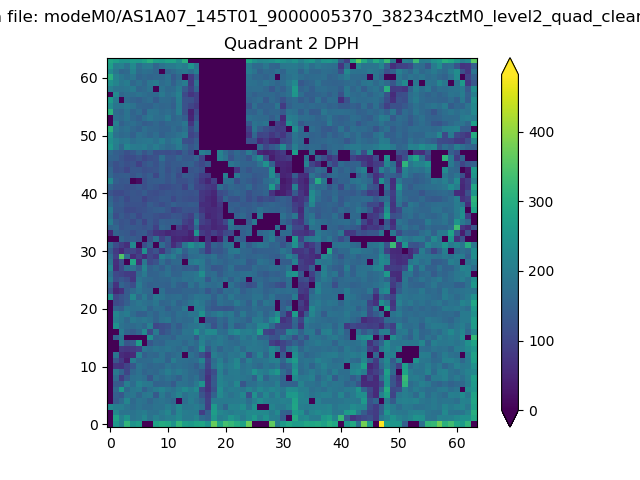
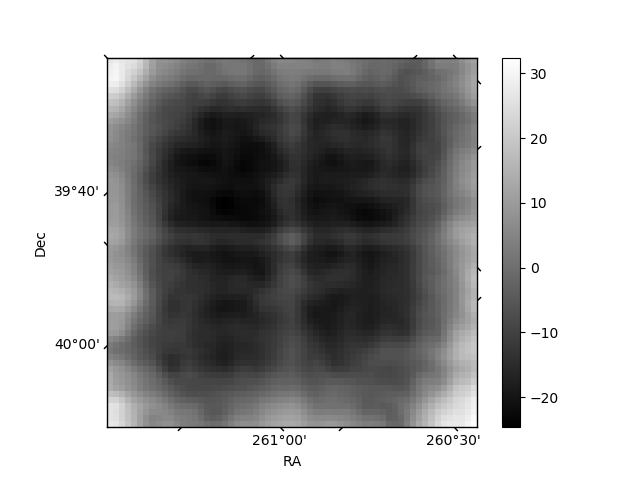
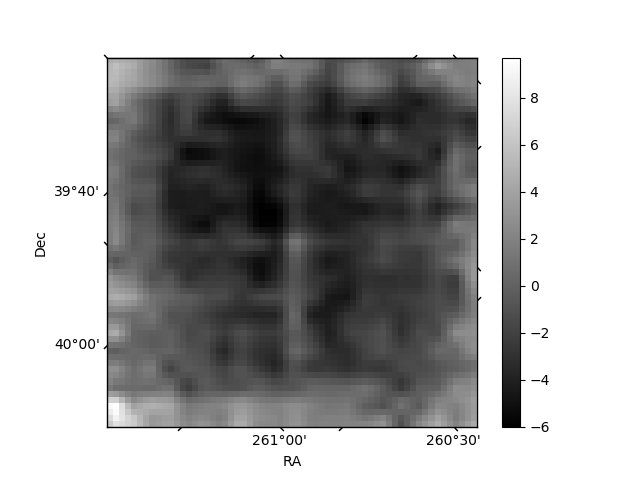
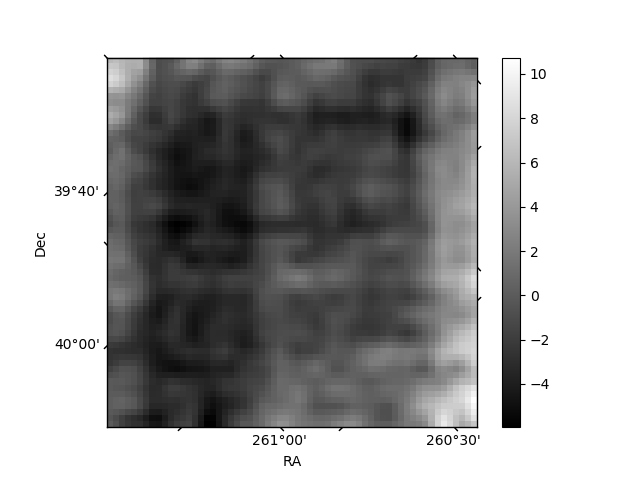
Histogram calculated using DETX and DETY for each event in the final _common_clean file
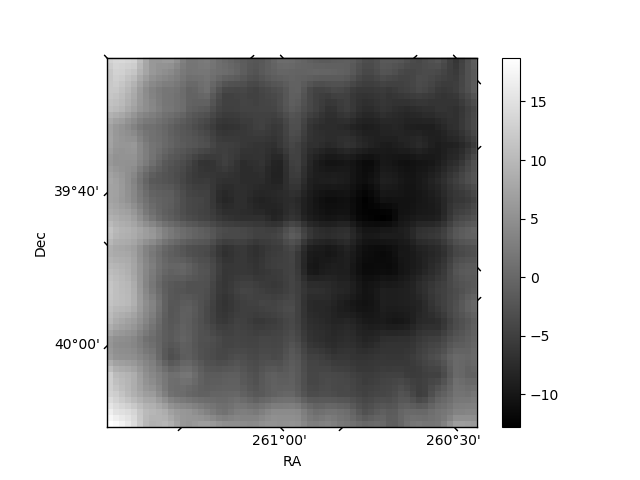
| Quadrant A |  |
 |
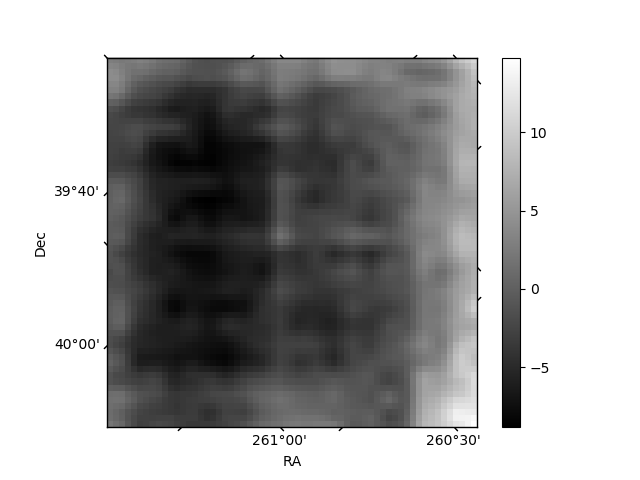
Quadrant B |
|---|---|---|---|
| Quadrant D | 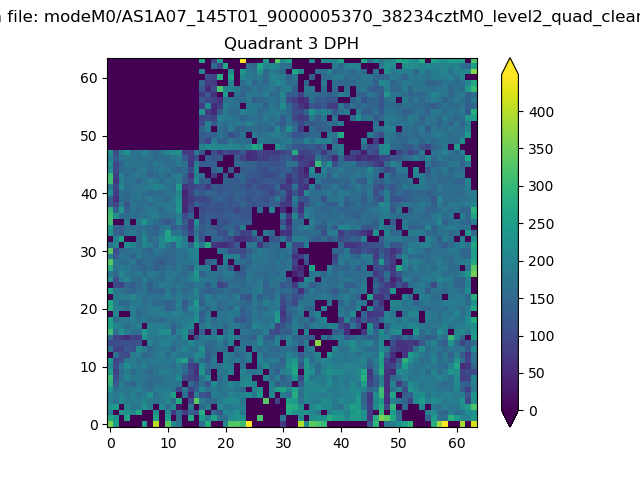 |
 |
Quadrant C |
| Plot type | Count rate plots | Images |
|---|---|---|
| Comparison with Poisson distribution Blue bars denote a histogram of data divided into 1 sec bins. Red curve is a Poisson curve with rate = median count rate of data. |
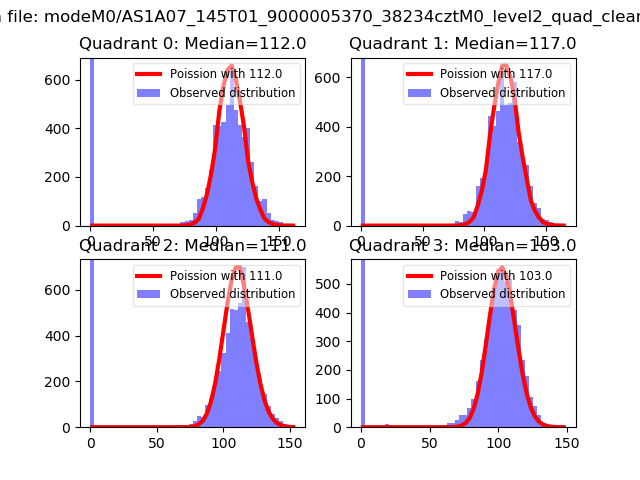 |
 |
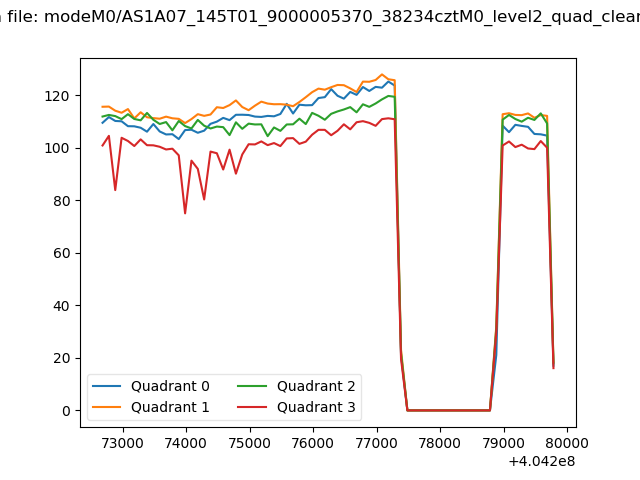
| Quadrant-wise count rates Data is divided into 100 sec bins |
 |
|
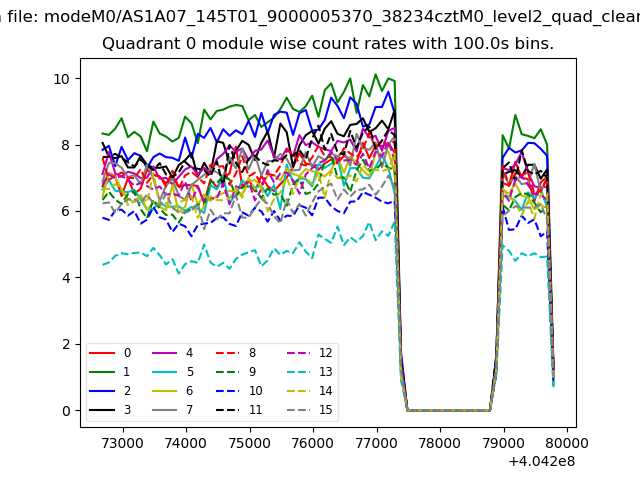
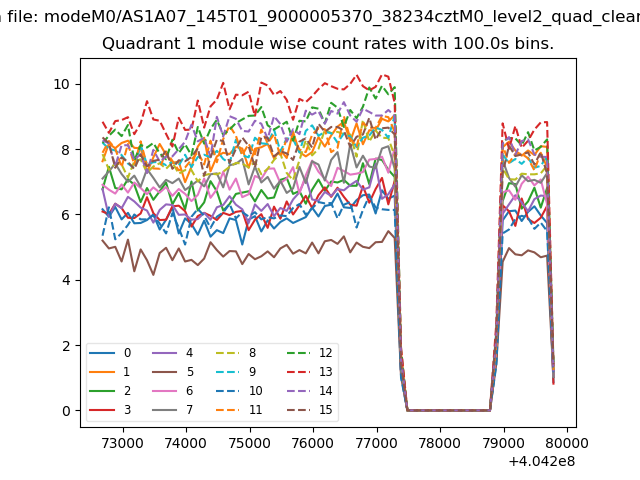
| Module-wise count rates for Quadrant A Data is divided into 100 sec bins |
 |
 |
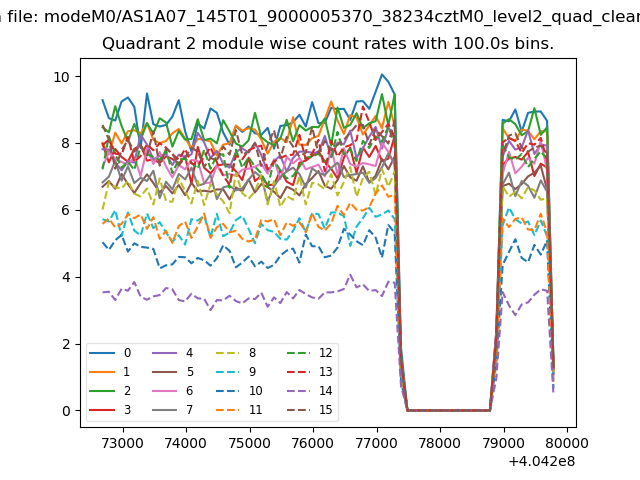
| Module-wise count rates for Quadrant B Data is divided into 100 sec bins |
 |
 |
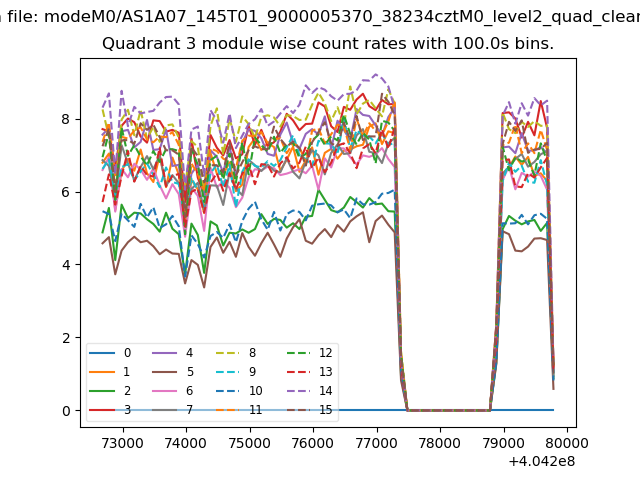
| Module-wise count rates for Quadrant C Data is divided into 100 sec bins |
 |
 |
| Module-wise count rates for Quadrant D Data is divided into 100 sec bins |
 |
 |
| Parameter | Plot |
|---|---|
| CZT HV Monitor | 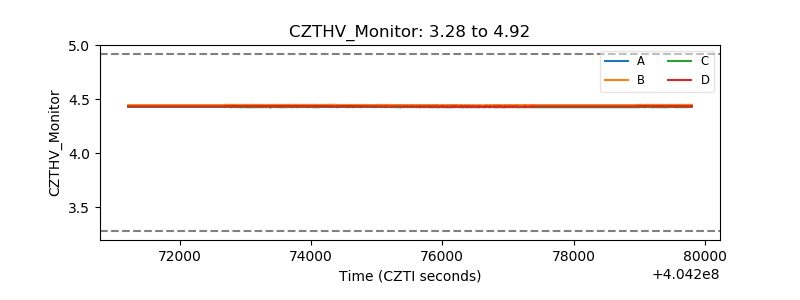 |
| D_VDD | 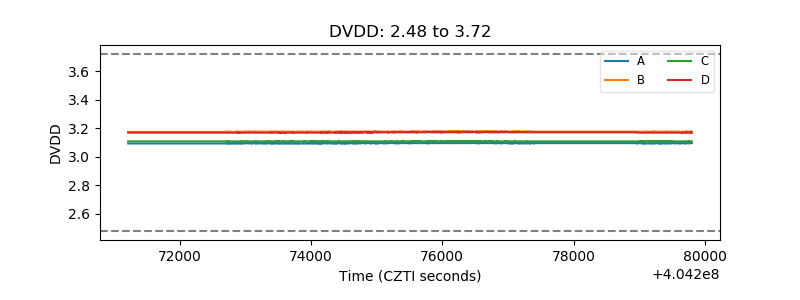 |
| Temperature 1 | 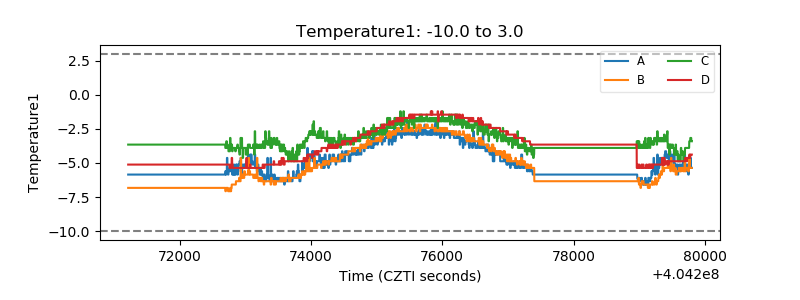 |
| Veto HV Monitor | 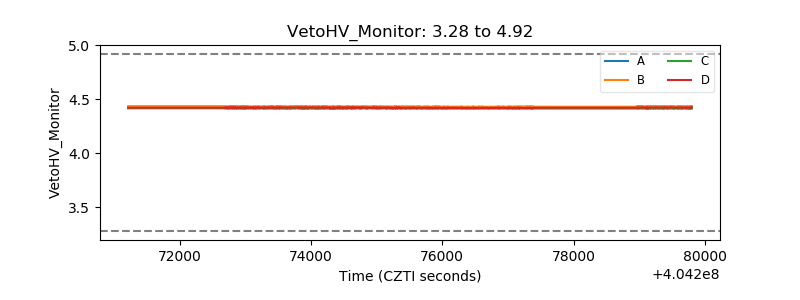 |
| Veto LLD | 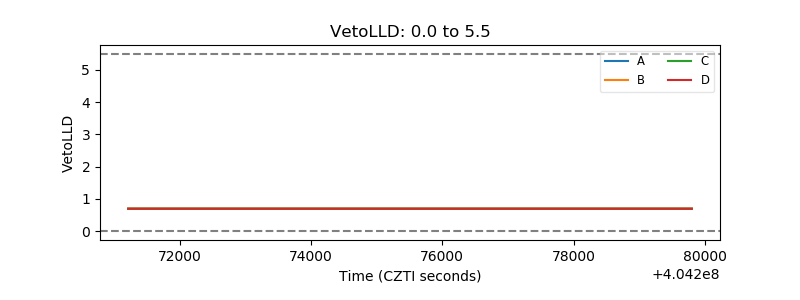 |
| Alpha Counter | 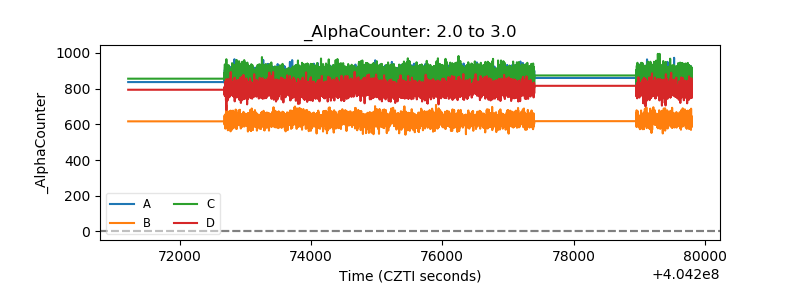 |
| _CPM_Rate | 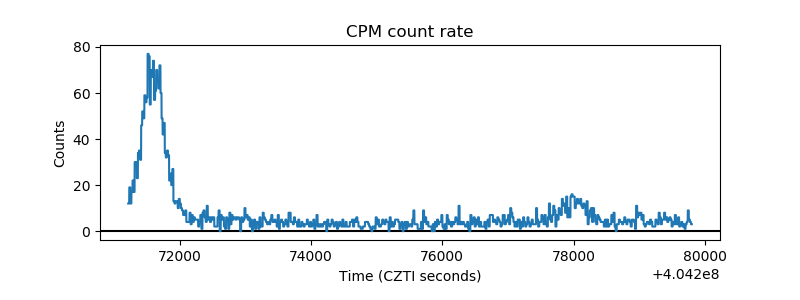 |
| CZT Counter | 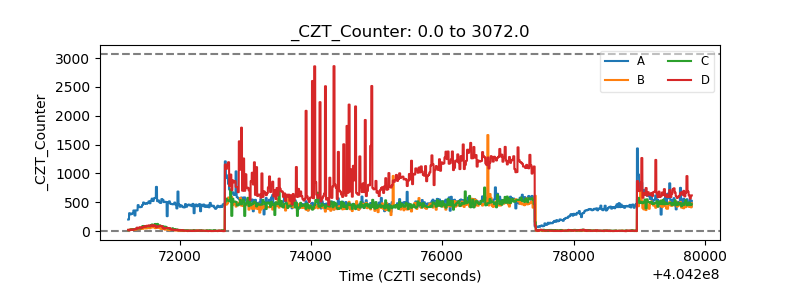 |
| +2.5 Volts monitor | 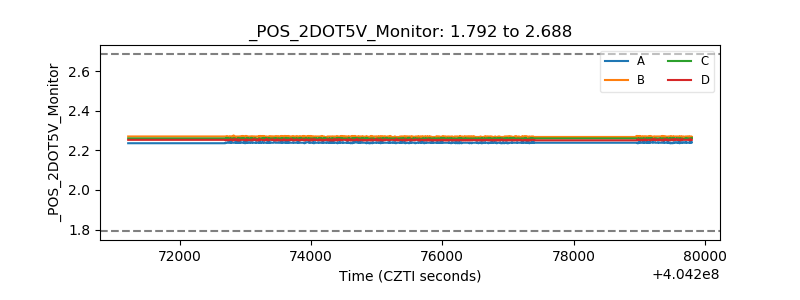 |
| +5 Volts monitor | 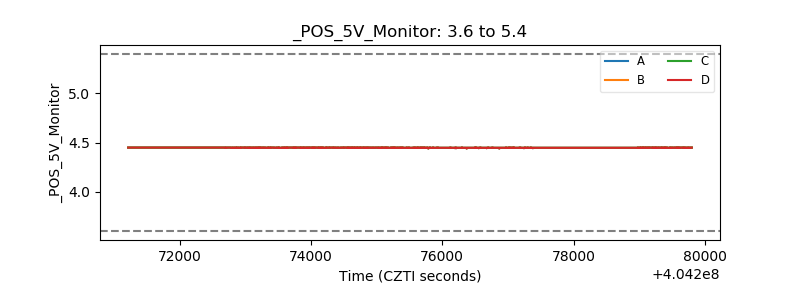 |
| _ROLL_ROT | 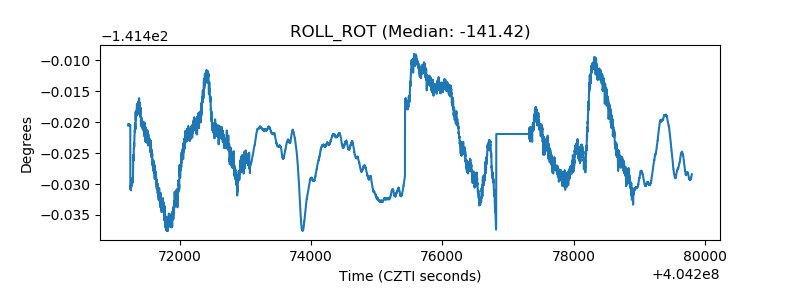 |
| _Roll_DEC | 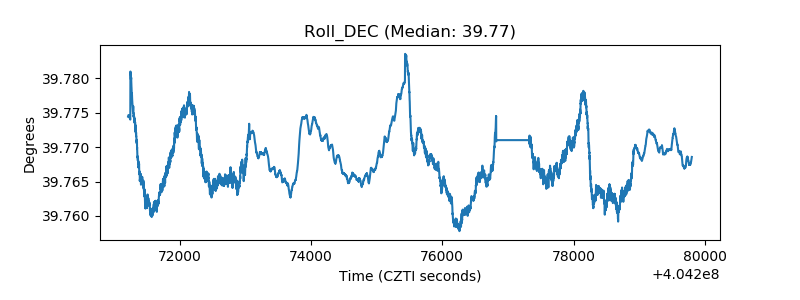 |
| _Roll_RA | 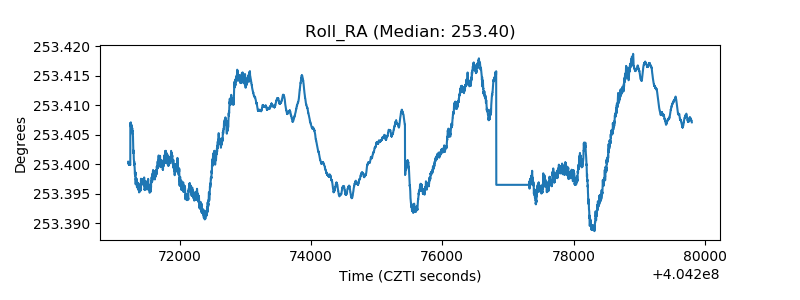 |
| Veto Counter | 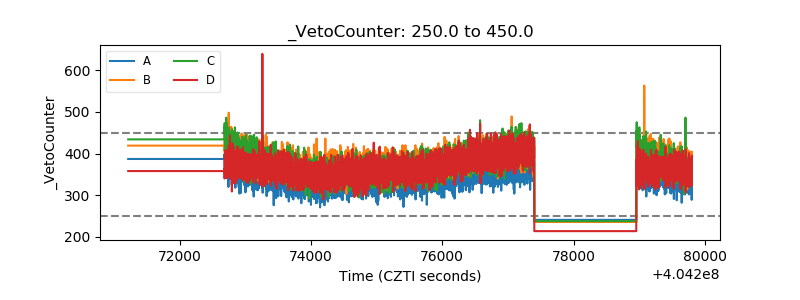 |