| Param | Original file | Final file |
|---|---|---|
| Filename | modeM0/AS1A07_145T01_9000005370_38235cztM0_level2.fits | modeM0/AS1A07_145T01_9000005370_38235cztM0_level2_quad_clean.evt |
| Size (bytes) | 394,603,200 | 100,434,240 |
| Size | 376.3 MB | 95.8 MB |
| Events in quadrant A | 3,263,434 | 669,613 |
| Events in quadrant B | 2,794,001 | 691,427 |
| Events in quadrant C | 2,940,096 | 658,137 |
| Events in quadrant D | 5,145,121 | 604,871 |
| Mode M9 | |||
|---|---|---|---|
| Quadrant | BADHDUFLAG | Total packets | Discarded packets |
| A | 0 | 29 | 0 |
| B | 0 | 29 | 0 |
| C | 0 | 29 | 0 |
| D | 0 | 29 | 0 |
| Mode SS | |||
|---|---|---|---|
| Quadrant | BADHDUFLAG | Total packets | Discarded packets |
| A | 0 | 122 | 0 |
| B | 0 | 122 | 0 |
| C | 0 | 122 | 0 |
| D | 0 | 122 | 0 |
| Mode M0 | |||
|---|---|---|---|
| Quadrant | BADHDUFLAG | Total packets | Discarded packets |
| A | 0 | 13361 | 3 |
| B | 0 | 12390 | 2 |
| C | 0 | 12410 | 2 |
| D | 0 | 19660 | 2 |
| Quadrant | Total seconds | Saturated seconds | Saturation percentage |
|---|---|---|---|
| A | 5974 | 23 | 0.385002% |
| B | 5974 | 7 | 0.117174% |
| C | 5974 | 28 | 0.468698% |
| D | 5974 | 109 | 1.824573% |
Noise dominated data is calculated using 1-second bins in cleaned event files. If a bin has >2000 counts, and if more than 50% of those come from <1% of pixels, then it is considered to be noise-dominated and hence unusable.
| Quadrant | # 1 sec bins | Bins with >0 counts | Bins with >2000 counts | High rate bins dominated by noise | Noise dominated (total time) | Noise dominated (detector-on time) | Marked lightcurve |
|---|---|---|---|---|---|---|---|
| A | 8839 | 5976 | 15 | 15 | 0.17% | 0.25% | 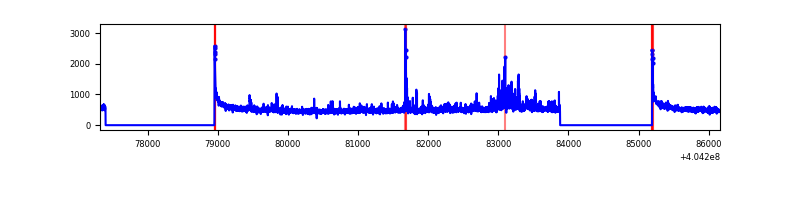 |
| B | 8839 | 5976 | 2 | 2 | 0.02% | 0.03% | 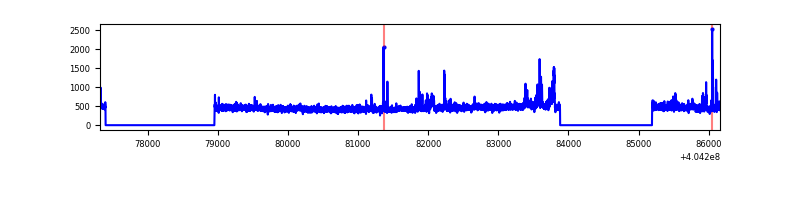 |
| C | 8839 | 5976 | 21 | 21 | 0.24% | 0.35% | 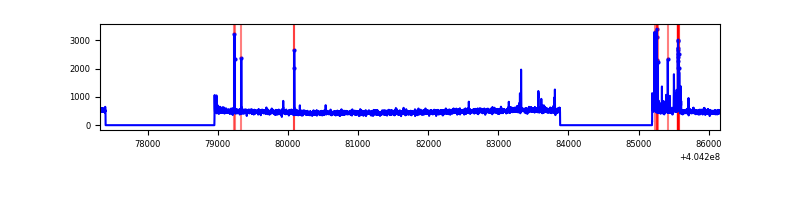 |
| D | 8839 | 5976 | 84 | 84 | 0.95% | 1.41% | 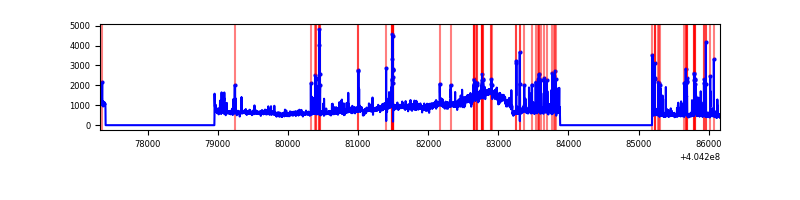 |
Top three noisy pixels from each quadrant. If the there are fewer than three noisy pixels in the level2.evt file, extra rows are filled as -1
| Pixel properties | Quadrant properties | ||||||
|---|---|---|---|---|---|---|---|
| Quadrant | DetID | PixID | Counts | Sigma | Mean | Median | Sigma |
| A | 10 | 83 | 408490 | 3032.4 | 668 | 654 | 134.5 |
| A | 12 | 16 | 124523 | 921.01 | 668 | 654 | 134.5 |
| A | 12 | 189 | 65336 | 480.93 | 668 | 654 | 134.5 |
| B | 4 | 232 | 70400 | 545.26 | 664 | 646 | 127.9 |
| B | 5 | 172 | 55312 | 427.32 | 664 | 646 | 127.9 |
| B | 0 | 230 | 22652 | 172.02 | 664 | 646 | 127.9 |
| C | 15 | 214 | 251204 | 1652.93 | 650 | 655 | 151.6 |
| C | 2 | 16 | 90825 | 594.87 | 650 | 655 | 151.6 |
| C | 14 | 254 | 19224 | 122.5 | 650 | 655 | 151.6 |
| D | 10 | 203 | 1628711 | 10285.86 | 645 | 625 | 158.3 |
| D | 7 | 38 | 268901 | 1694.9 | 645 | 625 | 158.3 |
| D | 2 | 249 | 260313 | 1640.65 | 645 | 625 | 158.3 |
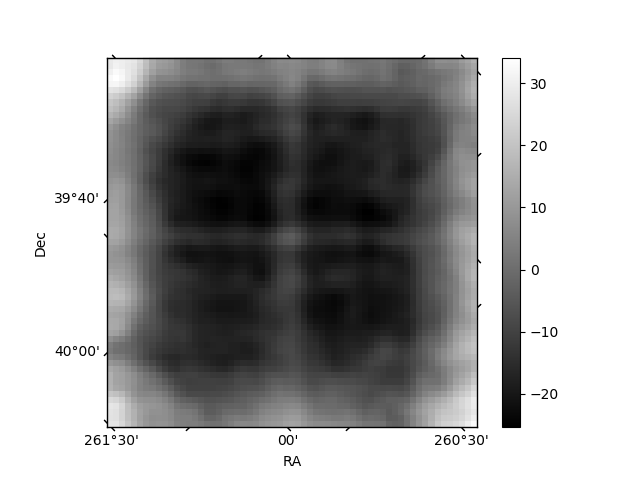
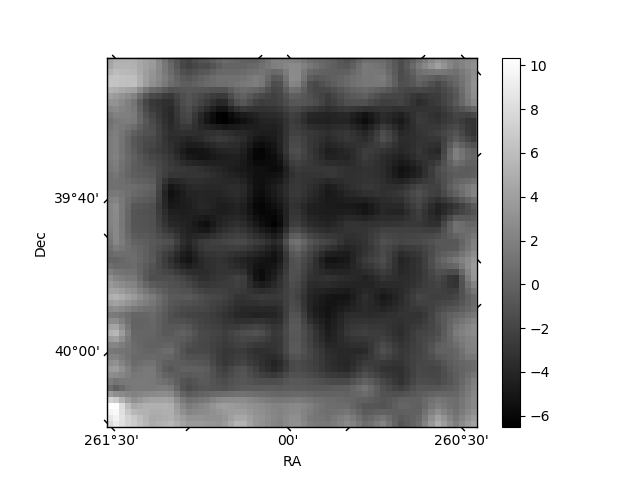
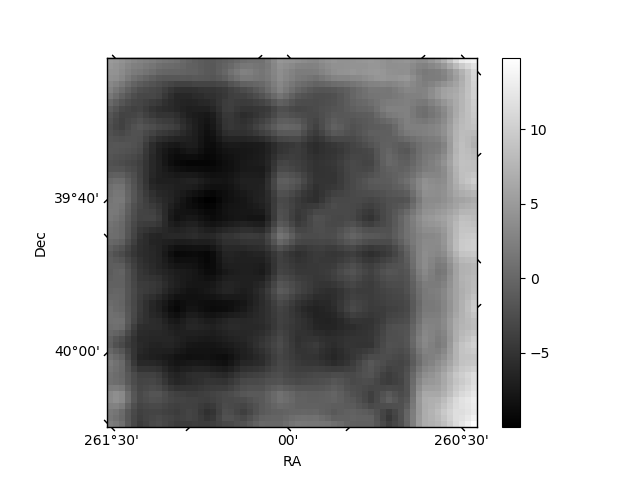
Histogram calculated using DETX and DETY for each event in the final _common_clean file
| Quadrant A | 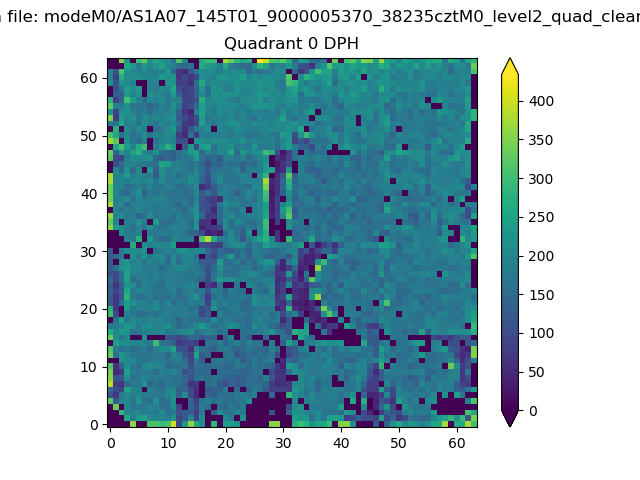 |
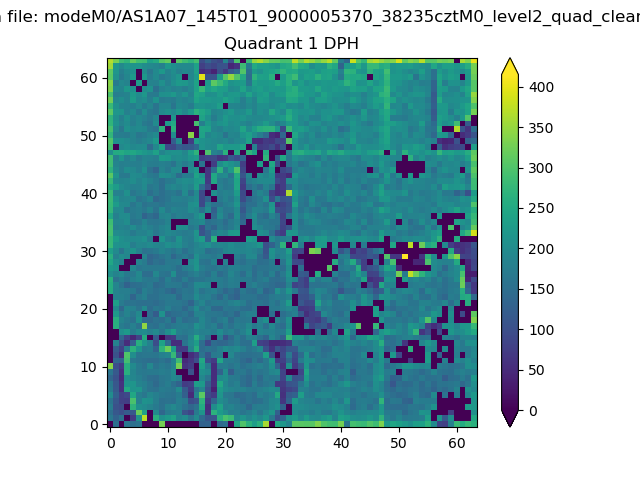 |
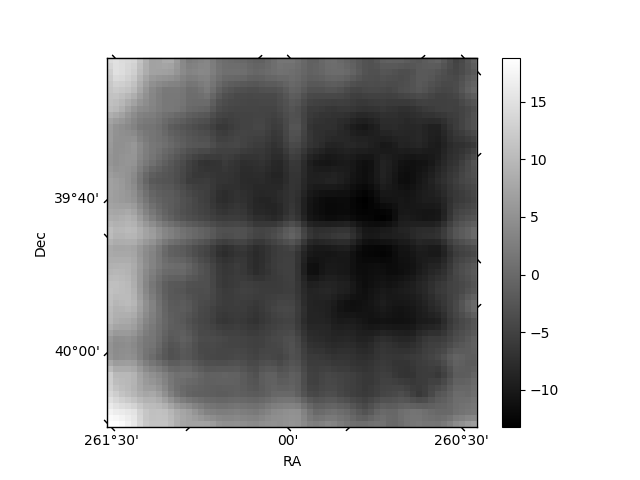
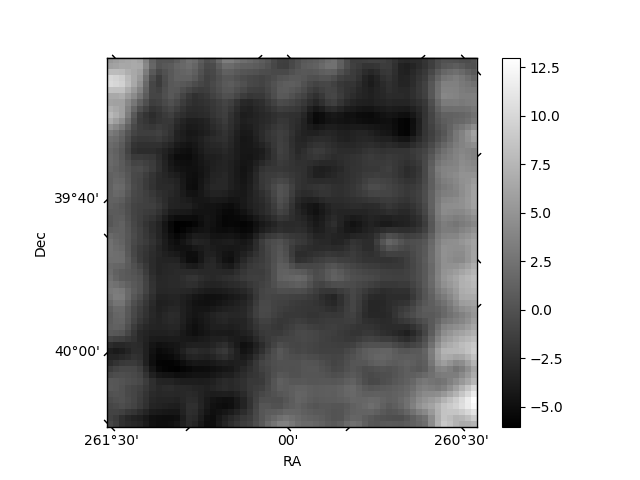
Quadrant B |
|---|---|---|---|
| Quadrant D | 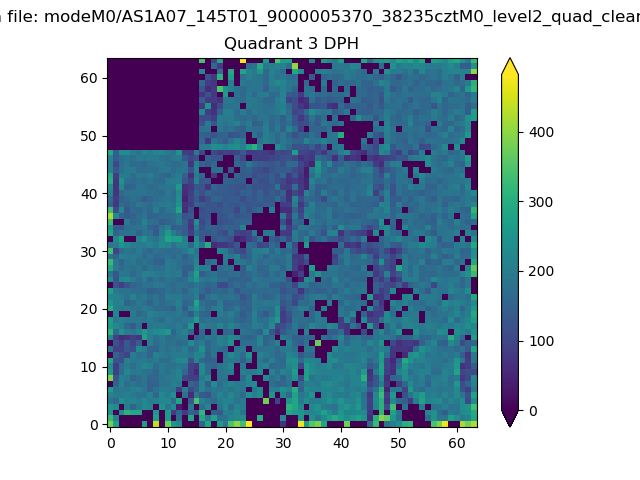 |
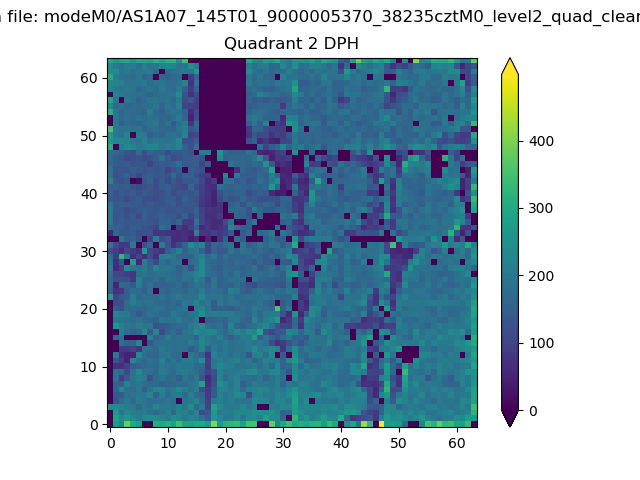 |
Quadrant C |
| Plot type | Count rate plots | Images |
|---|---|---|
| Comparison with Poisson distribution Blue bars denote a histogram of data divided into 1 sec bins. Red curve is a Poisson curve with rate = median count rate of data. |
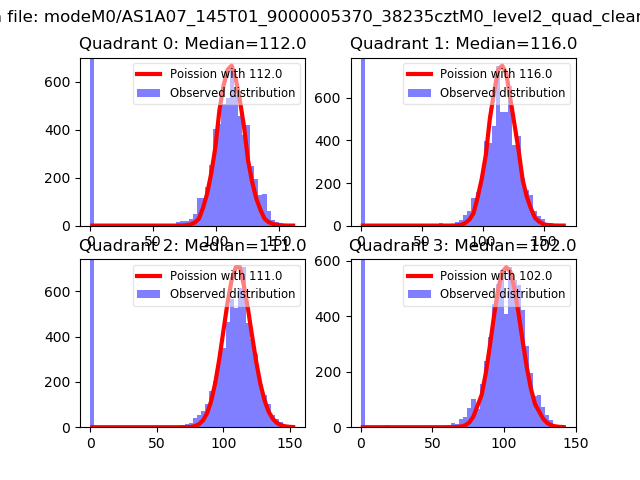 |
 |
| Quadrant-wise count rates Data is divided into 100 sec bins |
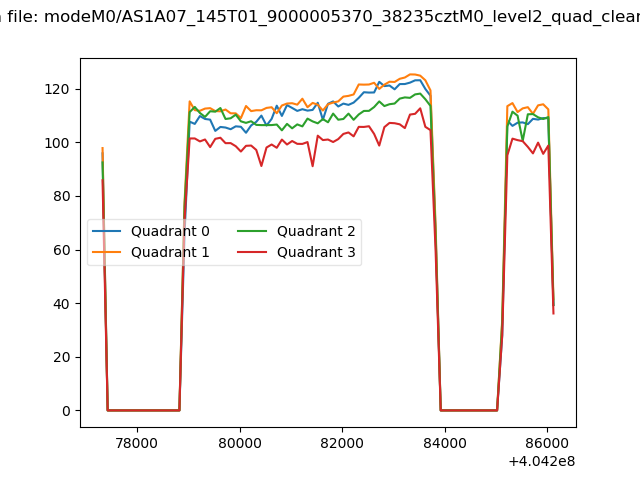 |
|
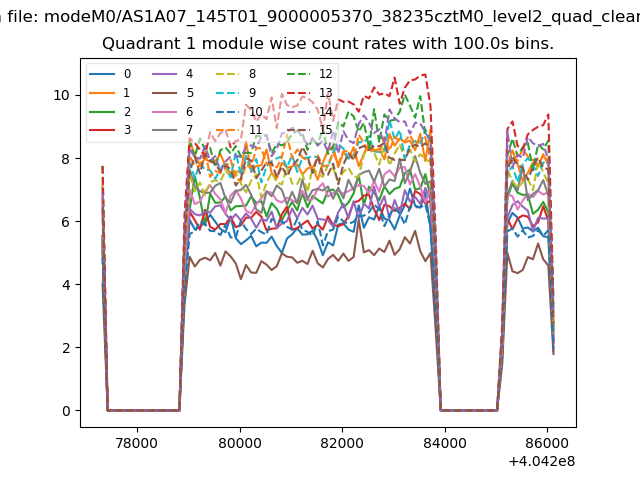
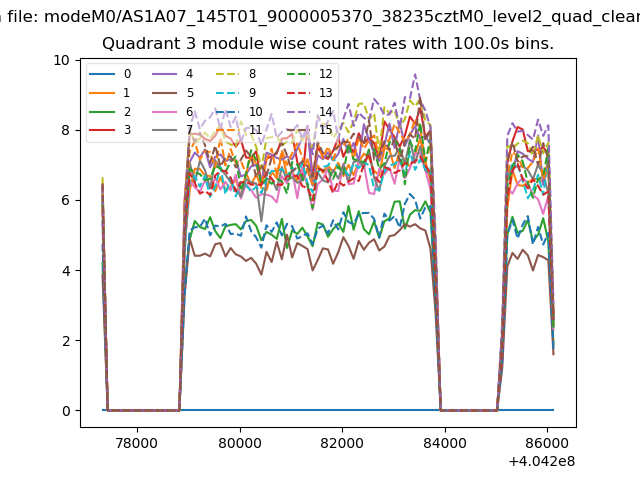
| Module-wise count rates for Quadrant A Data is divided into 100 sec bins |
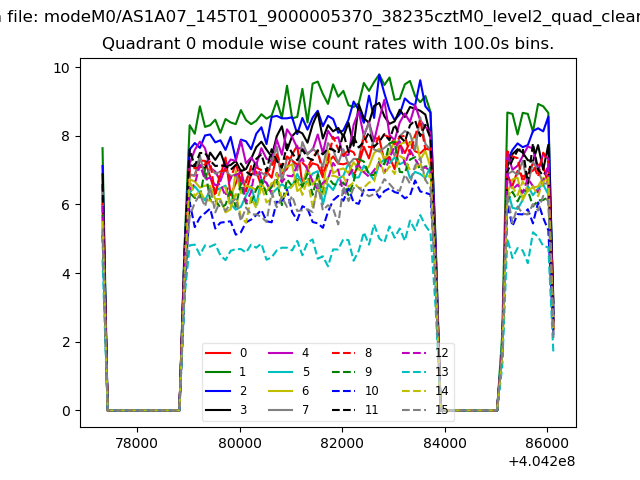 |
 |
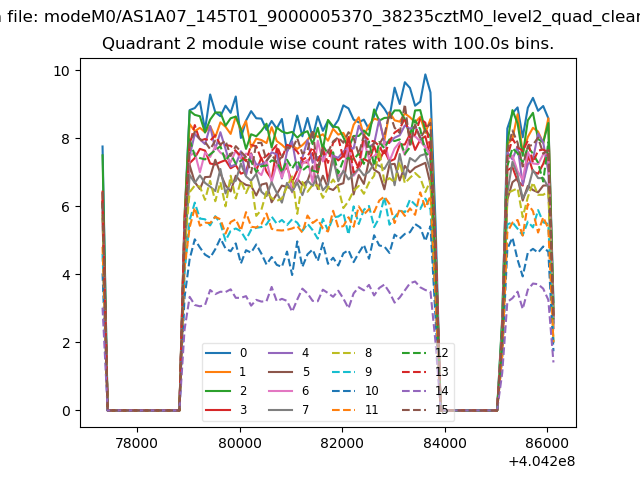
| Module-wise count rates for Quadrant B Data is divided into 100 sec bins |
 |
 |
| Module-wise count rates for Quadrant C Data is divided into 100 sec bins |
 |
 |
| Module-wise count rates for Quadrant D Data is divided into 100 sec bins |
 |
 |
| Parameter | Plot |
|---|---|
| CZT HV Monitor | 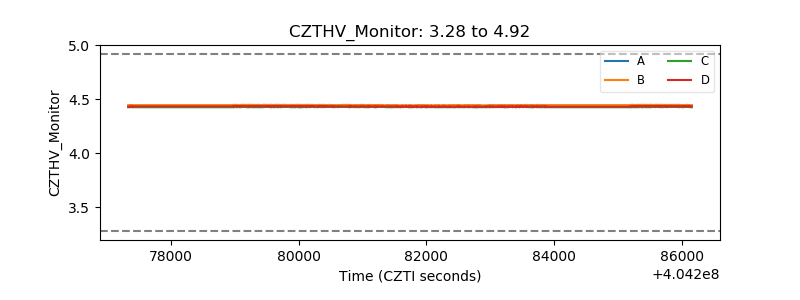 |
| D_VDD | 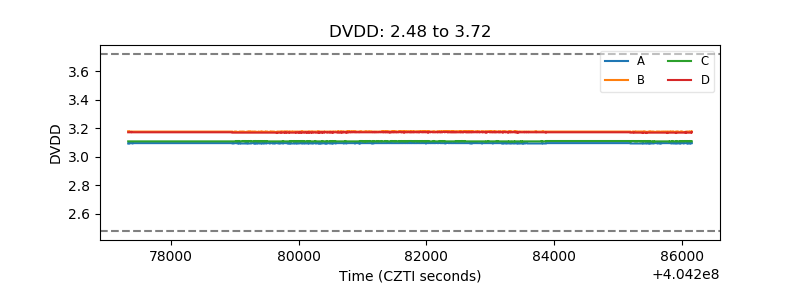 |
| Temperature 1 | 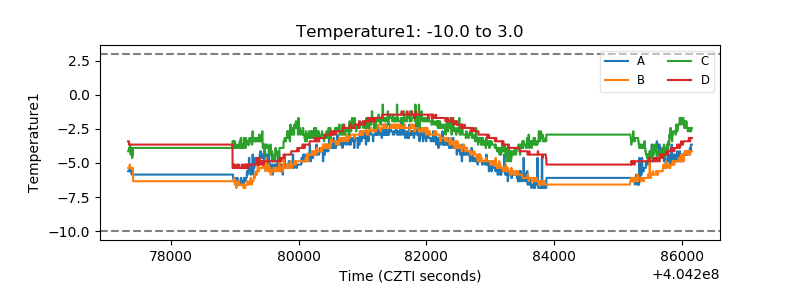 |
| Veto HV Monitor | 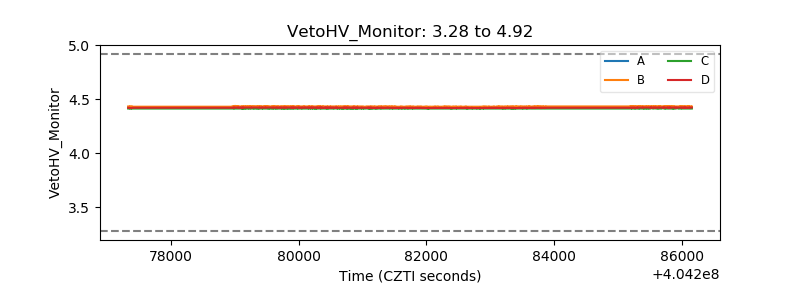 |
| Veto LLD | 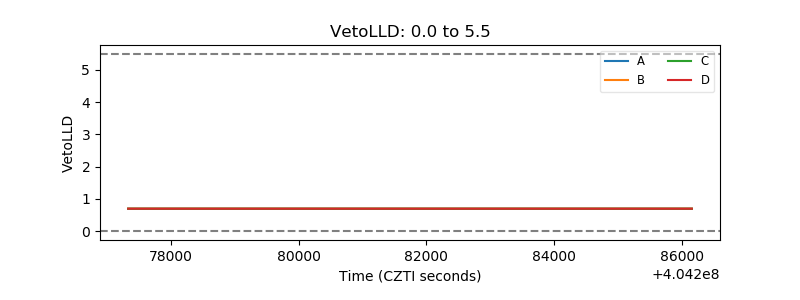 |
| Alpha Counter | 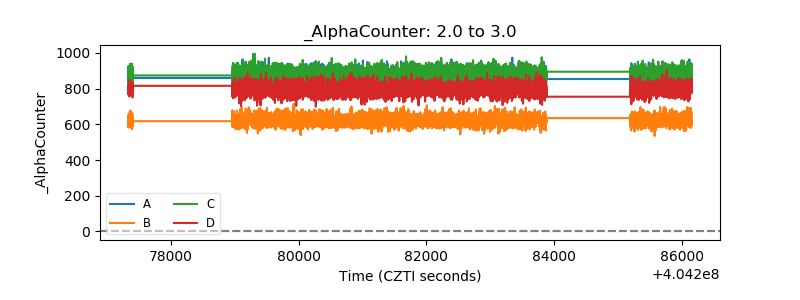 |
| _CPM_Rate | 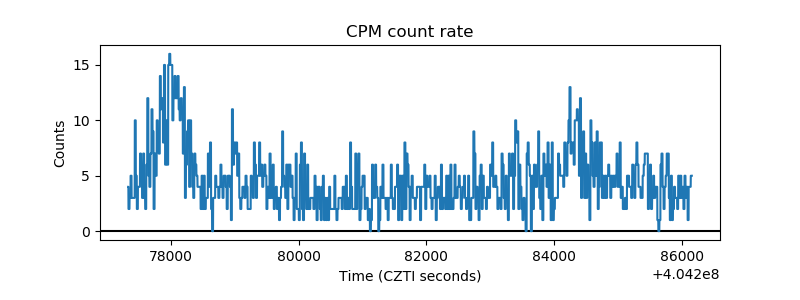 |
| CZT Counter | 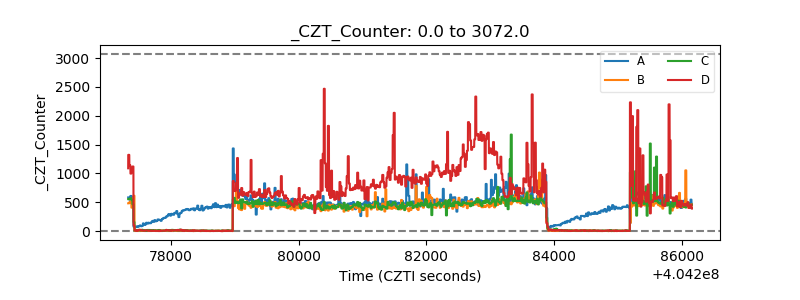 |
| +2.5 Volts monitor |  |
| +5 Volts monitor | 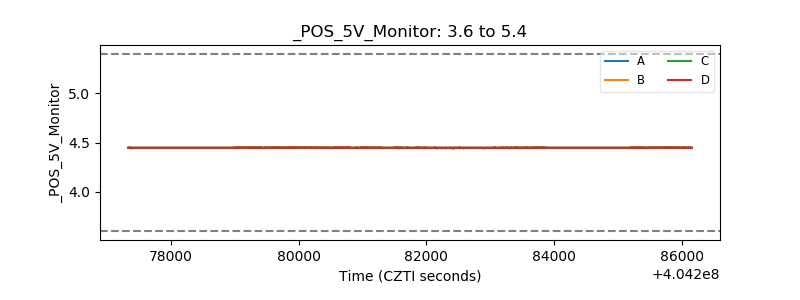 |
| _ROLL_ROT | 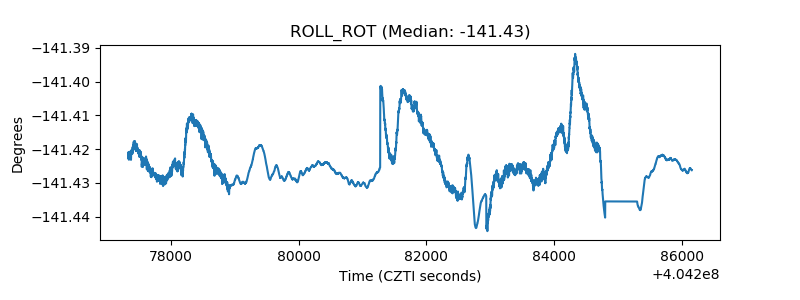 |
| _Roll_DEC | 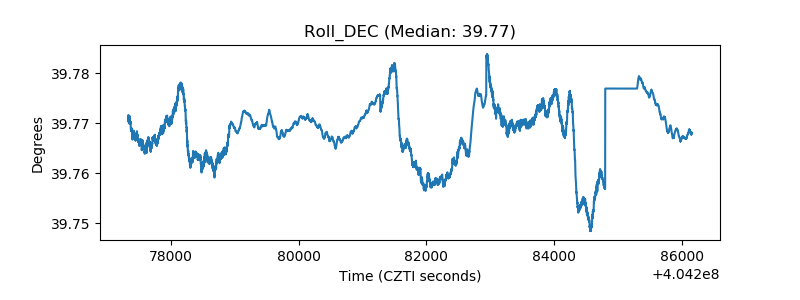 |
| _Roll_RA | 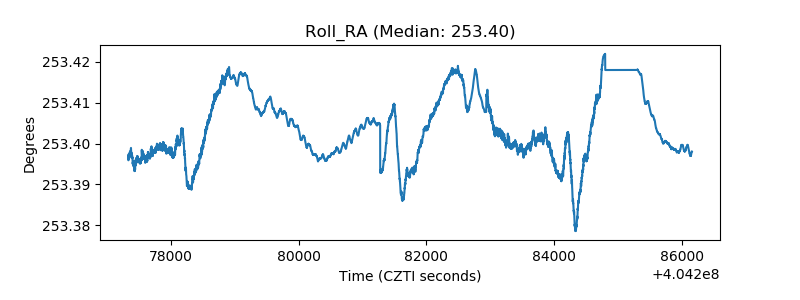 |
| Veto Counter | 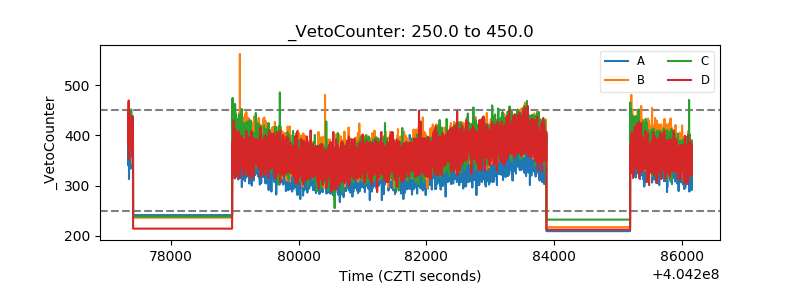 |