| Param | Original file | Final file |
|---|---|---|
| Filename | modeM0/AS1A07_145T01_9000005370_38236cztM0_level2.fits | modeM0/AS1A07_145T01_9000005370_38236cztM0_level2_quad_clean.evt |
| Size (bytes) | 392,826,240 | 99,020,160 |
| Size | 374.6 MB | 94.4 MB |
| Events in quadrant A | 3,117,787 | 670,569 |
| Events in quadrant B | 3,184,356 | 680,578 |
| Events in quadrant C | 3,030,652 | 647,654 |
| Events in quadrant D | 4,746,080 | 583,881 |
| Mode M9 | |||
|---|---|---|---|
| Quadrant | BADHDUFLAG | Total packets | Discarded packets |
| A | 0 | 13 | 0 |
| B | 0 | 13 | 0 |
| C | 0 | 13 | 0 |
| D | 0 | 13 | 0 |
| Mode SS | |||
|---|---|---|---|
| Quadrant | BADHDUFLAG | Total packets | Discarded packets |
| A | 0 | 122 | 0 |
| B | 0 | 122 | 0 |
| C | 0 | 122 | 0 |
| D | 0 | 122 | 0 |
| Mode M0 | |||
|---|---|---|---|
| Quadrant | BADHDUFLAG | Total packets | Discarded packets |
| A | 0 | 12641 | 2 |
| B | 0 | 13360 | 1 |
| C | 0 | 12651 | 1 |
| D | 0 | 18120 | 1 |
| Quadrant | Total seconds | Saturated seconds | Saturation percentage |
|---|---|---|---|
| A | 5944 | 7 | 0.117766% |
| B | 5944 | 81 | 1.362719% |
| C | 5944 | 19 | 0.319650% |
| D | 5944 | 292 | 4.912517% |
Noise dominated data is calculated using 1-second bins in cleaned event files. If a bin has >2000 counts, and if more than 50% of those come from <1% of pixels, then it is considered to be noise-dominated and hence unusable.
| Quadrant | # 1 sec bins | Bins with >0 counts | Bins with >2000 counts | High rate bins dominated by noise | Noise dominated (total time) | Noise dominated (detector-on time) | Marked lightcurve |
|---|---|---|---|---|---|---|---|
| A | 7225 | 5945 | 1 | 1 | 0.01% | 0.02% | 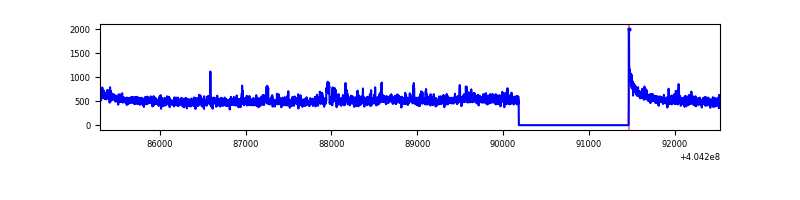 |
| B | 7225 | 5945 | 28 | 28 | 0.39% | 0.47% | 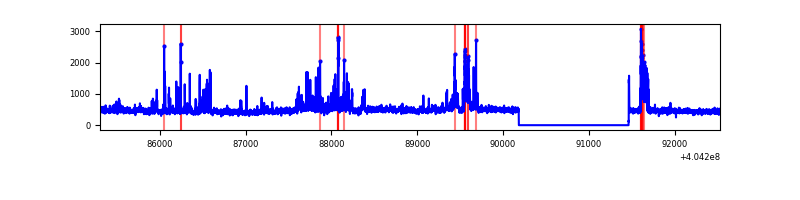 |
| C | 7225 | 5945 | 12 | 12 | 0.17% | 0.20% | 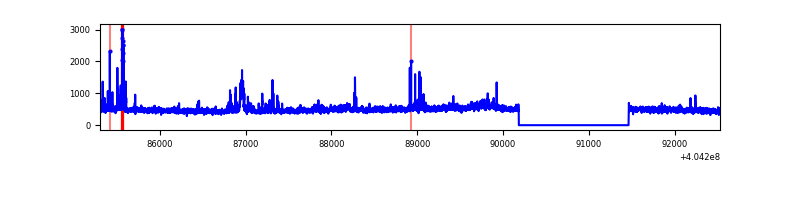 |
| D | 7225 | 5945 | 268 | 268 | 3.71% | 4.51% | 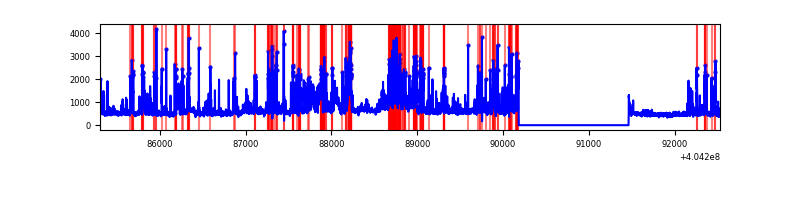 |
Top three noisy pixels from each quadrant. If the there are fewer than three noisy pixels in the level2.evt file, extra rows are filled as -1
| Pixel properties | Quadrant properties | ||||||
|---|---|---|---|---|---|---|---|
| Quadrant | DetID | PixID | Counts | Sigma | Mean | Median | Sigma |
| A | 10 | 83 | 371997 | 2736.18 | 665 | 650 | 135.7 |
| A | 12 | 189 | 80666 | 589.58 | 665 | 650 | 135.7 |
| A | 0 | 247 | 73818 | 539.12 | 665 | 650 | 135.7 |
| B | 5 | 172 | 334673 | 2622.01 | 658 | 639 | 127.4 |
| B | 4 | 232 | 133158 | 1040.21 | 658 | 639 | 127.4 |
| B | 0 | 230 | 77441 | 602.86 | 658 | 639 | 127.4 |
| C | 15 | 214 | 248730 | 1629.97 | 643 | 646 | 152.2 |
| C | 14 | 254 | 106585 | 696.04 | 643 | 646 | 152.2 |
| C | 9 | 236 | 81746 | 532.85 | 643 | 646 | 152.2 |
| D | 10 | 203 | 532794 | 3396.31 | 637 | 618 | 156.7 |
| D | 2 | 250 | 433311 | 2761.42 | 637 | 618 | 156.7 |
| D | 12 | 233 | 407270 | 2595.23 | 637 | 618 | 156.7 |
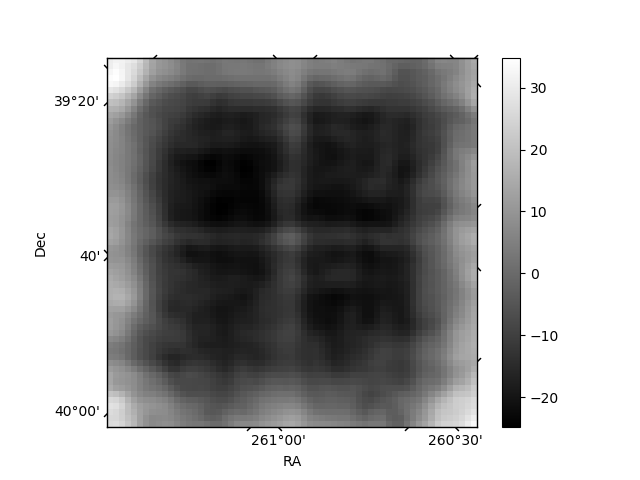
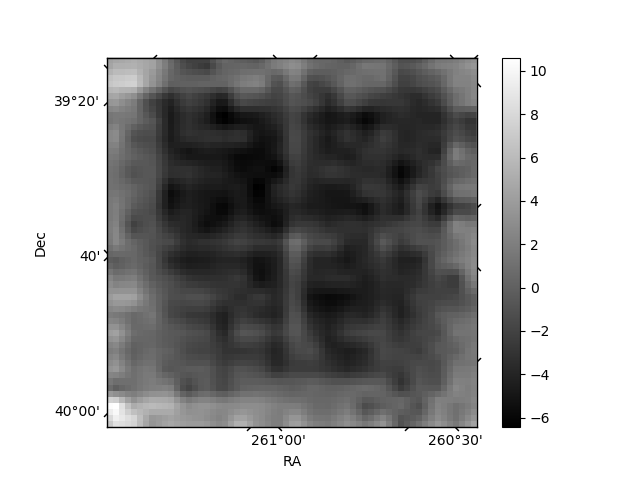
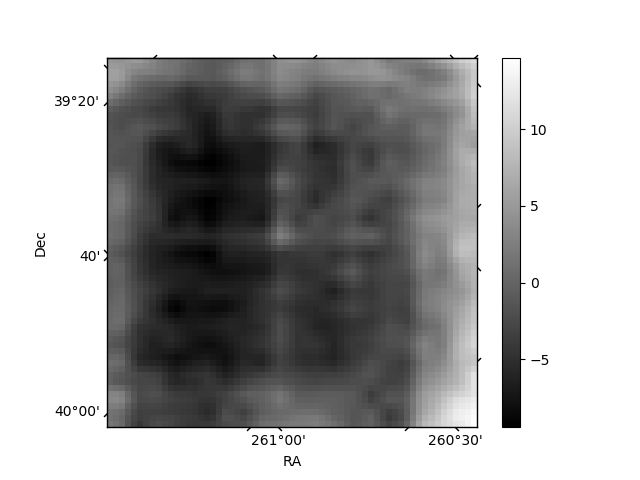
Histogram calculated using DETX and DETY for each event in the final _common_clean file
| Quadrant A | 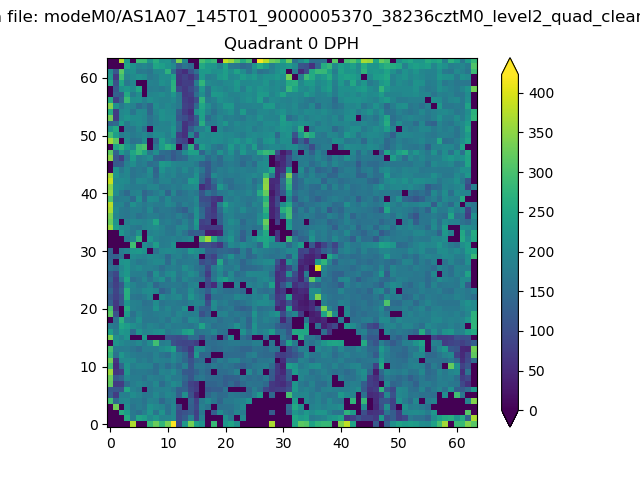 |
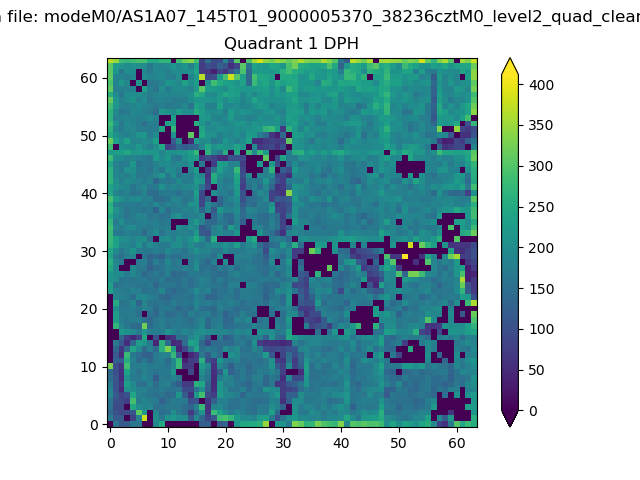 |
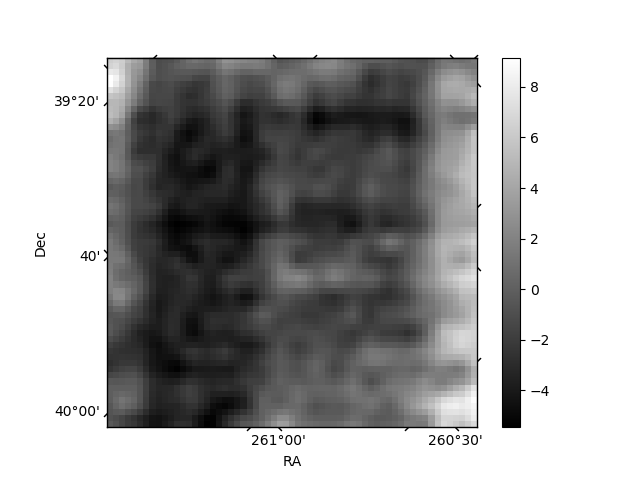
Quadrant B |
|---|---|---|---|
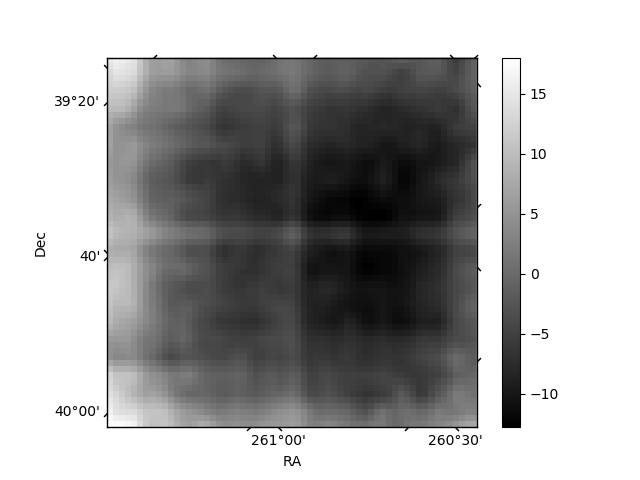
| Quadrant D | 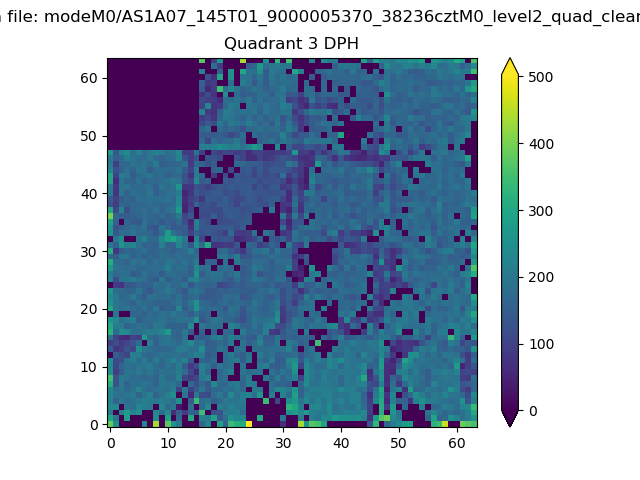 |
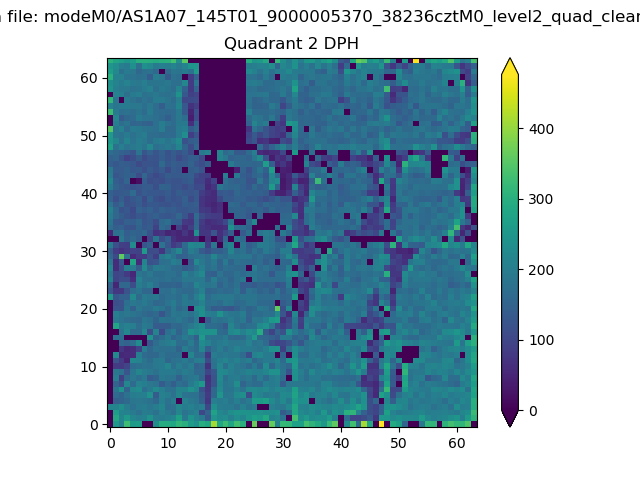 |
Quadrant C |
| Plot type | Count rate plots | Images |
|---|---|---|
| Comparison with Poisson distribution Blue bars denote a histogram of data divided into 1 sec bins. Red curve is a Poisson curve with rate = median count rate of data. |
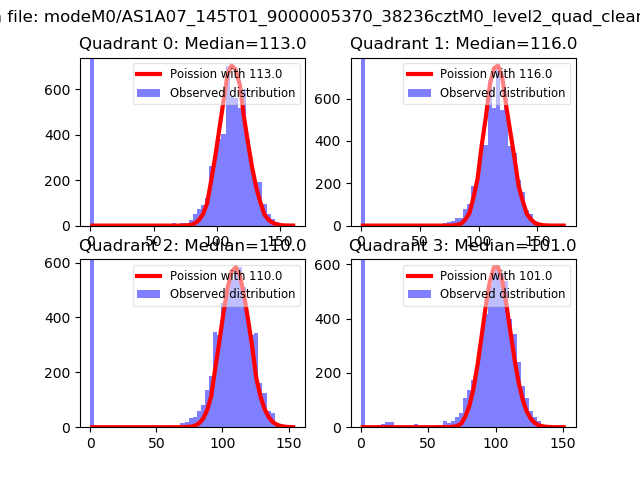 |
 |
| Quadrant-wise count rates Data is divided into 100 sec bins |
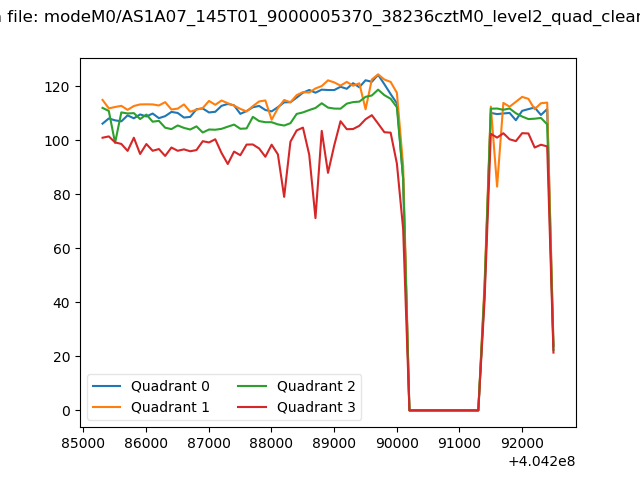 |
|
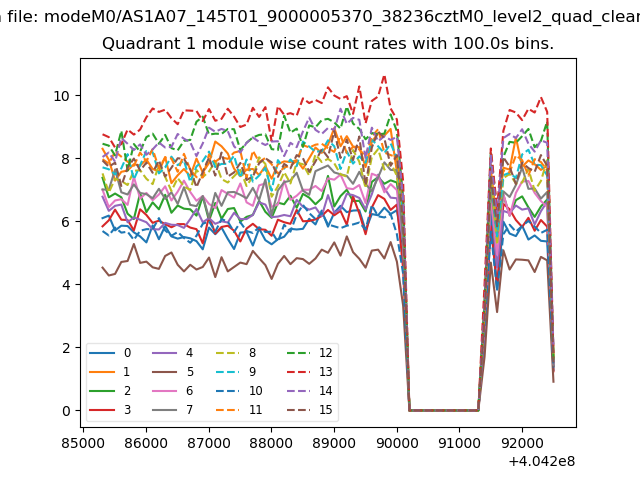
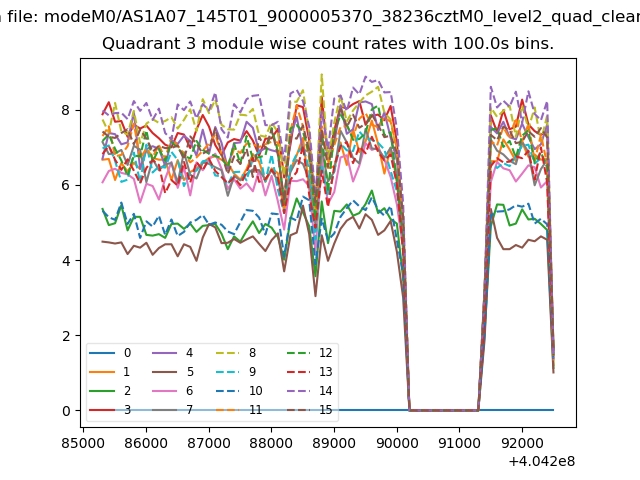
| Module-wise count rates for Quadrant A Data is divided into 100 sec bins |
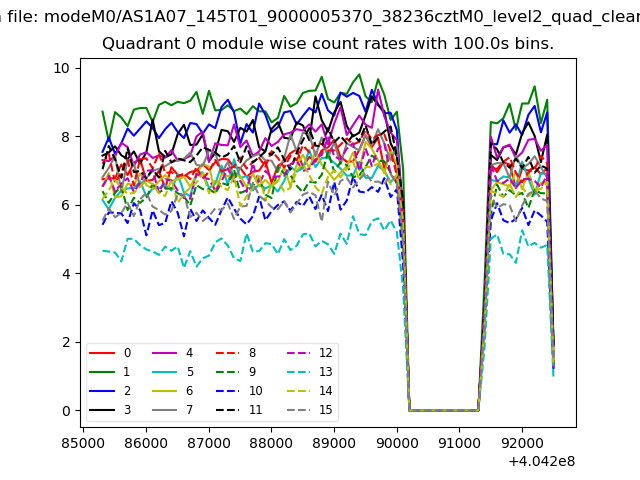 |
 |
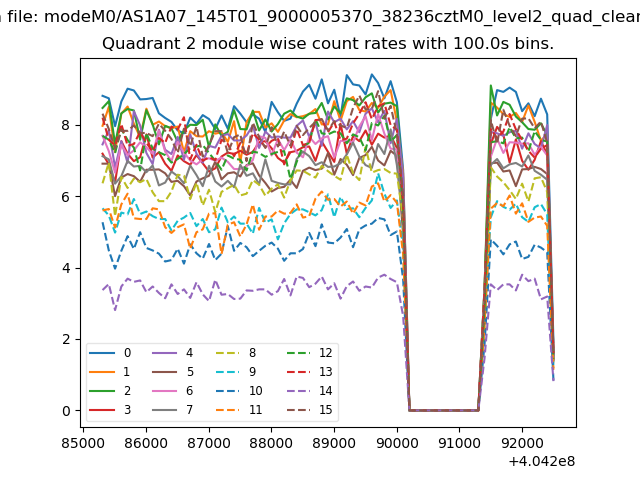
| Module-wise count rates for Quadrant B Data is divided into 100 sec bins |
 |
 |
| Module-wise count rates for Quadrant C Data is divided into 100 sec bins |
 |
 |
| Module-wise count rates for Quadrant D Data is divided into 100 sec bins |
 |
 |
| Parameter | Plot |
|---|---|
| CZT HV Monitor |  |
| D_VDD | 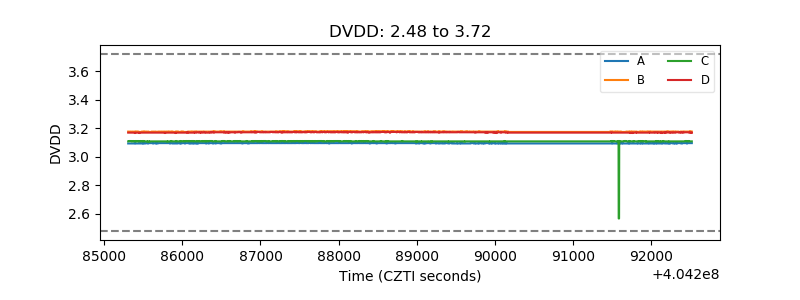 |
| Temperature 1 | 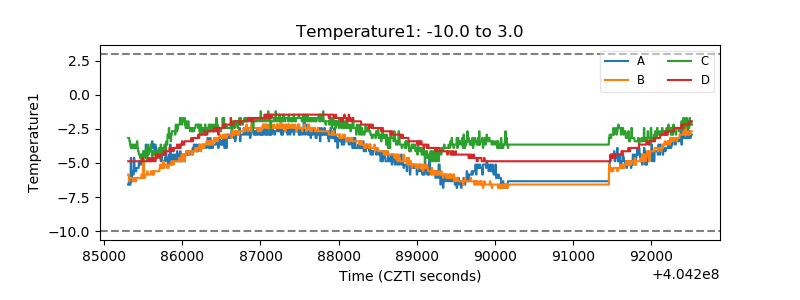 |
| Veto HV Monitor | 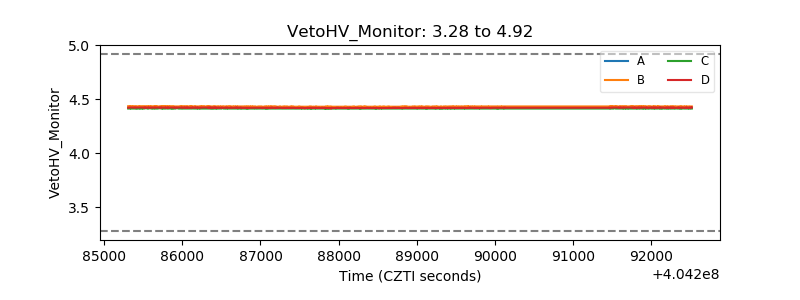 |
| Veto LLD | 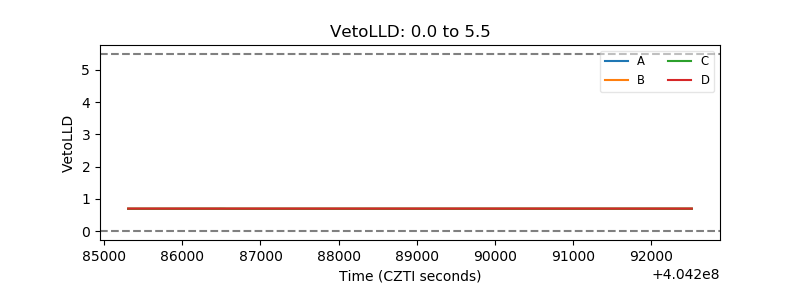 |
| Alpha Counter | 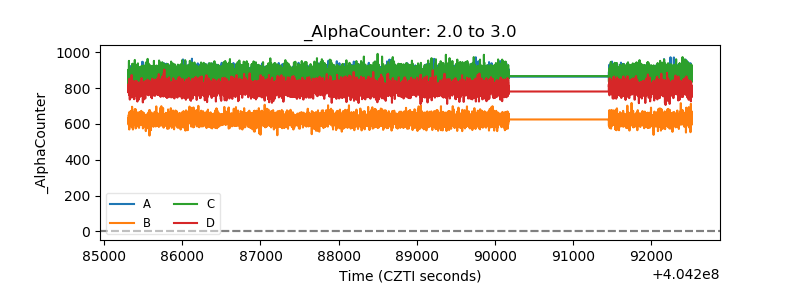 |
| _CPM_Rate | 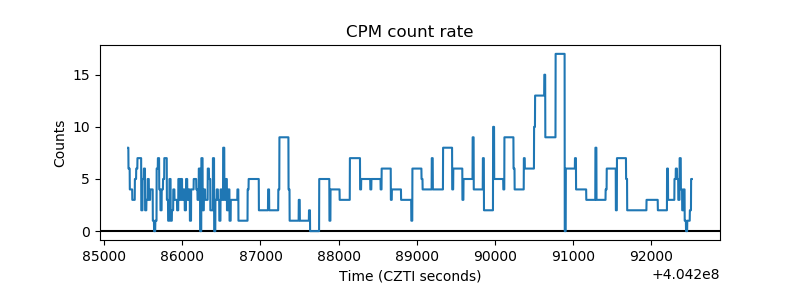 |
| CZT Counter | 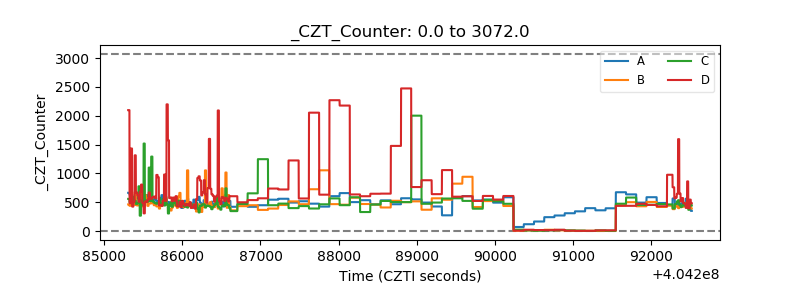 |
| +2.5 Volts monitor | 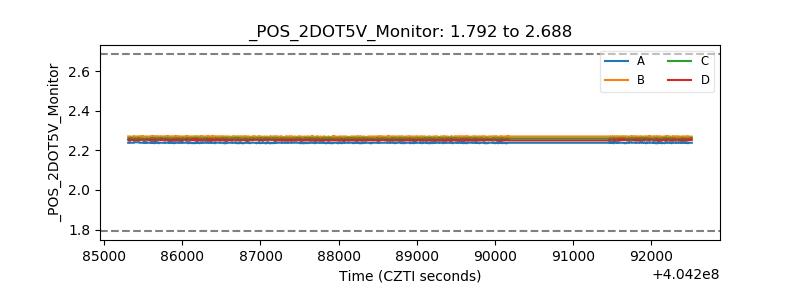 |
| +5 Volts monitor | 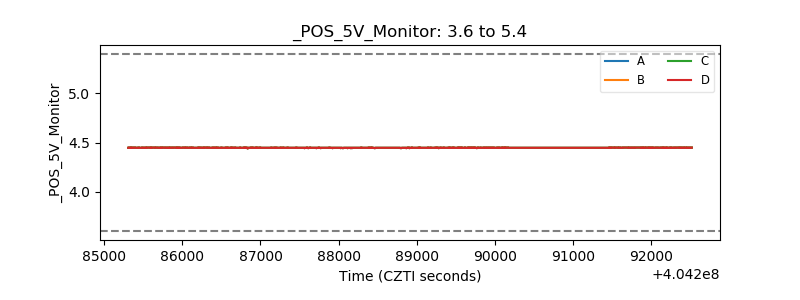 |
| _ROLL_ROT | 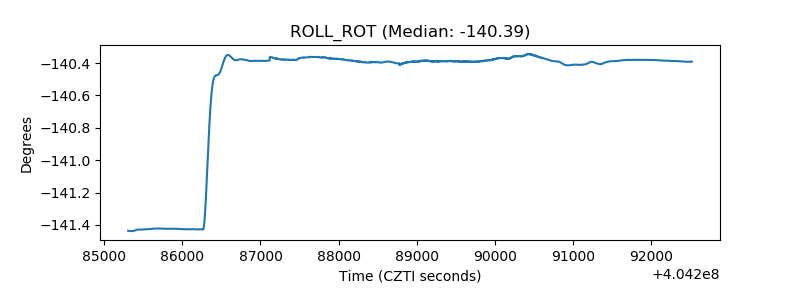 |
| _Roll_DEC | 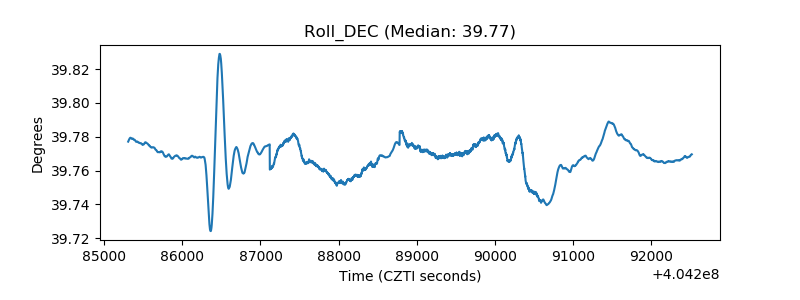 |
| _Roll_RA | 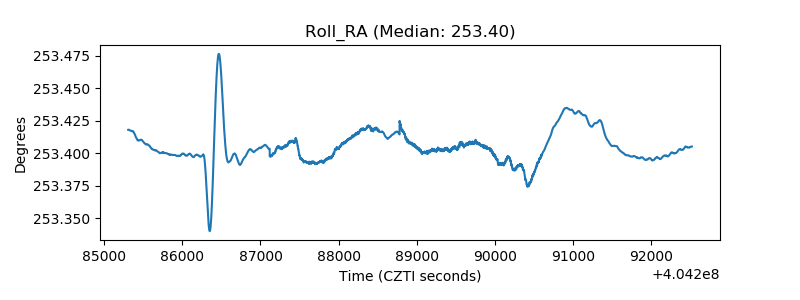 |
| Veto Counter | 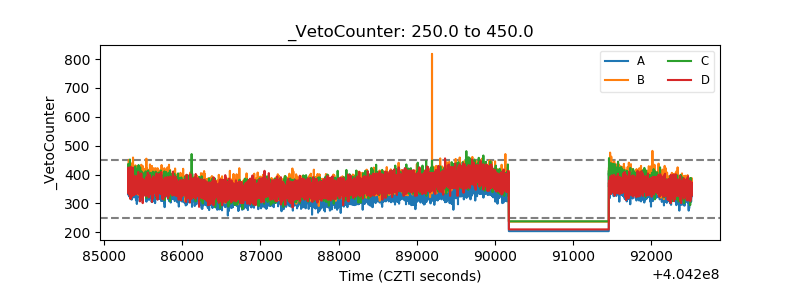 |