| Param | Original file | Final file |
|---|---|---|
| Filename | modeM0/AS1A07_145T01_9000005370_38238cztM0_level2.fits | modeM0/AS1A07_145T01_9000005370_38238cztM0_level2_quad_clean.evt |
| Size (bytes) | 715,587,840 | 177,232,320 |
| Size | 682.4 MB | 169.0 MB |
| Events in quadrant A | 5,940,414 | 1,204,642 |
| Events in quadrant B | 5,247,850 | 1,220,762 |
| Events in quadrant C | 6,045,297 | 1,147,861 |
| Events in quadrant D | 8,418,385 | 1,045,035 |
| Mode M9 | |||
|---|---|---|---|
| Quadrant | BADHDUFLAG | Total packets | Discarded packets |
| A | 0 | 29 | 0 |
| B | 0 | 29 | 0 |
| C | 0 | 29 | 0 |
| D | 0 | 30 | 0 |
| Mode SS | |||
|---|---|---|---|
| Quadrant | BADHDUFLAG | Total packets | Discarded packets |
| A | 0 | 220 | 0 |
| B | 0 | 220 | 0 |
| C | 0 | 220 | 0 |
| D | 0 | 220 | 0 |
| Mode M0 | |||
|---|---|---|---|
| Quadrant | BADHDUFLAG | Total packets | Discarded packets |
| A | 0 | 24198 | 4 |
| B | 0 | 23036 | 3 |
| C | 0 | 24794 | 3 |
| D | 0 | 32336 | 3 |
| Quadrant | Total seconds | Saturated seconds | Saturation percentage |
|---|---|---|---|
| A | 10800 | 27 | 0.250000% |
| B | 10800 | 99 | 0.916667% |
| C | 10800 | 209 | 1.935185% |
| D | 10800 | 435 | 4.027778% |
Noise dominated data is calculated using 1-second bins in cleaned event files. If a bin has >2000 counts, and if more than 50% of those come from <1% of pixels, then it is considered to be noise-dominated and hence unusable.
| Quadrant | # 1 sec bins | Bins with >0 counts | Bins with >2000 counts | High rate bins dominated by noise | Noise dominated (total time) | Noise dominated (detector-on time) | Marked lightcurve |
|---|---|---|---|---|---|---|---|
| A | 13574 | 10802 | 10 | 10 | 0.07% | 0.09% | 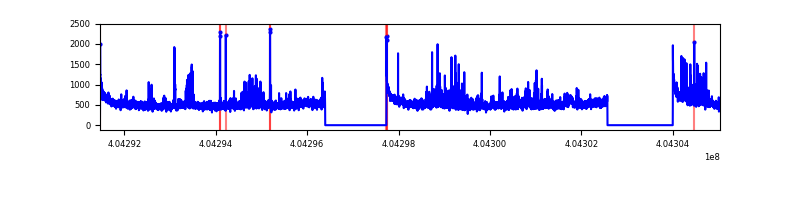 |
| B | 13574 | 10802 | 36 | 36 | 0.27% | 0.33% | 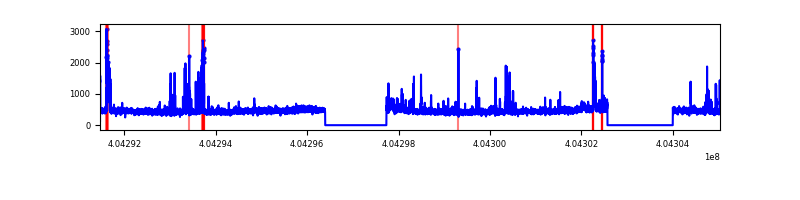 |
| C | 13574 | 10802 | 164 | 164 | 1.21% | 1.52% | 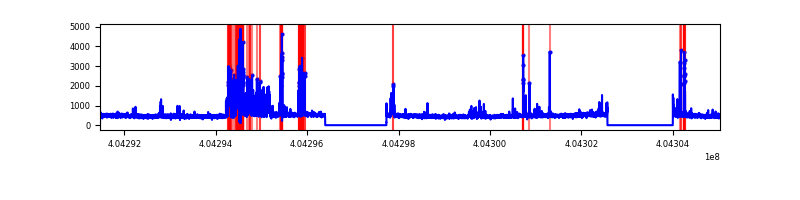 |
| D | 13574 | 10802 | 465 | 465 | 3.43% | 4.30% | 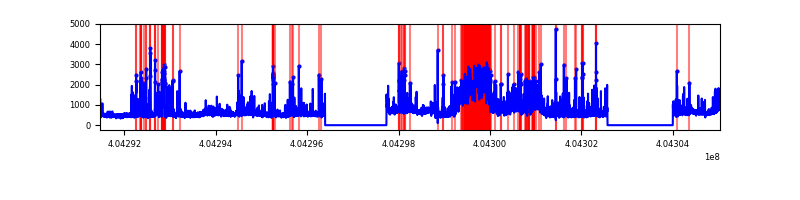 |
Top three noisy pixels from each quadrant. If the there are fewer than three noisy pixels in the level2.evt file, extra rows are filled as -1
| Pixel properties | Quadrant properties | ||||||
|---|---|---|---|---|---|---|---|
| Quadrant | DetID | PixID | Counts | Sigma | Mean | Median | Sigma |
| A | 10 | 83 | 701922 | 2877.63 | 1201 | 1174 | 243.5 |
| A | 13 | 248 | 369162 | 1511.15 | 1201 | 1174 | 243.5 |
| A | 12 | 189 | 136630 | 556.25 | 1201 | 1174 | 243.5 |
| B | 5 | 172 | 322946 | 1402.79 | 1194 | 1160 | 229.4 |
| B | 5 | 184 | 91431 | 393.53 | 1194 | 1160 | 229.4 |
| B | 15 | 85 | 71918 | 308.46 | 1194 | 1160 | 229.4 |
| C | 9 | 236 | 875404 | 3232.82 | 1157 | 1163 | 270.4 |
| C | 15 | 214 | 446426 | 1646.52 | 1157 | 1163 | 270.4 |
| C | 2 | 16 | 84921 | 309.73 | 1157 | 1163 | 270.4 |
| D | 2 | 249 | 1813001 | 6443.18 | 1160 | 1129 | 281.2 |
| D | 10 | 203 | 960812 | 3412.72 | 1160 | 1129 | 281.2 |
| D | 12 | 233 | 350432 | 1242.15 | 1160 | 1129 | 281.2 |
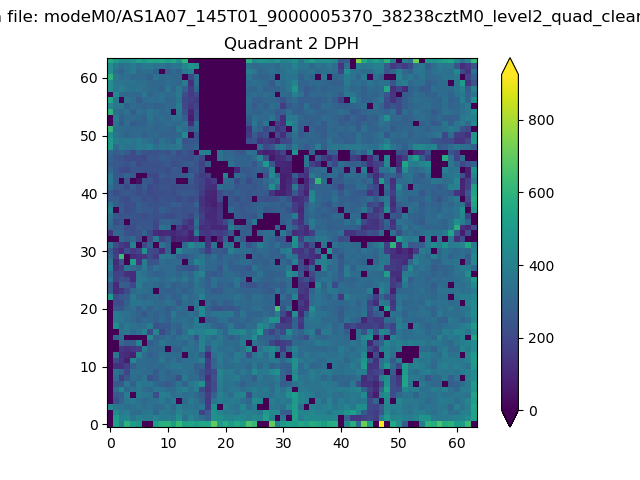
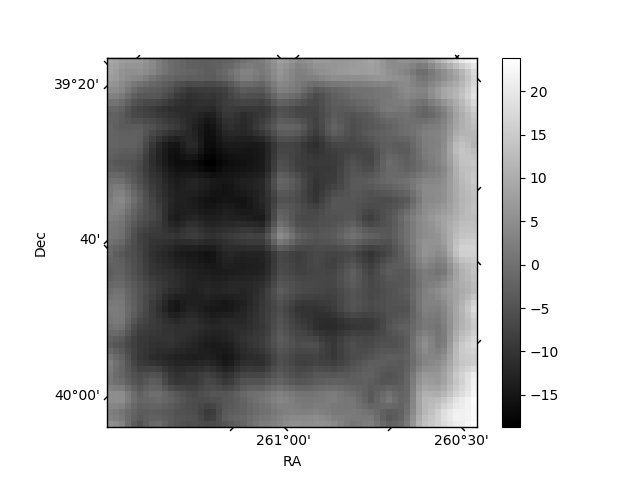
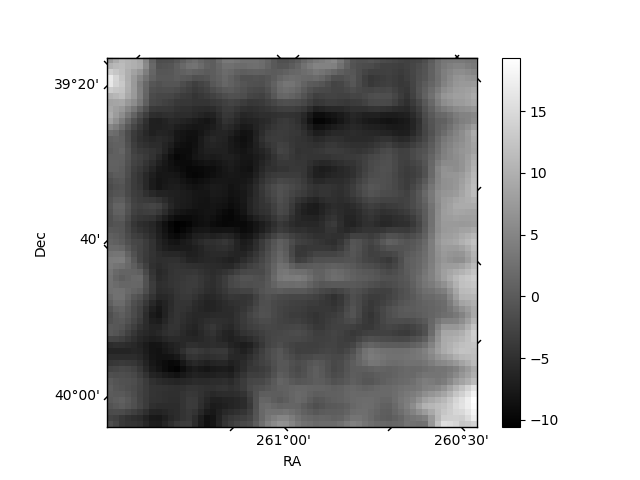
Histogram calculated using DETX and DETY for each event in the final _common_clean file
| Quadrant A | 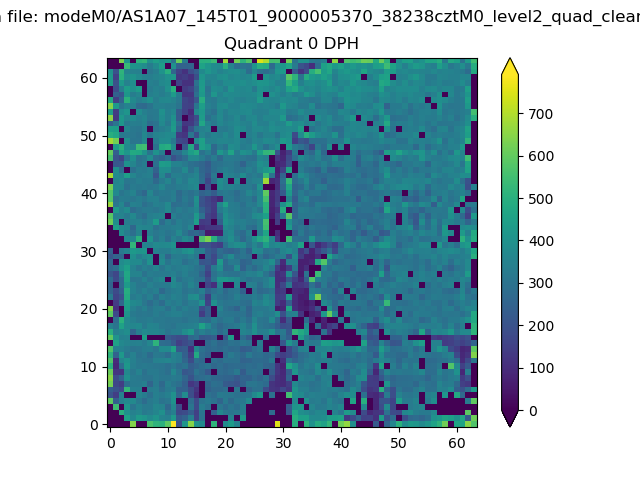 |
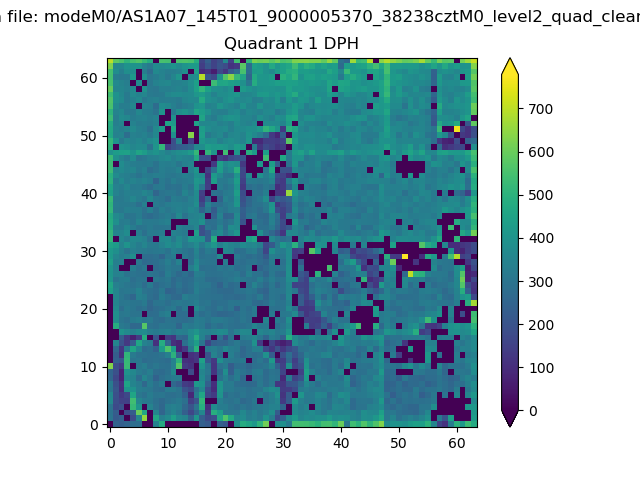 |
Quadrant B |
|---|---|---|---|
| Quadrant D | 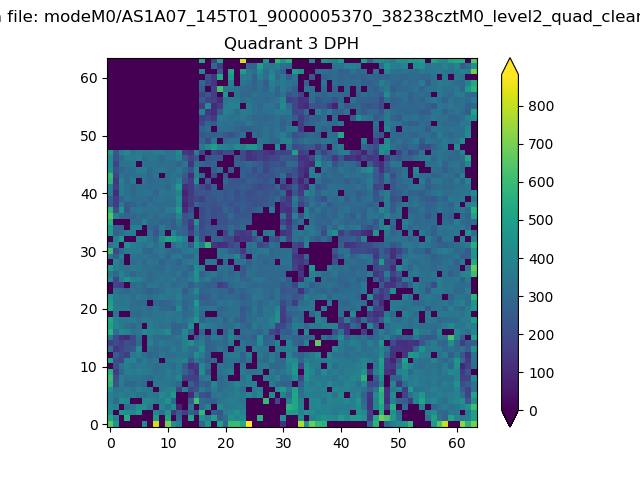 |
 |
Quadrant C |
| Plot type | Count rate plots | Images |
|---|---|---|
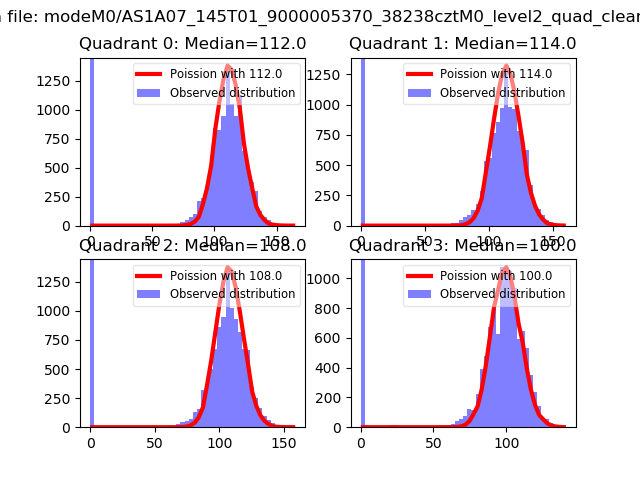
| Comparison with Poisson distribution Blue bars denote a histogram of data divided into 1 sec bins. Red curve is a Poisson curve with rate = median count rate of data. |
 |
 |
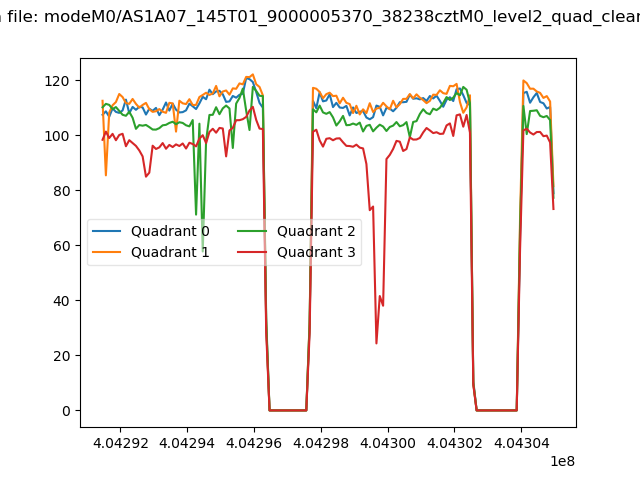
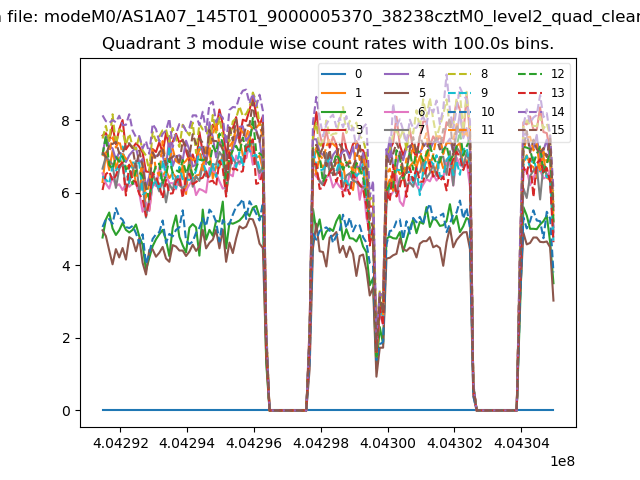
| Quadrant-wise count rates Data is divided into 100 sec bins |
 |
|
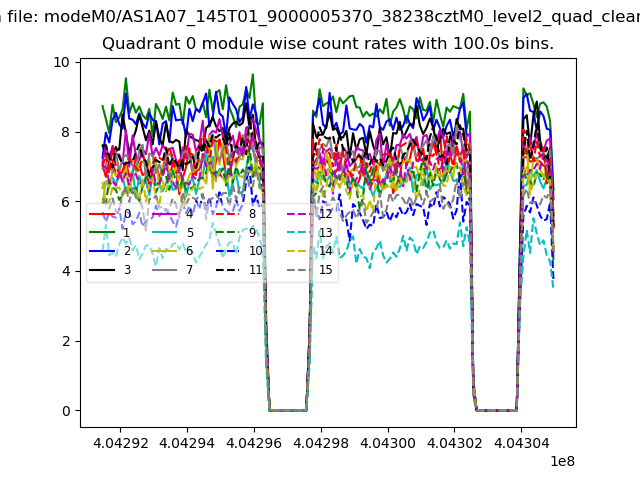
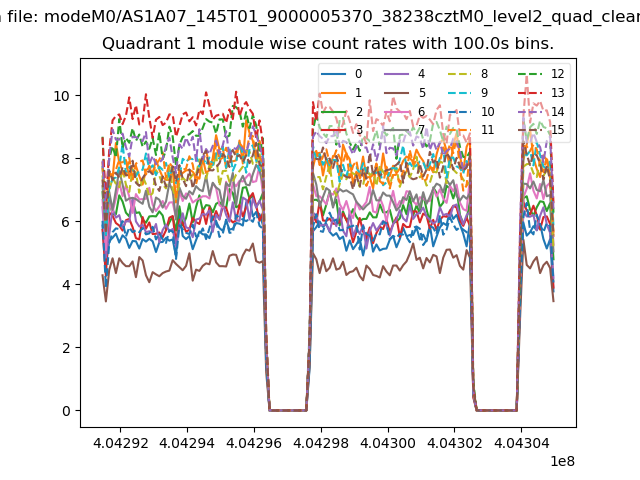
| Module-wise count rates for Quadrant A Data is divided into 100 sec bins |
 |
 |
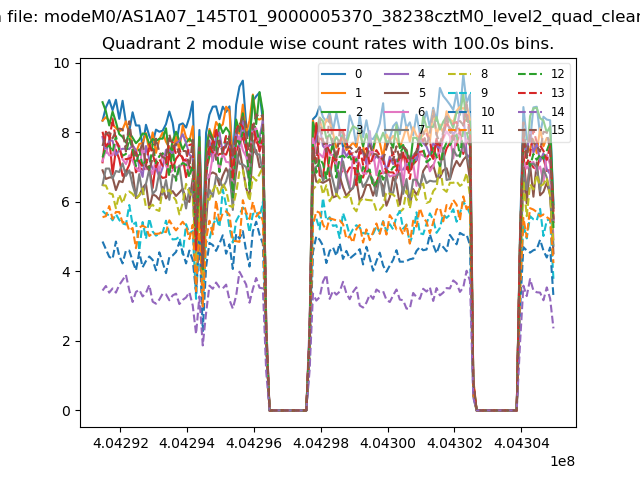
| Module-wise count rates for Quadrant B Data is divided into 100 sec bins |
 |
 |
| Module-wise count rates for Quadrant C Data is divided into 100 sec bins |
 |
 |
| Module-wise count rates for Quadrant D Data is divided into 100 sec bins |
 |
 |
| Parameter | Plot |
|---|---|
| CZT HV Monitor | 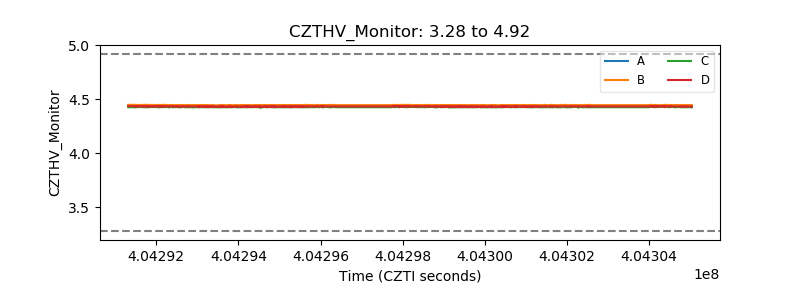 |
| D_VDD | 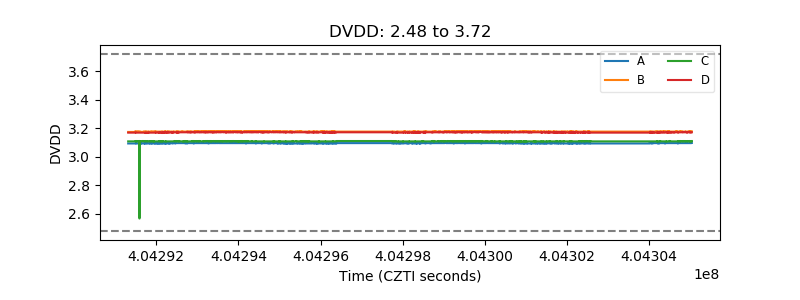 |
| Temperature 1 | 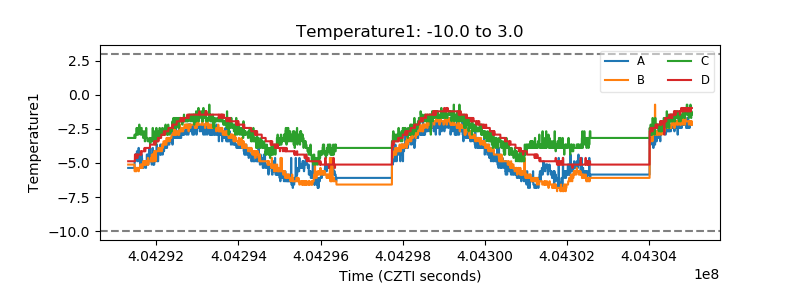 |
| Veto HV Monitor | 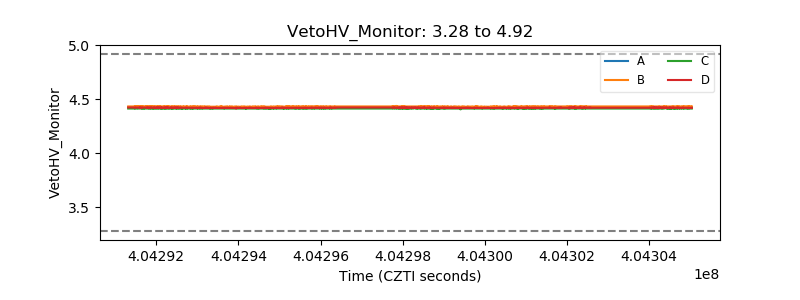 |
| Veto LLD | 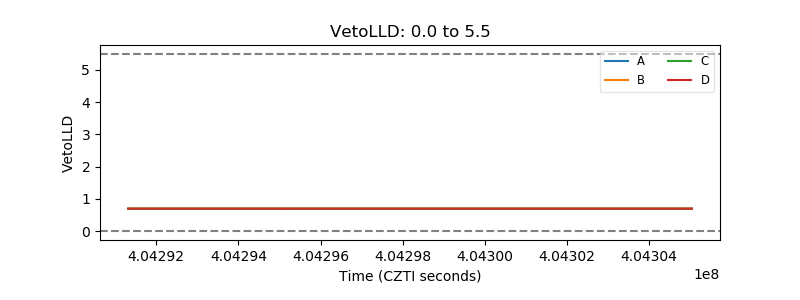 |
| Alpha Counter | 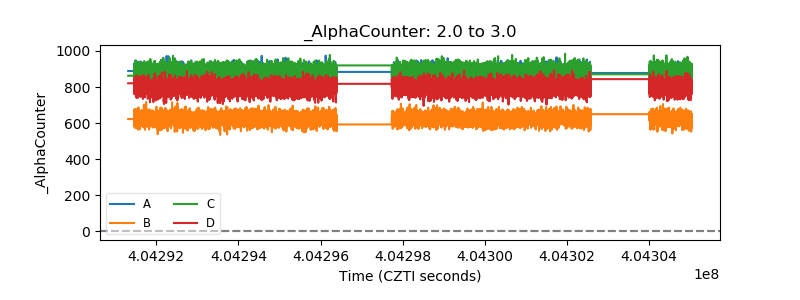 |
| _CPM_Rate | 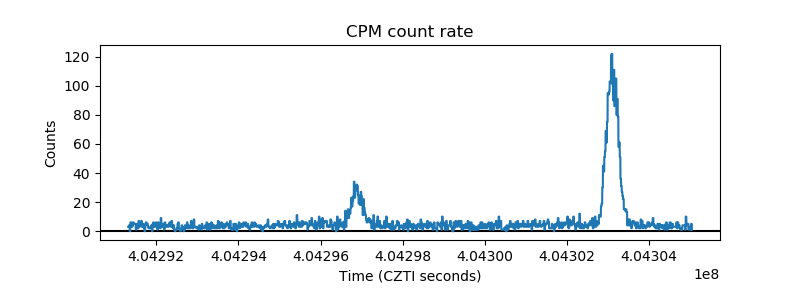 |
| CZT Counter | 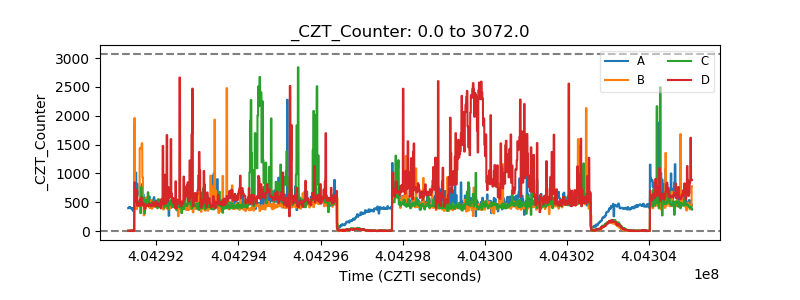 |
| +2.5 Volts monitor | 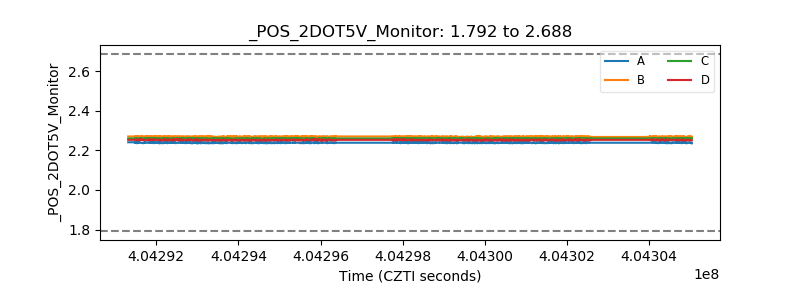 |
| +5 Volts monitor | 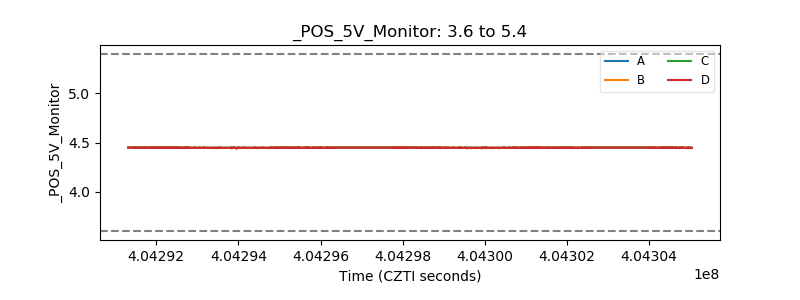 |
| _ROLL_ROT | 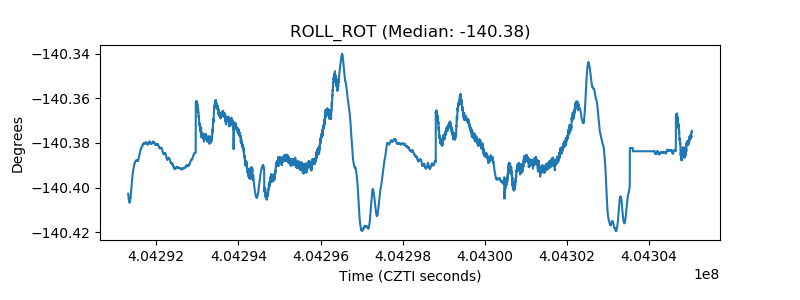 |
| _Roll_DEC | 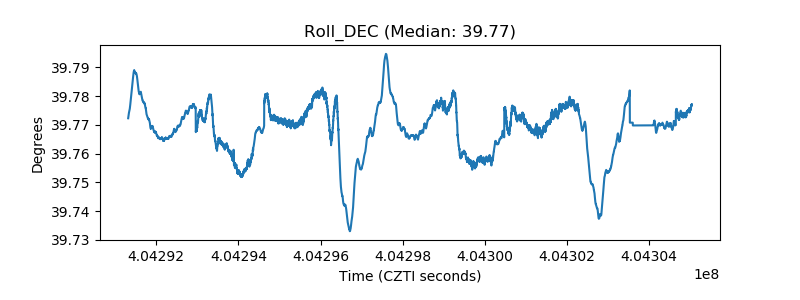 |
| _Roll_RA | 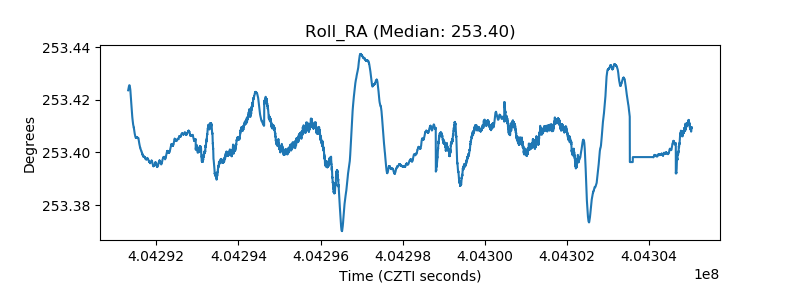 |
| Veto Counter | 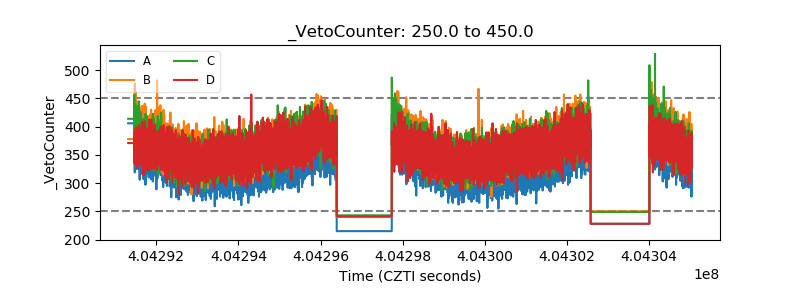 |