| Param | Original file | Final file |
|---|---|---|
| Filename | modeM0/AS1A07_145T01_9000005370_38239cztM0_level2.fits | modeM0/AS1A07_145T01_9000005370_38239cztM0_level2_quad_clean.evt |
| Size (bytes) | 400,461,120 | 91,932,480 |
| Size | 381.9 MB | 87.7 MB |
| Events in quadrant A | 2,963,090 | 620,627 |
| Events in quadrant B | 2,814,262 | 630,570 |
| Events in quadrant C | 2,692,594 | 602,734 |
| Events in quadrant D | 5,922,039 | 540,493 |
| Mode M9 | |||
|---|---|---|---|
| Quadrant | BADHDUFLAG | Total packets | Discarded packets |
| A | 0 | 15 | 0 |
| B | 0 | 15 | 0 |
| C | 0 | 15 | 0 |
| D | 0 | 15 | 0 |
| Mode SS | |||
|---|---|---|---|
| Quadrant | BADHDUFLAG | Total packets | Discarded packets |
| A | 0 | 114 | 0 |
| B | 0 | 114 | 0 |
| C | 0 | 114 | 0 |
| D | 0 | 114 | 0 |
| Mode M0 | |||
|---|---|---|---|
| Quadrant | BADHDUFLAG | Total packets | Discarded packets |
| A | 0 | 12261 | 2 |
| B | 0 | 12174 | 1 |
| C | 0 | 11500 | 1 |
| D | 0 | 21664 | 1 |
| Quadrant | Total seconds | Saturated seconds | Saturation percentage |
|---|---|---|---|
| A | 5558 | 11 | 0.197913% |
| B | 5558 | 77 | 1.385390% |
| C | 5558 | 19 | 0.341850% |
| D | 5558 | 274 | 4.929831% |
Noise dominated data is calculated using 1-second bins in cleaned event files. If a bin has >2000 counts, and if more than 50% of those come from <1% of pixels, then it is considered to be noise-dominated and hence unusable.
| Quadrant | # 1 sec bins | Bins with >0 counts | Bins with >2000 counts | High rate bins dominated by noise | Noise dominated (total time) | Noise dominated (detector-on time) | Marked lightcurve |
|---|---|---|---|---|---|---|---|
| A | 7110 | 5559 | 4 | 4 | 0.06% | 0.07% | 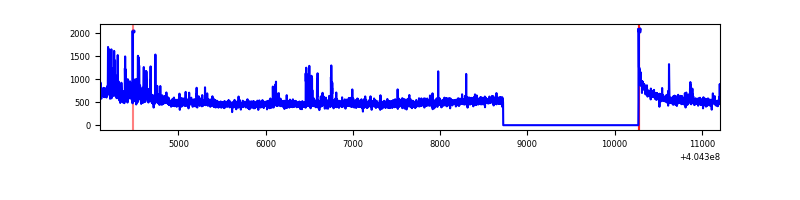 |
| B | 7110 | 5559 | 38 | 38 | 0.53% | 0.68% | 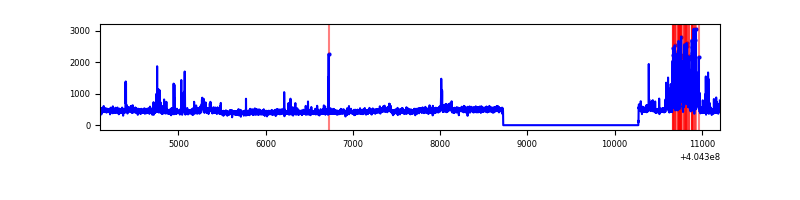 |
| C | 7110 | 5559 | 14 | 14 | 0.20% | 0.25% | 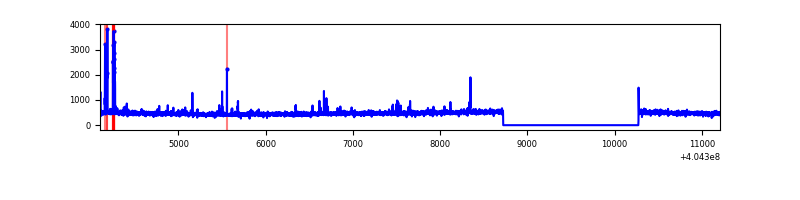 |
| D | 7110 | 5559 | 284 | 284 | 3.99% | 5.11% | 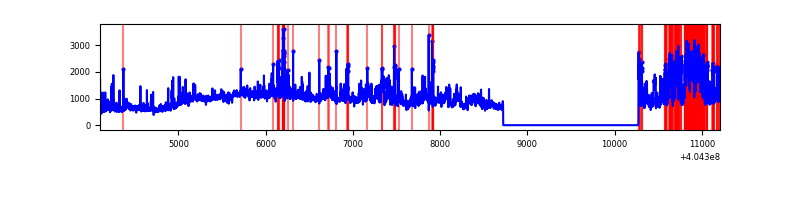 |
Top three noisy pixels from each quadrant. If the there are fewer than three noisy pixels in the level2.evt file, extra rows are filled as -1
| Pixel properties | Quadrant properties | ||||||
|---|---|---|---|---|---|---|---|
| Quadrant | DetID | PixID | Counts | Sigma | Mean | Median | Sigma |
| A | 10 | 83 | 366148 | 2912.29 | 613 | 599 | 125.5 |
| A | 13 | 248 | 153260 | 1216.23 | 613 | 599 | 125.5 |
| A | 0 | 247 | 34022 | 266.28 | 613 | 599 | 125.5 |
| B | 5 | 184 | 291662 | 2476.67 | 609 | 592 | 117.5 |
| B | 5 | 172 | 38332 | 321.12 | 609 | 592 | 117.5 |
| B | 15 | 85 | 26294 | 218.69 | 609 | 592 | 117.5 |
| C | 15 | 214 | 231886 | 1655.52 | 598 | 599 | 139.7 |
| C | 2 | 16 | 81641 | 580.09 | 598 | 599 | 139.7 |
| C | 9 | 236 | 24768 | 173.0 | 598 | 599 | 139.7 |
| D | 10 | 203 | 2171566 | 14995.82 | 592 | 575 | 144.8 |
| D | 12 | 235 | 545592 | 3764.63 | 592 | 575 | 144.8 |
| D | 12 | 233 | 431884 | 2979.21 | 592 | 575 | 144.8 |
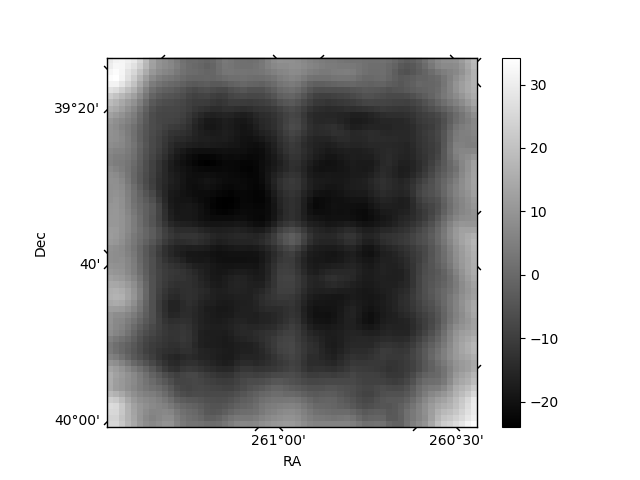
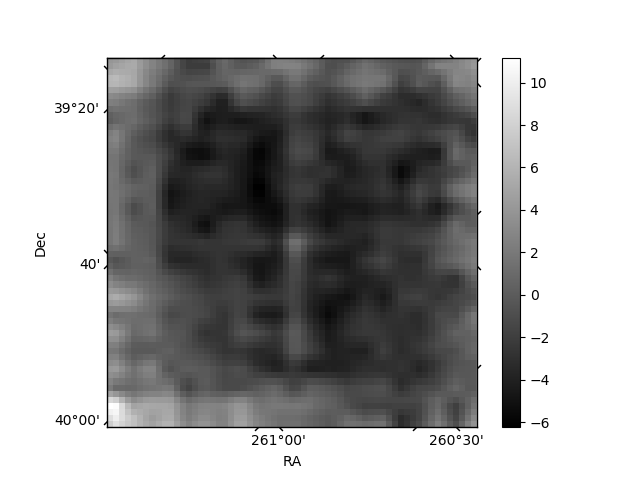
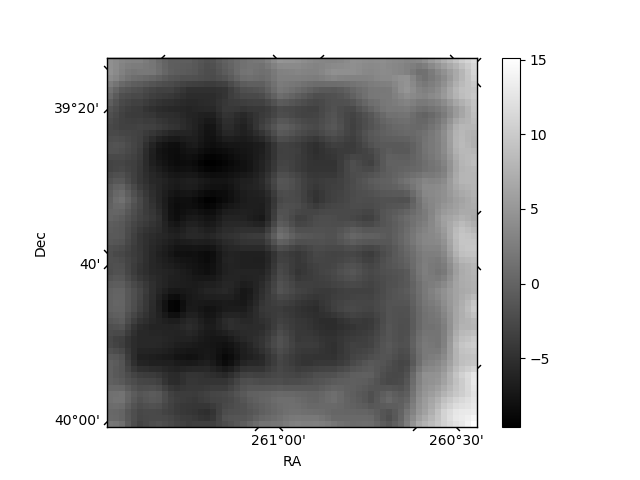
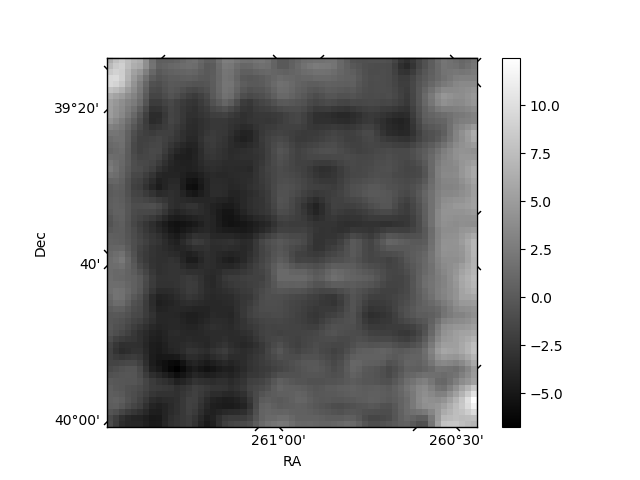
Histogram calculated using DETX and DETY for each event in the final _common_clean file
| Quadrant A | 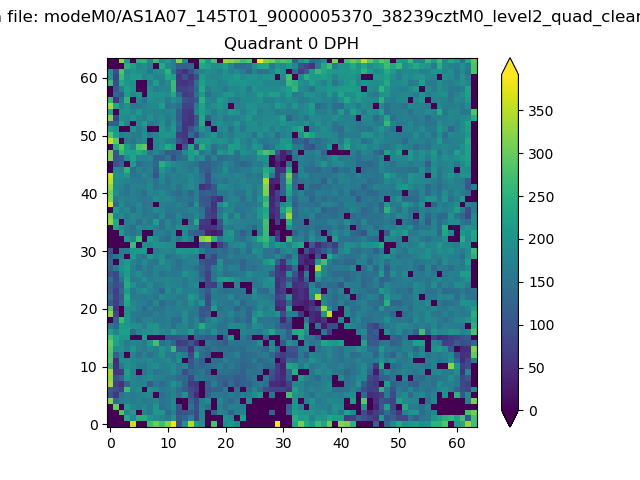 |
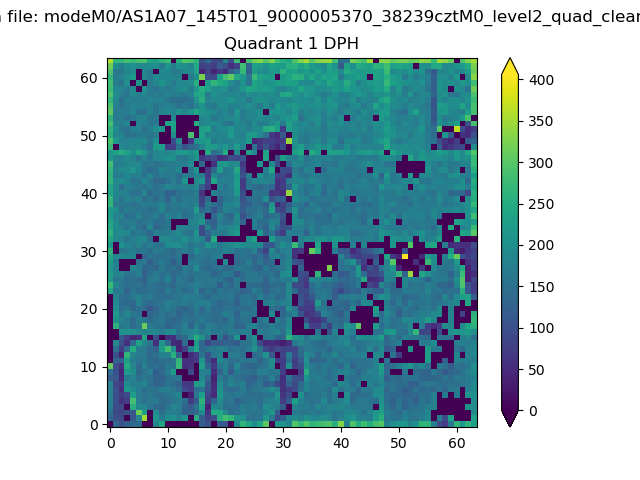 |
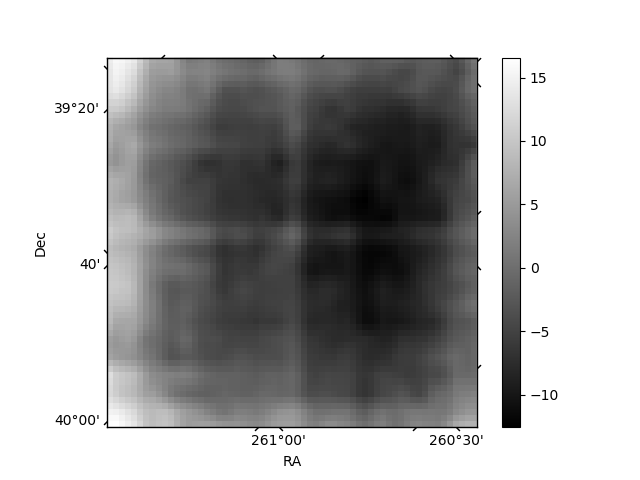
Quadrant B |
|---|---|---|---|
| Quadrant D | 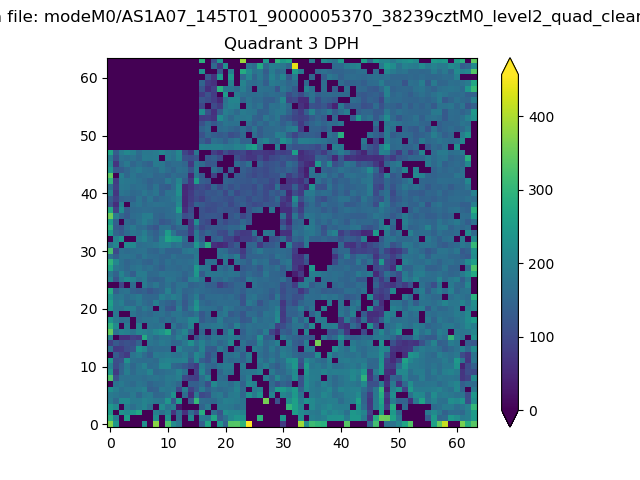 |
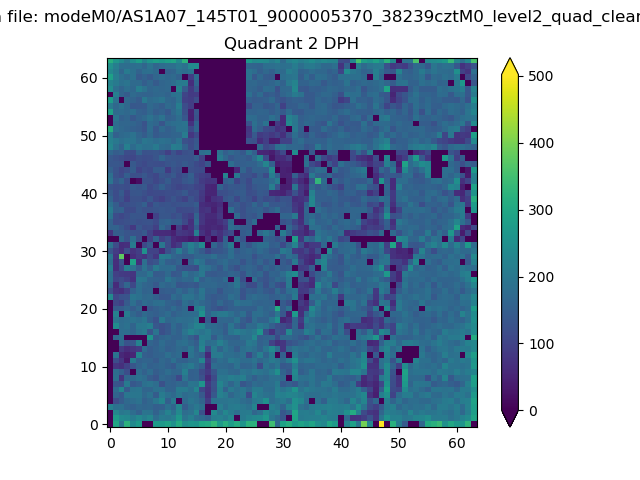 |
Quadrant C |
| Plot type | Count rate plots | Images |
|---|---|---|
| Comparison with Poisson distribution Blue bars denote a histogram of data divided into 1 sec bins. Red curve is a Poisson curve with rate = median count rate of data. |
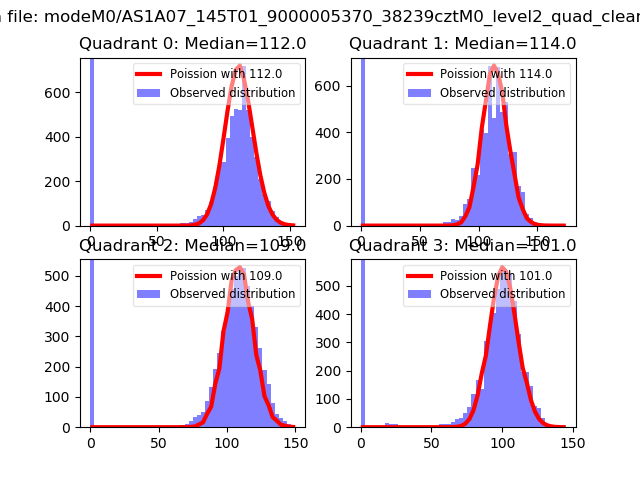 |
 |
| Quadrant-wise count rates Data is divided into 100 sec bins |
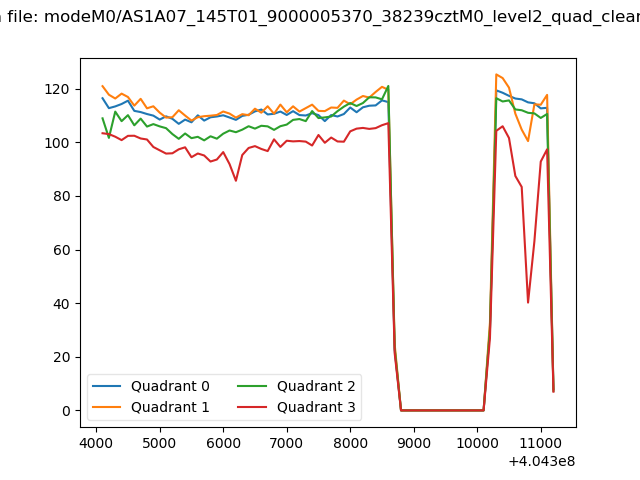 |
|
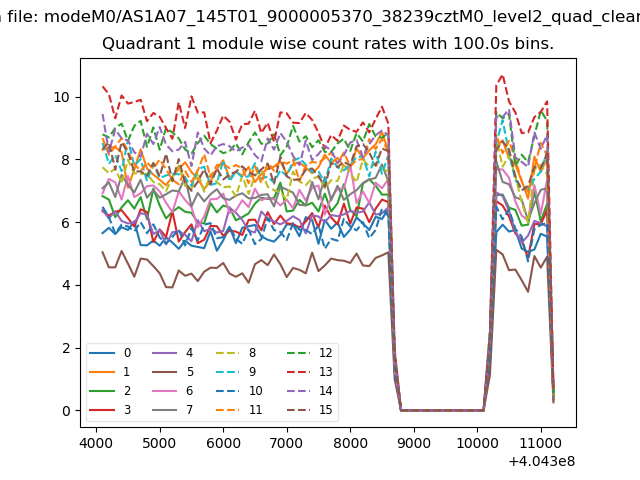
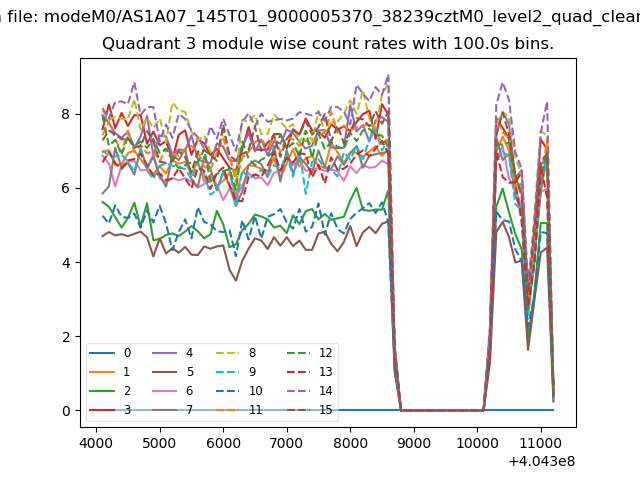
| Module-wise count rates for Quadrant A Data is divided into 100 sec bins |
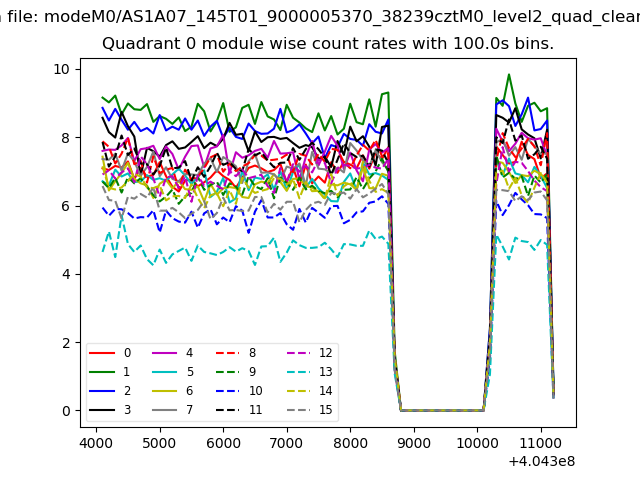 |
 |
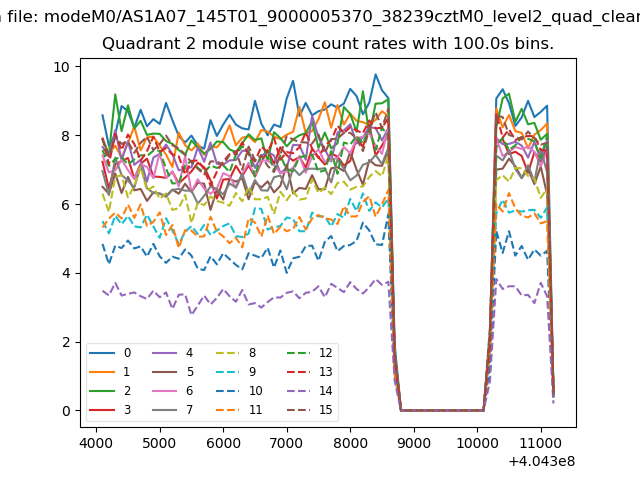
| Module-wise count rates for Quadrant B Data is divided into 100 sec bins |
 |
 |
| Module-wise count rates for Quadrant C Data is divided into 100 sec bins |
 |
 |
| Module-wise count rates for Quadrant D Data is divided into 100 sec bins |
 |
 |
| Parameter | Plot |
|---|---|
| CZT HV Monitor |  |
| D_VDD | 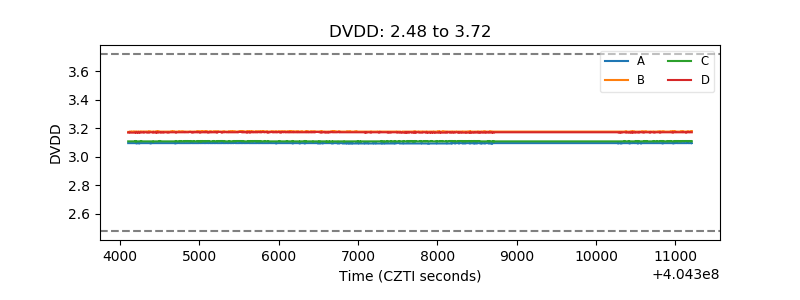 |
| Temperature 1 | 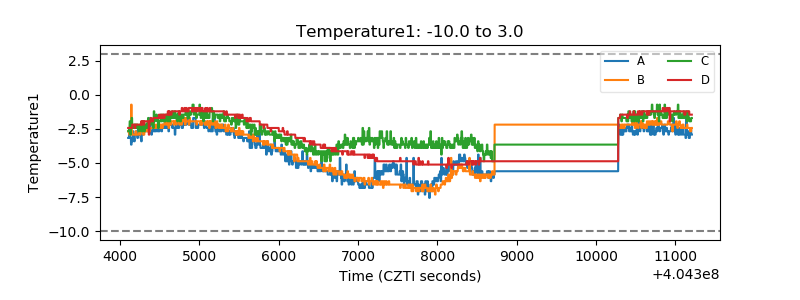 |
| Veto HV Monitor | 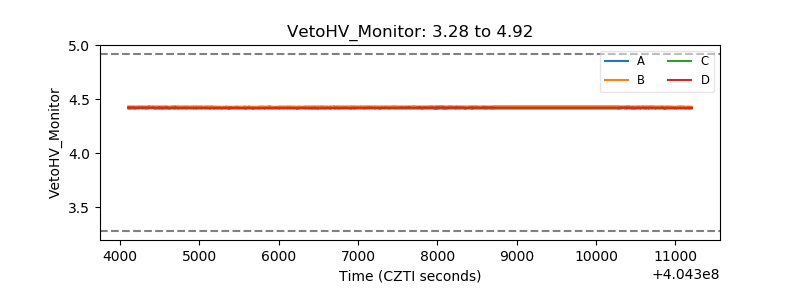 |
| Veto LLD | 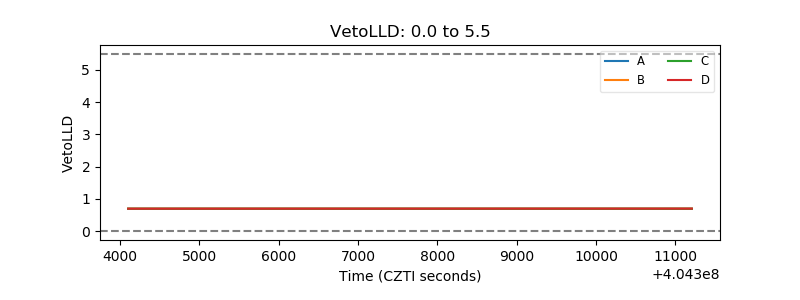 |
| Alpha Counter | 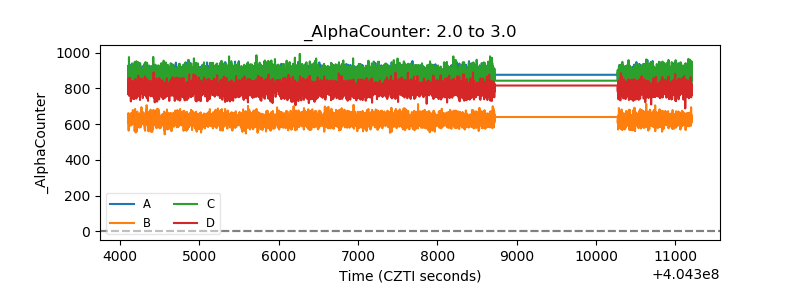 |
| _CPM_Rate | 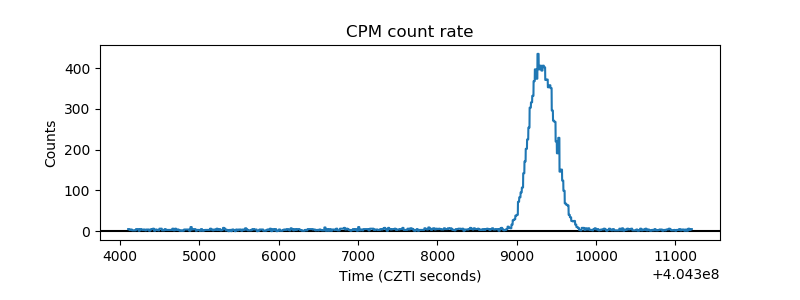 |
| CZT Counter | 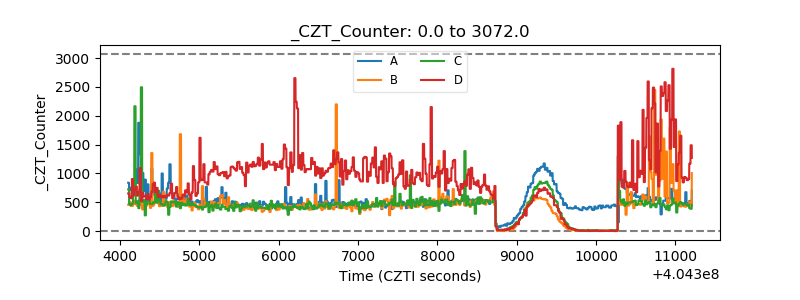 |
| +2.5 Volts monitor | 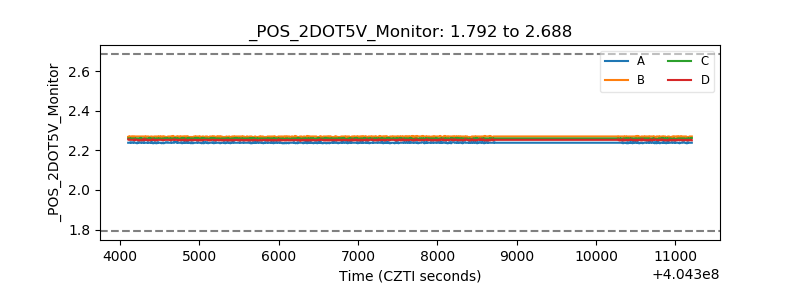 |
| +5 Volts monitor | 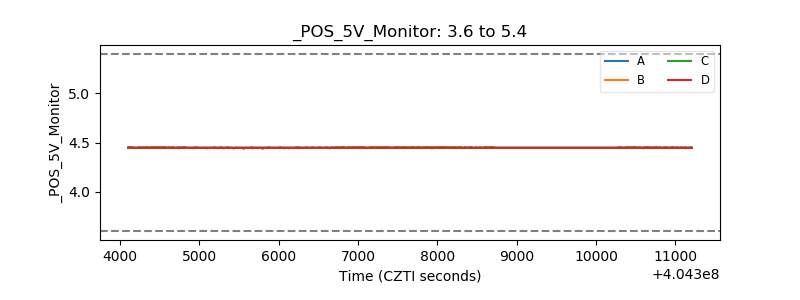 |
| _ROLL_ROT | 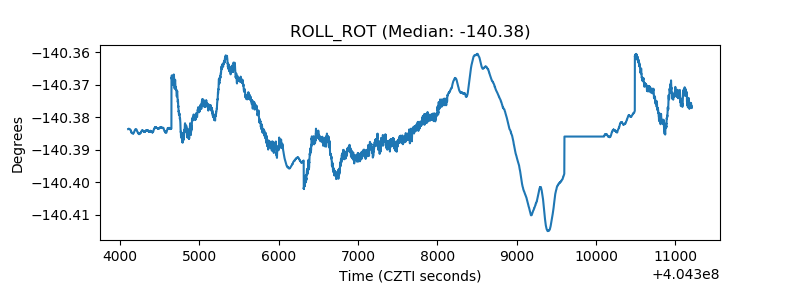 |
| _Roll_DEC | 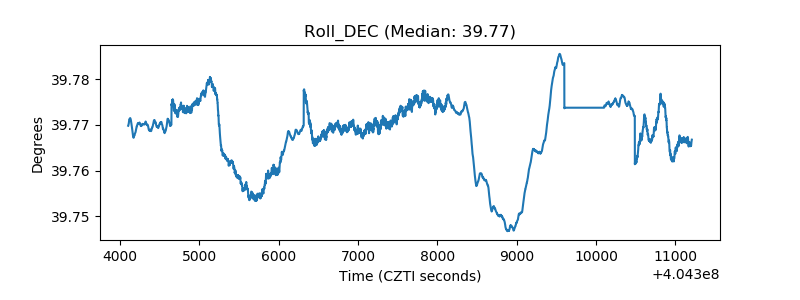 |
| _Roll_RA | 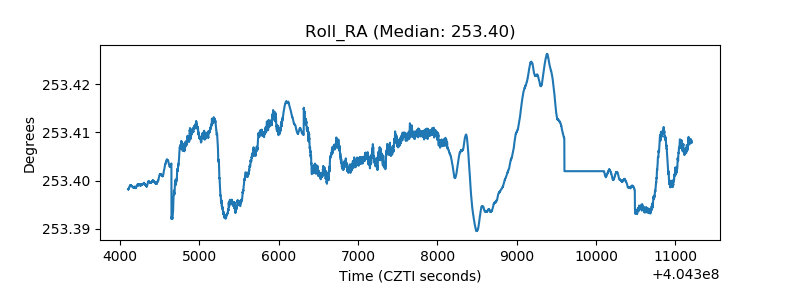 |
| Veto Counter | 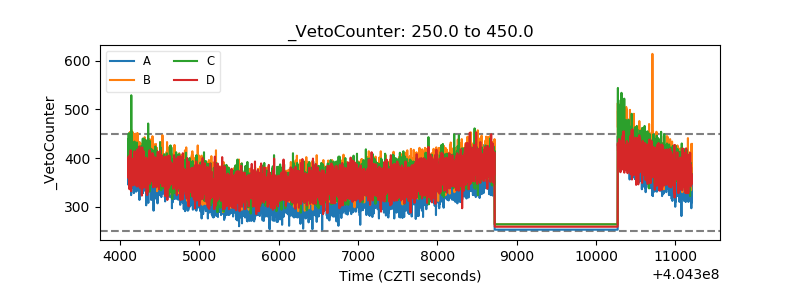 |