| Param | Original file | Final file |
|---|---|---|
| Filename | modeM0/AS1A07_145T01_9000005370_38240cztM0_level2.fits | modeM0/AS1A07_145T01_9000005370_38240cztM0_level2_quad_clean.evt |
| Size (bytes) | 514,437,120 | 88,168,320 |
| Size | 490.6 MB | 84.1 MB |
| Events in quadrant A | 2,864,214 | 628,762 |
| Events in quadrant B | 2,937,194 | 637,887 |
| Events in quadrant C | 2,635,478 | 610,588 |
| Events in quadrant D | 10,178,905 | 407,272 |
| Mode M9 | |||
|---|---|---|---|
| Quadrant | BADHDUFLAG | Total packets | Discarded packets |
| A | 0 | 18 | 0 |
| B | 0 | 18 | 0 |
| C | 0 | 18 | 0 |
| D | 0 | 19 | 0 |
| Mode SS | |||
|---|---|---|---|
| Quadrant | BADHDUFLAG | Total packets | Discarded packets |
| A | 0 | 112 | 0 |
| B | 0 | 112 | 0 |
| C | 0 | 112 | 0 |
| D | 0 | 112 | 0 |
| Mode M0 | |||
|---|---|---|---|
| Quadrant | BADHDUFLAG | Total packets | Discarded packets |
| A | 0 | 11931 | 3 |
| B | 0 | 12540 | 2 |
| C | 0 | 11215 | 2 |
| D | 0 | 33994 | 2 |
| Quadrant | Total seconds | Saturated seconds | Saturation percentage |
|---|---|---|---|
| A | 5500 | 18 | 0.327273% |
| B | 5500 | 111 | 2.018182% |
| C | 5500 | 11 | 0.200000% |
| D | 5500 | 1959 | 35.618182% |
Noise dominated data is calculated using 1-second bins in cleaned event files. If a bin has >2000 counts, and if more than 50% of those come from <1% of pixels, then it is considered to be noise-dominated and hence unusable.
| Quadrant | # 1 sec bins | Bins with >0 counts | Bins with >2000 counts | High rate bins dominated by noise | Noise dominated (total time) | Noise dominated (detector-on time) | Marked lightcurve |
|---|---|---|---|---|---|---|---|
| A | 7171 | 5501 | 8 | 8 | 0.11% | 0.15% | 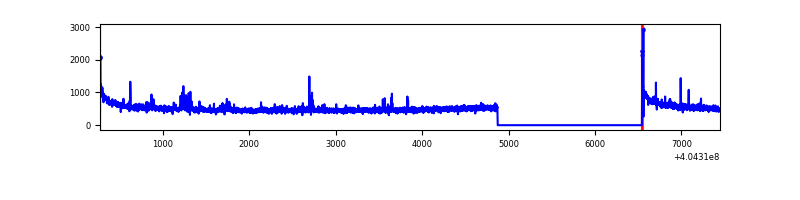 |
| B | 7171 | 5501 | 53 | 53 | 0.74% | 0.96% | 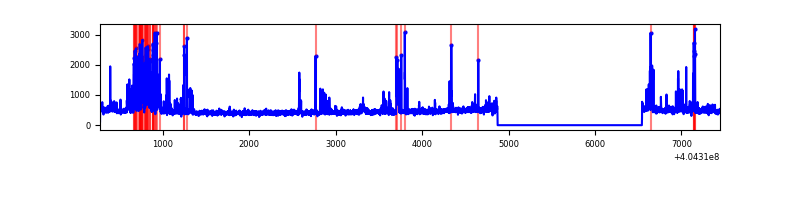 |
| C | 7171 | 5501 | 8 | 8 | 0.11% | 0.15% | 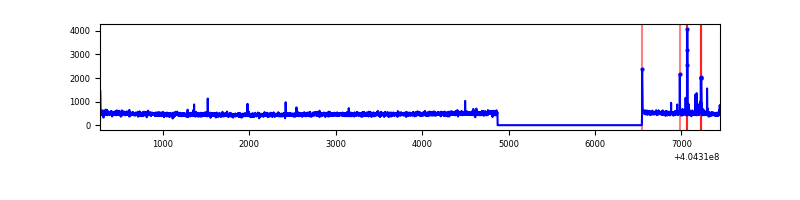 |
| D | 7171 | 5501 | 2368 | 2368 | 33.02% | 43.05% | 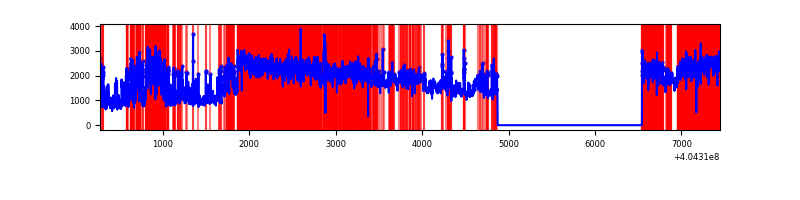 |
Top three noisy pixels from each quadrant. If the there are fewer than three noisy pixels in the level2.evt file, extra rows are filled as -1
| Pixel properties | Quadrant properties | ||||||
|---|---|---|---|---|---|---|---|
| Quadrant | DetID | PixID | Counts | Sigma | Mean | Median | Sigma |
| A | 10 | 83 | 397374 | 3197.62 | 612 | 598 | 124.1 |
| A | 13 | 248 | 46784 | 372.21 | 612 | 598 | 124.1 |
| A | 12 | 189 | 27646 | 217.98 | 612 | 598 | 124.1 |
| B | 5 | 184 | 311899 | 2651.41 | 608 | 592 | 117.4 |
| B | 5 | 172 | 107687 | 912.13 | 608 | 592 | 117.4 |
| B | 15 | 85 | 54497 | 459.11 | 608 | 592 | 117.4 |
| C | 15 | 214 | 231395 | 1638.79 | 600 | 603 | 140.8 |
| C | 9 | 236 | 41832 | 292.76 | 600 | 603 | 140.8 |
| C | 0 | 10 | 9318 | 61.88 | 600 | 603 | 140.8 |
| D | 10 | 203 | 5899130 | 43303.8 | 556 | 539 | 136.2 |
| D | 12 | 235 | 1184057 | 8688.66 | 556 | 539 | 136.2 |
| D | 12 | 233 | 340013 | 2492.21 | 556 | 539 | 136.2 |
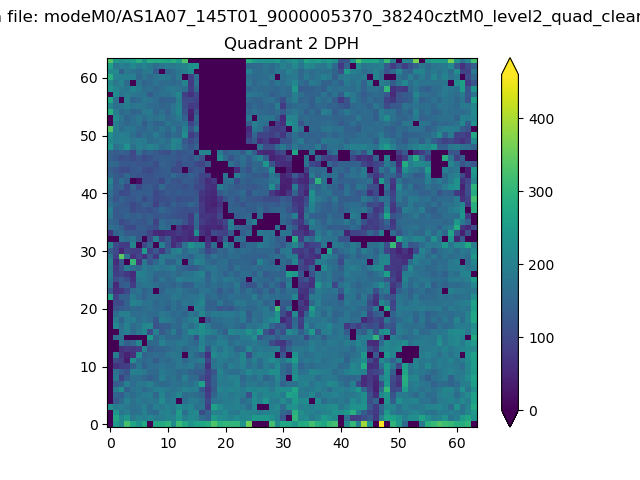
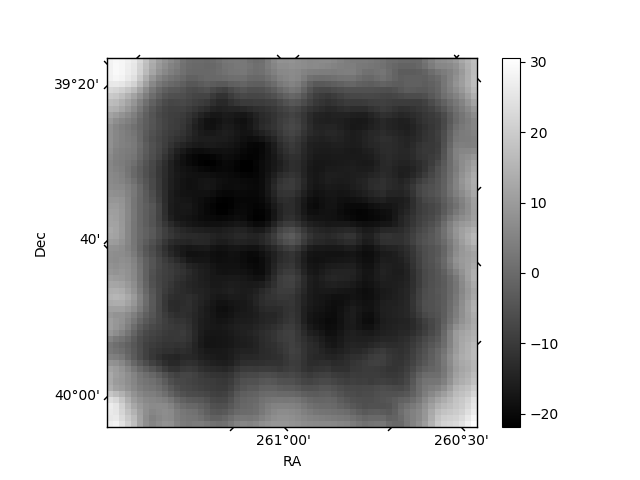
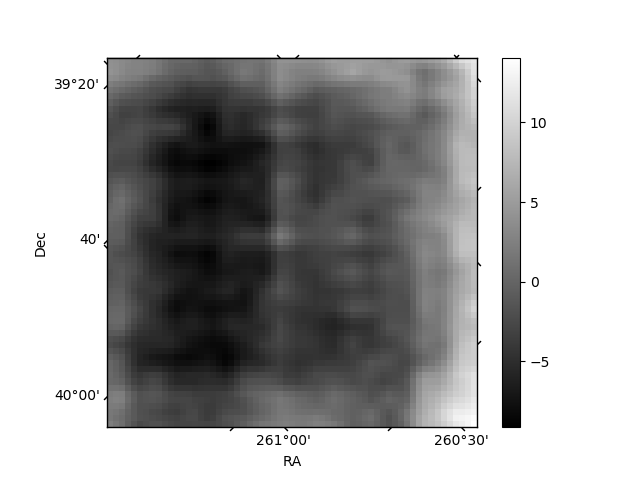
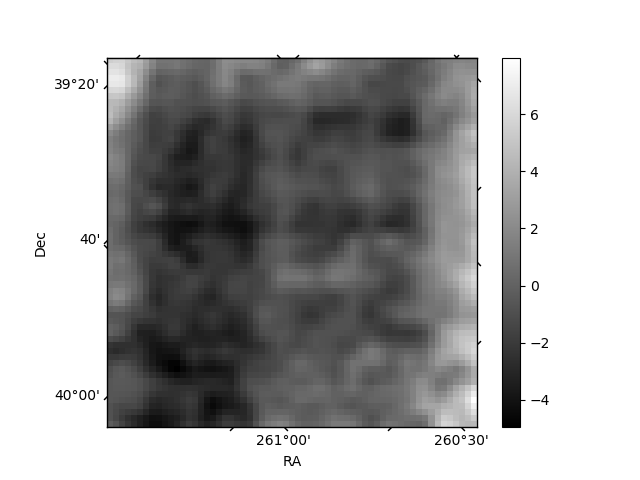
Histogram calculated using DETX and DETY for each event in the final _common_clean file
| Quadrant A | 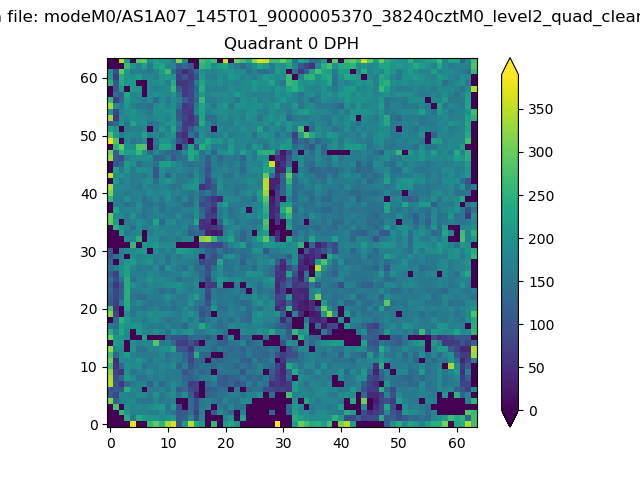 |
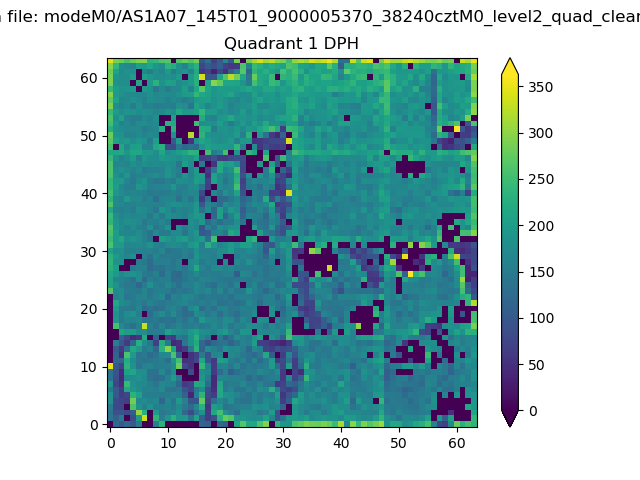 |
Quadrant B |
|---|---|---|---|
| Quadrant D | 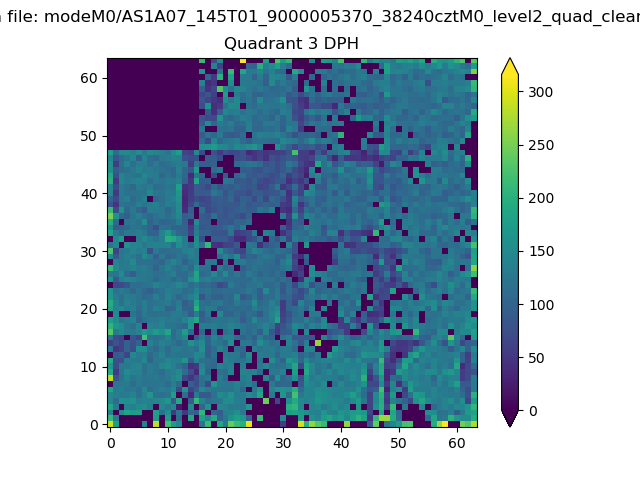 |
 |
Quadrant C |
| Plot type | Count rate plots | Images |
|---|---|---|
| Comparison with Poisson distribution Blue bars denote a histogram of data divided into 1 sec bins. Red curve is a Poisson curve with rate = median count rate of data. |
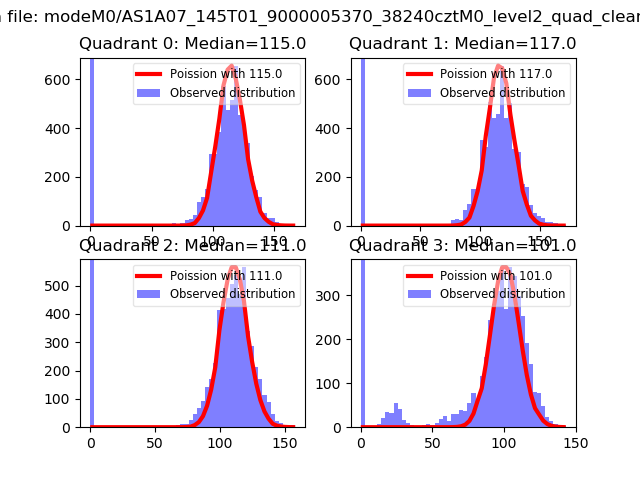 |
 |
| Quadrant-wise count rates Data is divided into 100 sec bins |
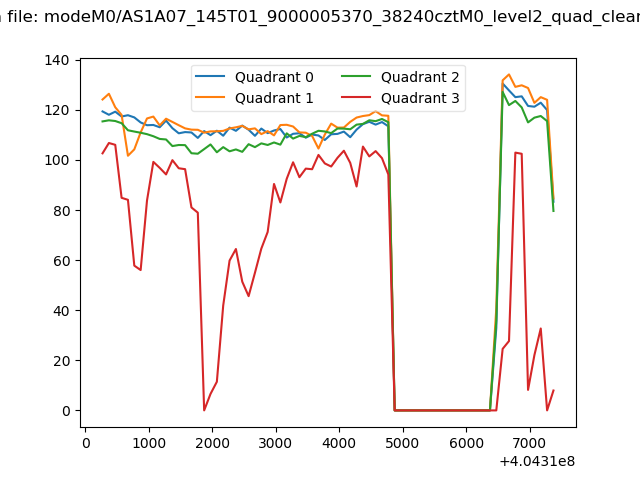 |
|
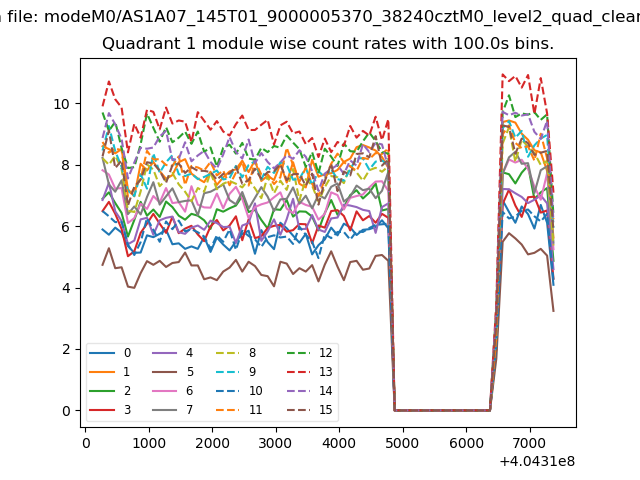
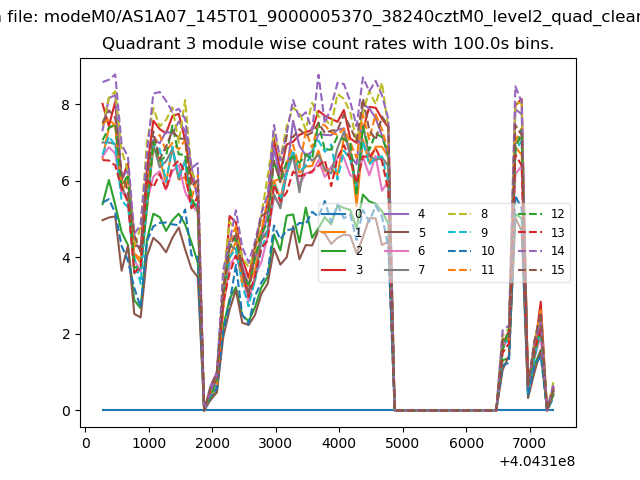
| Module-wise count rates for Quadrant A Data is divided into 100 sec bins |
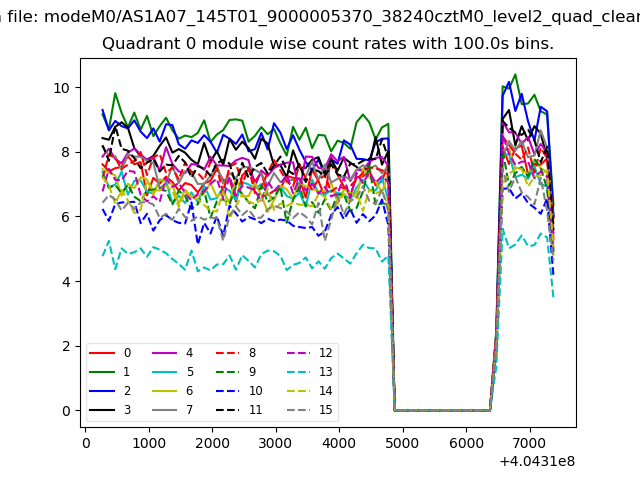 |
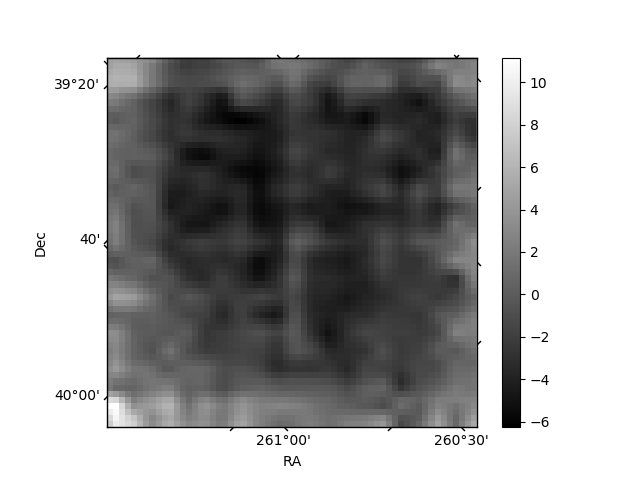 |
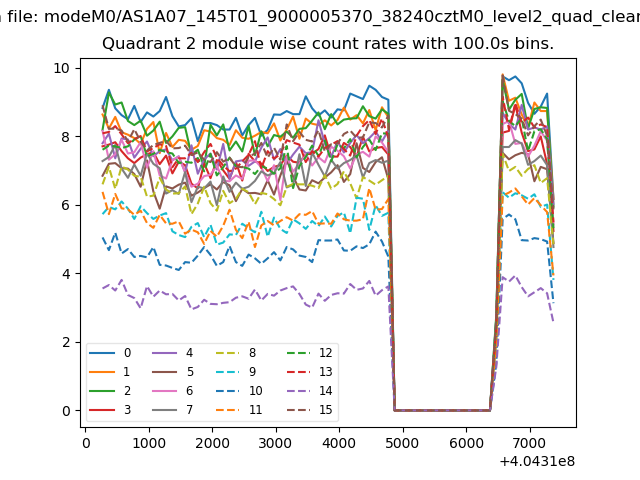
| Module-wise count rates for Quadrant B Data is divided into 100 sec bins |
 |
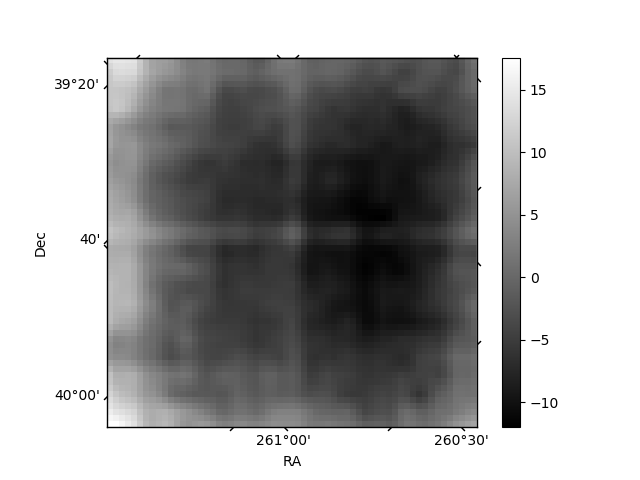 |
| Module-wise count rates for Quadrant C Data is divided into 100 sec bins |
 |
 |
| Module-wise count rates for Quadrant D Data is divided into 100 sec bins |
 |
 |
| Parameter | Plot |
|---|---|
| CZT HV Monitor |  |
| D_VDD | 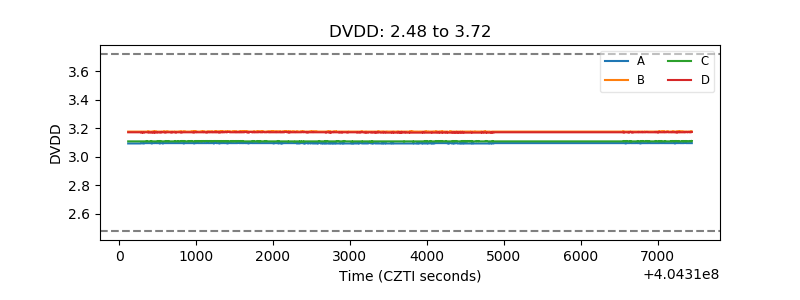 |
| Temperature 1 | 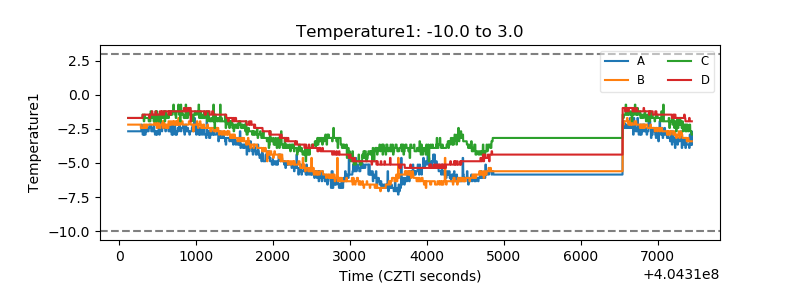 |
| Veto HV Monitor | 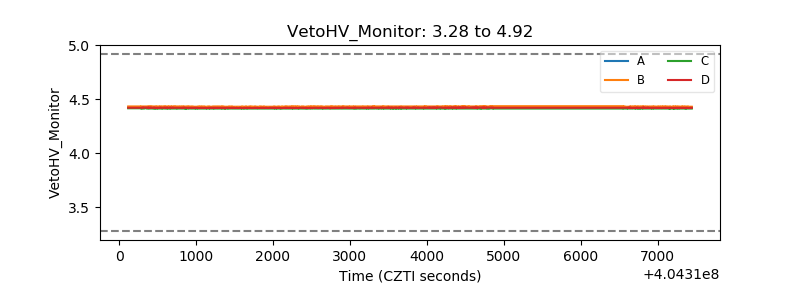 |
| Veto LLD | 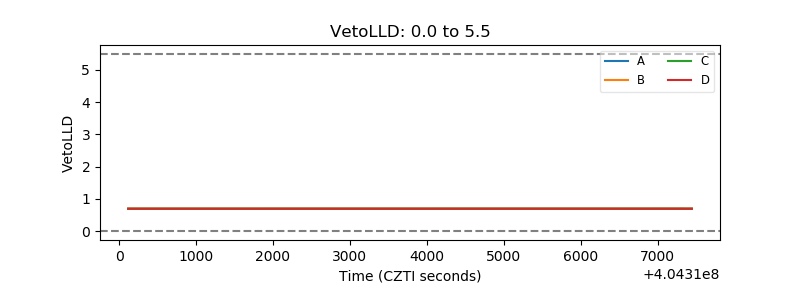 |
| Alpha Counter | 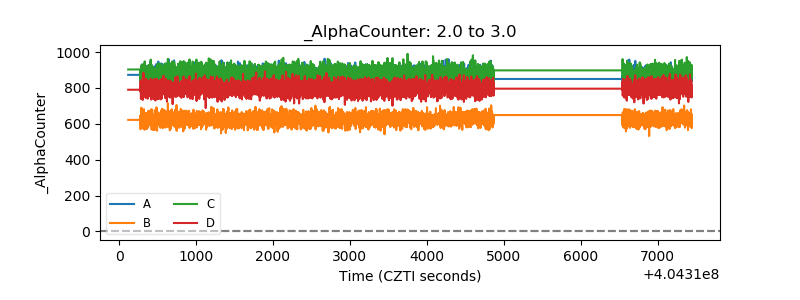 |
| _CPM_Rate | 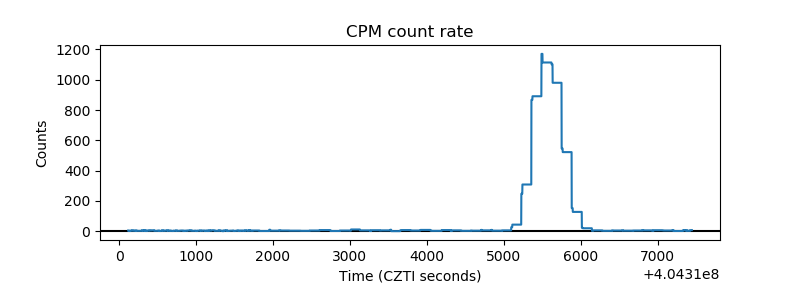 |
| CZT Counter | 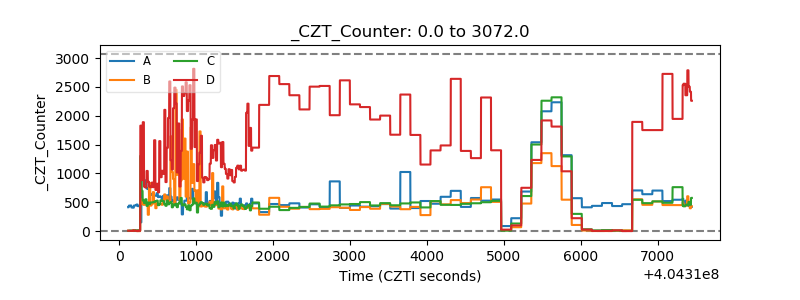 |
| +2.5 Volts monitor | 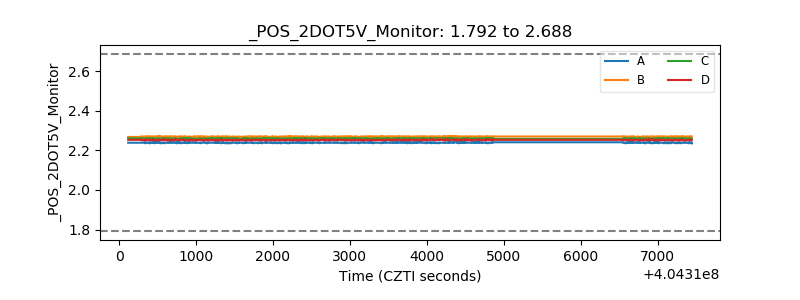 |
| +5 Volts monitor | 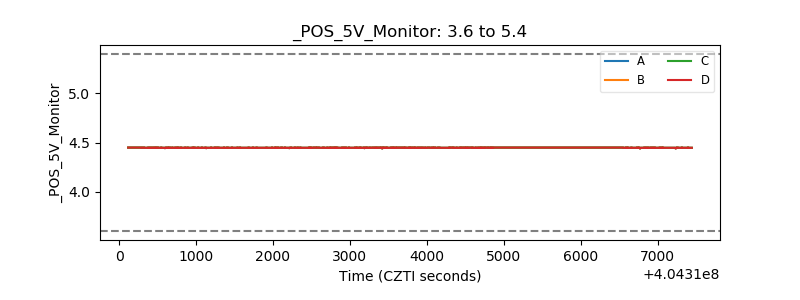 |
| _ROLL_ROT | 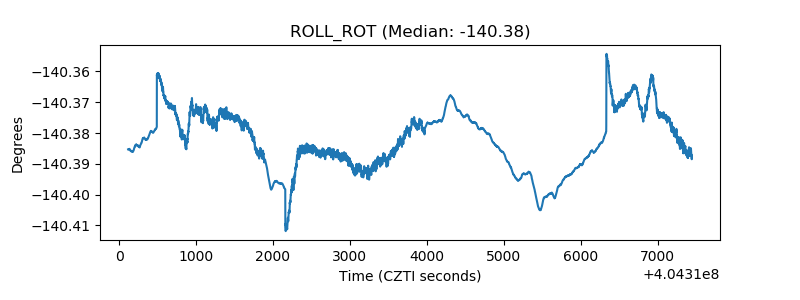 |
| _Roll_DEC | 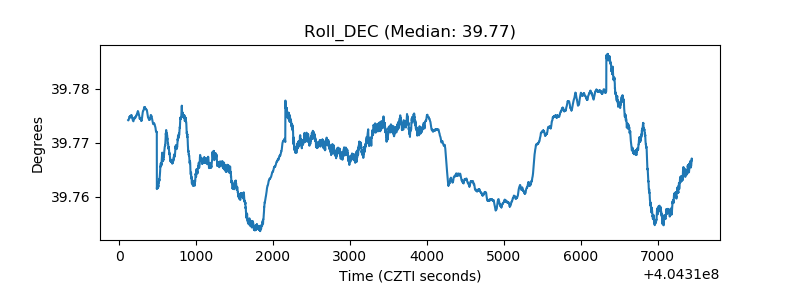 |
| _Roll_RA | 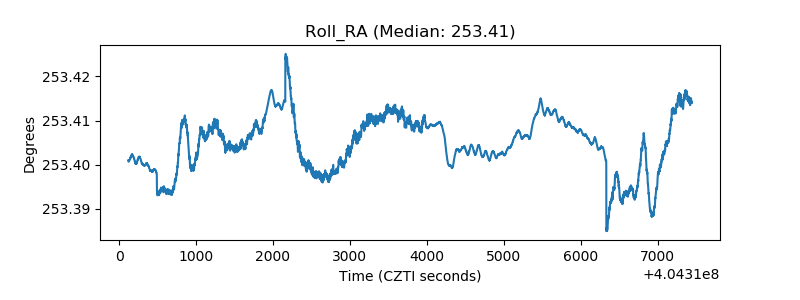 |
| Veto Counter | 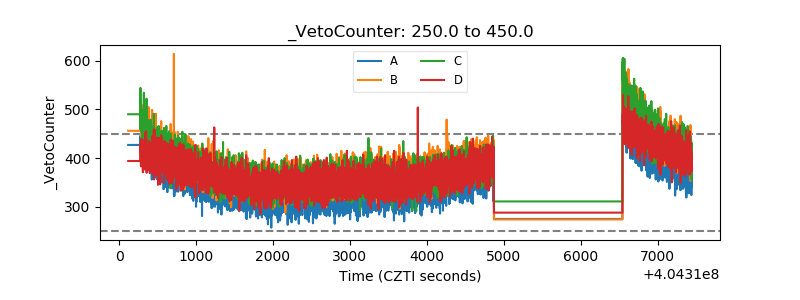 |