| Param | Original file | Final file |
|---|---|---|
| Filename | modeM0/AS1A07_145T01_9000005370_38242cztM0_level2.fits | modeM0/AS1A07_145T01_9000005370_38242cztM0_level2_quad_clean.evt |
| Size (bytes) | 493,868,160 | 86,336,640 |
| Size | 471.0 MB | 82.3 MB |
| Events in quadrant A | 2,922,888 | 630,429 |
| Events in quadrant B | 2,653,695 | 648,100 |
| Events in quadrant C | 3,466,194 | 591,534 |
| Events in quadrant D | 8,825,001 | 371,174 |
| Mode M9 | |||
|---|---|---|---|
| Quadrant | BADHDUFLAG | Total packets | Discarded packets |
| A | 0 | 18 | 0 |
| B | 0 | 18 | 0 |
| C | 0 | 18 | 0 |
| D | 0 | 18 | 0 |
| Mode SS | |||
|---|---|---|---|
| Quadrant | BADHDUFLAG | Total packets | Discarded packets |
| A | 0 | 110 | 0 |
| B | 0 | 110 | 0 |
| C | 0 | 110 | 0 |
| D | 0 | 110 | 0 |
| Mode M0 | |||
|---|---|---|---|
| Quadrant | BADHDUFLAG | Total packets | Discarded packets |
| A | 0 | 12036 | 2 |
| B | 0 | 11429 | 1 |
| C | 0 | 13526 | 1 |
| D | 0 | 30014 | 1 |
| Quadrant | Total seconds | Saturated seconds | Saturation percentage |
|---|---|---|---|
| A | 5320 | 14 | 0.263158% |
| B | 5320 | 34 | 0.639098% |
| C | 5320 | 284 | 5.338346% |
| D | 5320 | 2086 | 39.210526% |
Noise dominated data is calculated using 1-second bins in cleaned event files. If a bin has >2000 counts, and if more than 50% of those come from <1% of pixels, then it is considered to be noise-dominated and hence unusable.
| Quadrant | # 1 sec bins | Bins with >0 counts | Bins with >2000 counts | High rate bins dominated by noise | Noise dominated (total time) | Noise dominated (detector-on time) | Marked lightcurve |
|---|---|---|---|---|---|---|---|
| A | 7143 | 5321 | 9 | 9 | 0.13% | 0.17% | 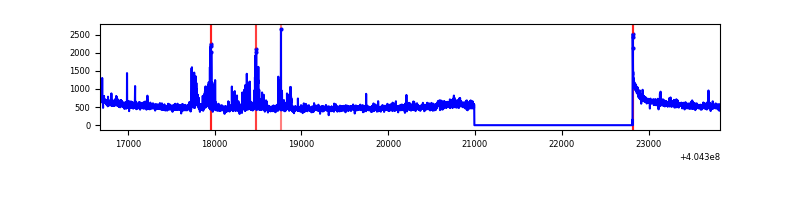 |
| B | 7143 | 5320 | 21 | 21 | 0.29% | 0.39% | 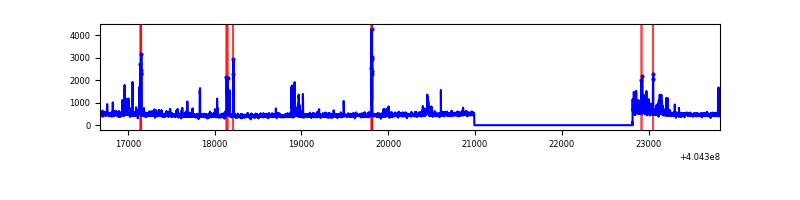 |
| C | 7143 | 5321 | 235 | 235 | 3.29% | 4.42% | 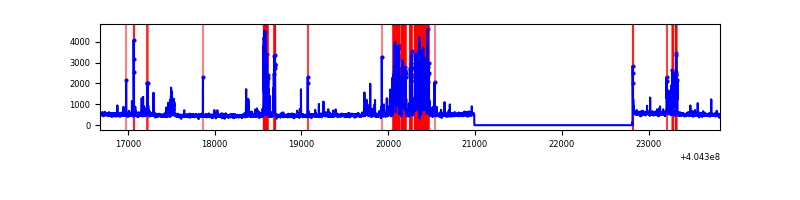 |
| D | 7143 | 5321 | 1983 | 1983 | 27.76% | 37.27% | 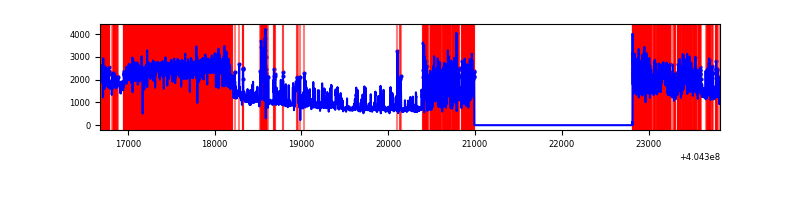 |
Top three noisy pixels from each quadrant. If the there are fewer than three noisy pixels in the level2.evt file, extra rows are filled as -1
| Pixel properties | Quadrant properties | ||||||
|---|---|---|---|---|---|---|---|
| Quadrant | DetID | PixID | Counts | Sigma | Mean | Median | Sigma |
| A | 10 | 83 | 348983 | 2862.16 | 601 | 589 | 121.7 |
| A | 13 | 248 | 182287 | 1492.7 | 601 | 589 | 121.7 |
| A | 12 | 189 | 31413 | 253.23 | 601 | 589 | 121.7 |
| B | 15 | 85 | 82338 | 708.09 | 603 | 587 | 115.5 |
| B | 5 | 172 | 80382 | 691.14 | 603 | 587 | 115.5 |
| B | 5 | 184 | 46707 | 399.47 | 603 | 587 | 115.5 |
| C | 9 | 236 | 737768 | 5449.62 | 581 | 585 | 135.3 |
| C | 15 | 214 | 216865 | 1598.85 | 581 | 585 | 135.3 |
| C | 14 | 254 | 179531 | 1322.86 | 581 | 585 | 135.3 |
| D | 10 | 203 | 4163659 | 32535.76 | 523 | 509 | 128.0 |
| D | 1 | 52 | 1225950 | 9577.04 | 523 | 509 | 128.0 |
| D | 12 | 235 | 631126 | 4928.38 | 523 | 509 | 128.0 |
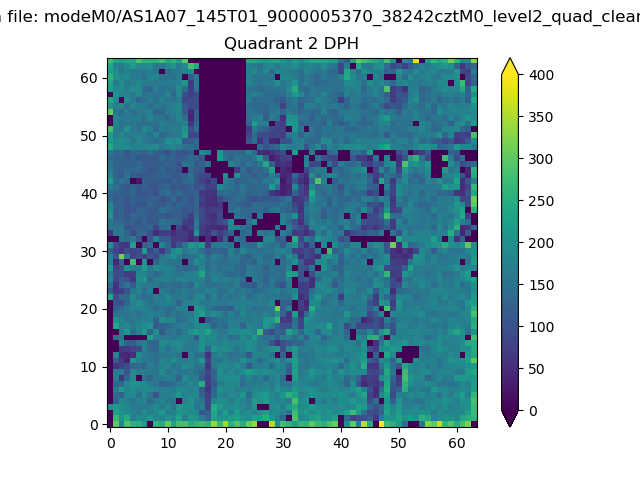
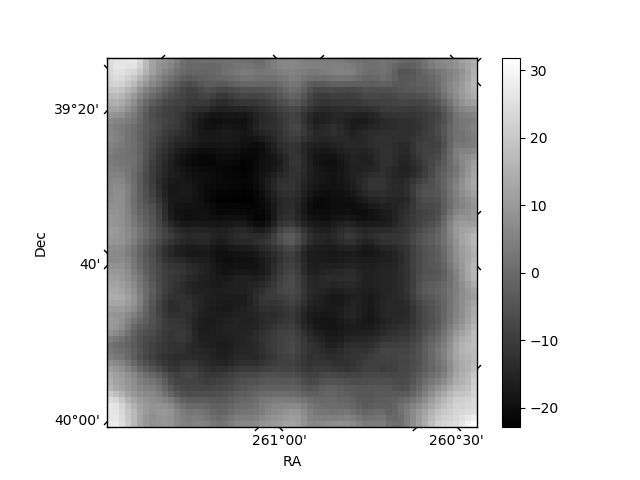
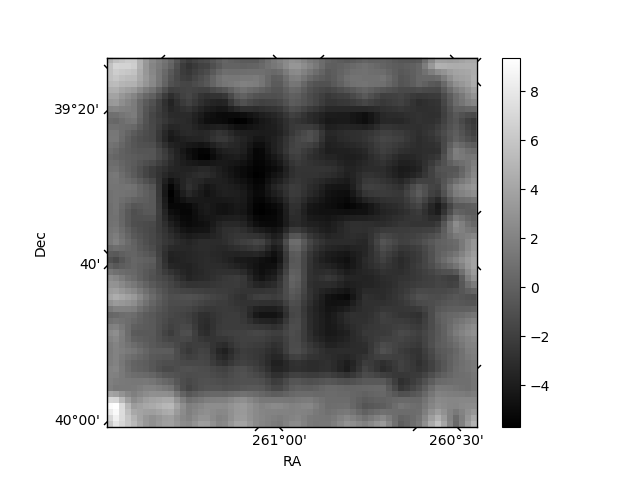
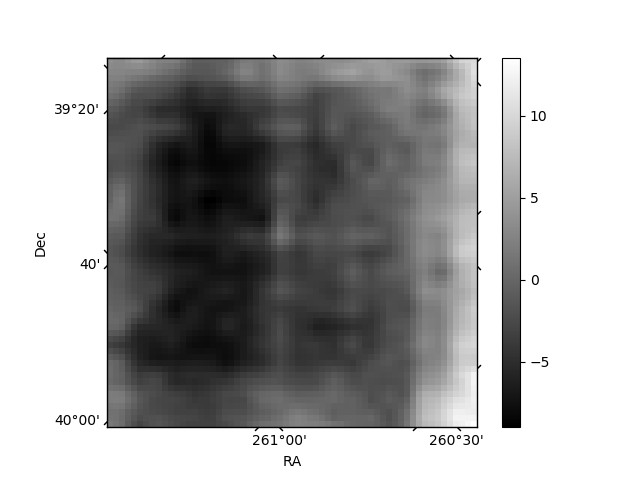
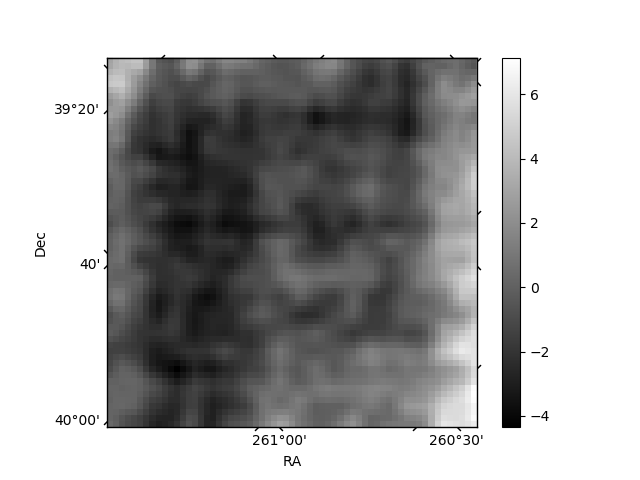
Histogram calculated using DETX and DETY for each event in the final _common_clean file
| Quadrant A | 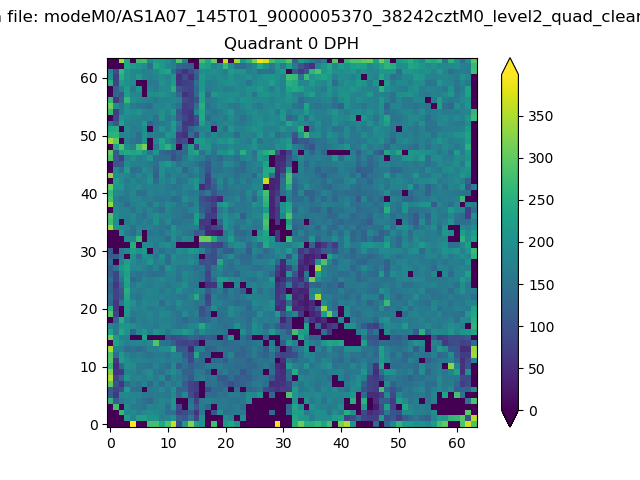 |
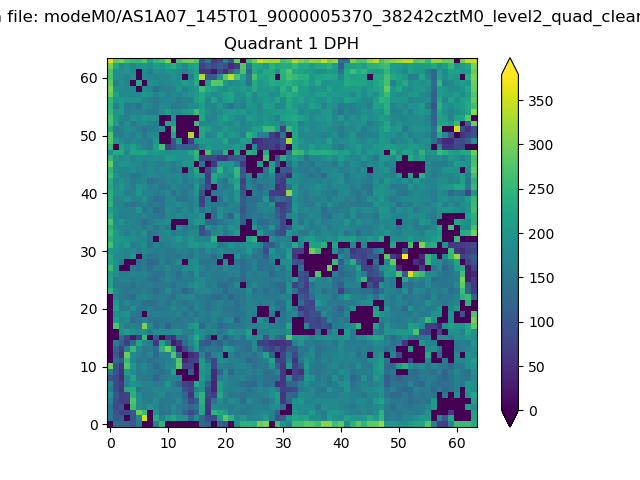 |
Quadrant B |
|---|---|---|---|
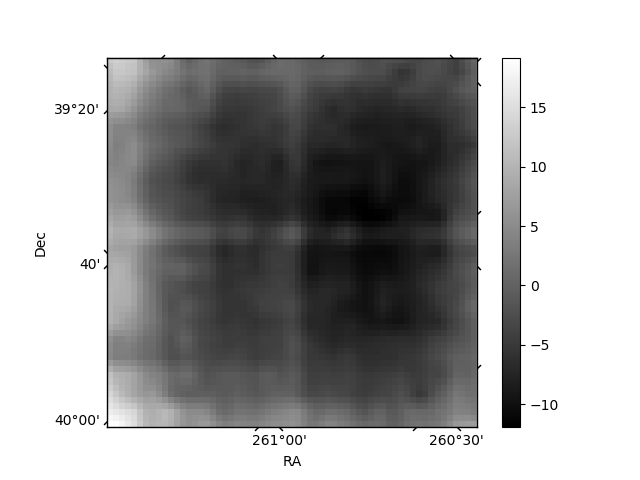
| Quadrant D | 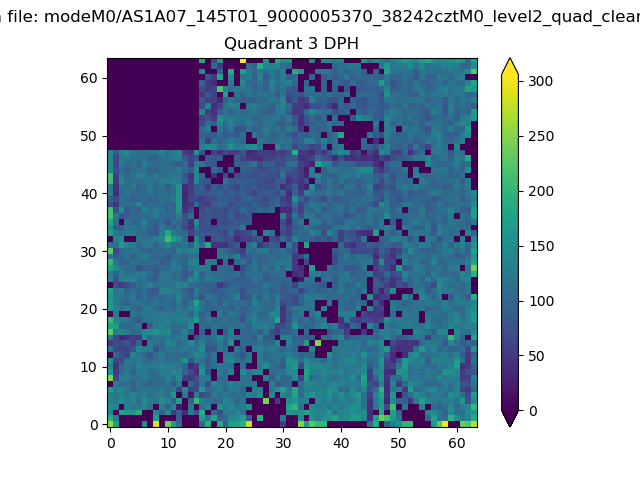 |
 |
Quadrant C |
| Plot type | Count rate plots | Images |
|---|---|---|
| Comparison with Poisson distribution Blue bars denote a histogram of data divided into 1 sec bins. Red curve is a Poisson curve with rate = median count rate of data. |
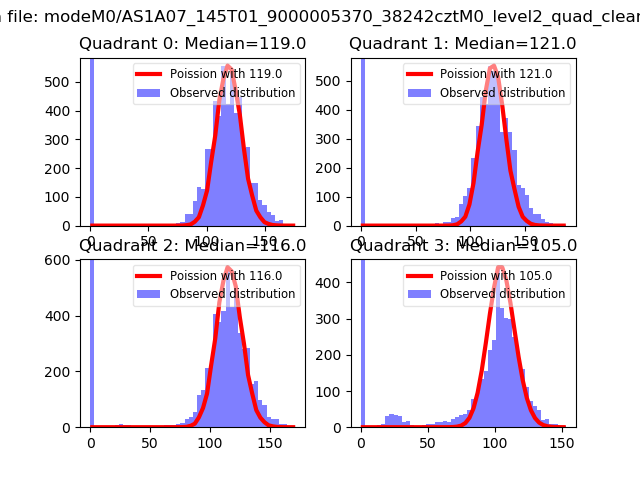 |
 |
| Quadrant-wise count rates Data is divided into 100 sec bins |
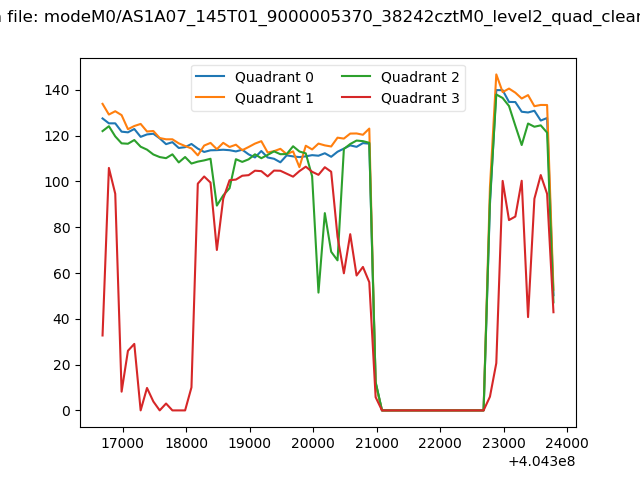 |
|
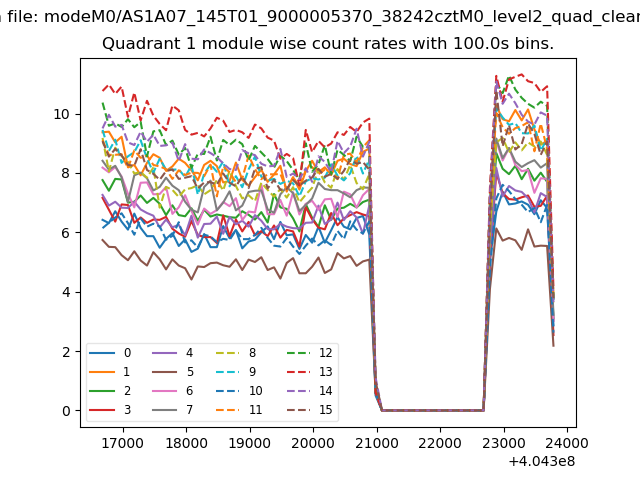
| Module-wise count rates for Quadrant A Data is divided into 100 sec bins |
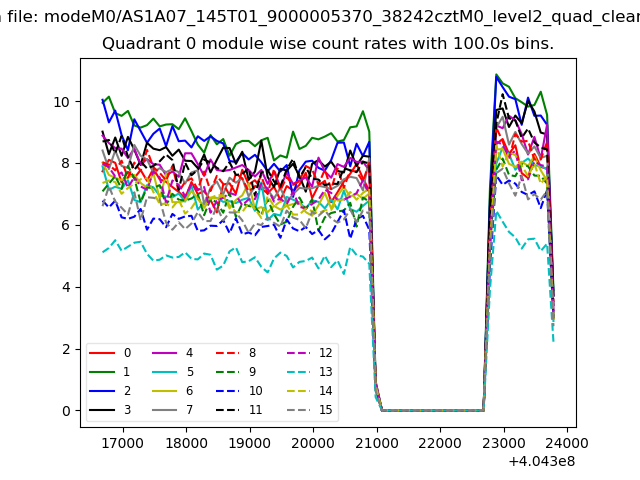 |
 |
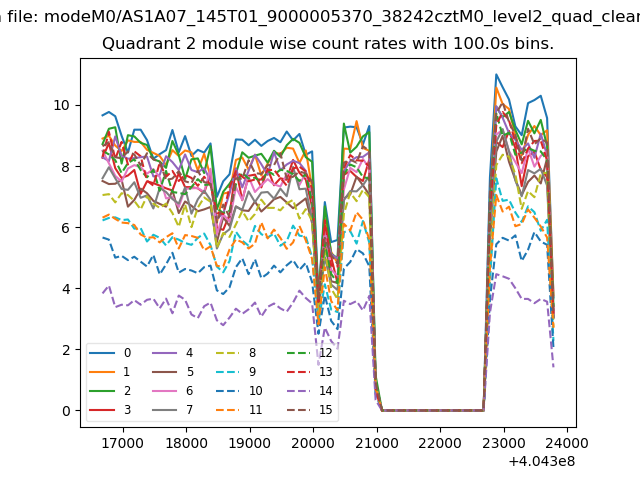
| Module-wise count rates for Quadrant B Data is divided into 100 sec bins |
 |
 |
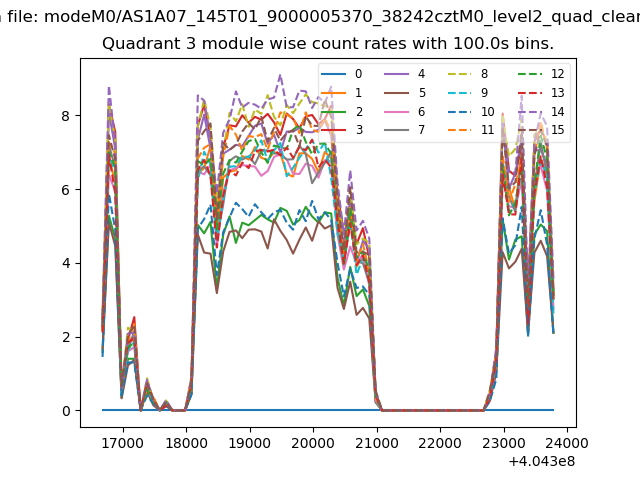
| Module-wise count rates for Quadrant C Data is divided into 100 sec bins |
 |
 |
| Module-wise count rates for Quadrant D Data is divided into 100 sec bins |
 |
 |
| Parameter | Plot |
|---|---|
| CZT HV Monitor |  |
| D_VDD | 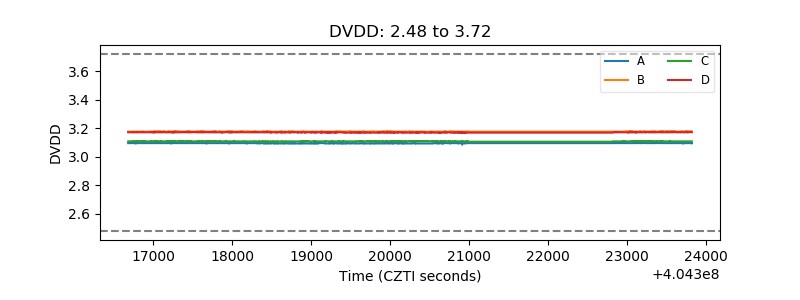 |
| Temperature 1 | 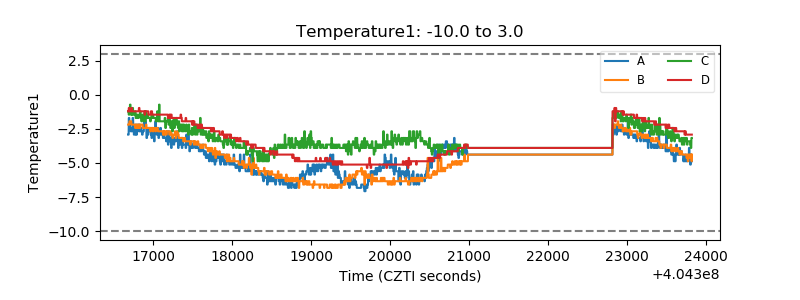 |
| Veto HV Monitor | 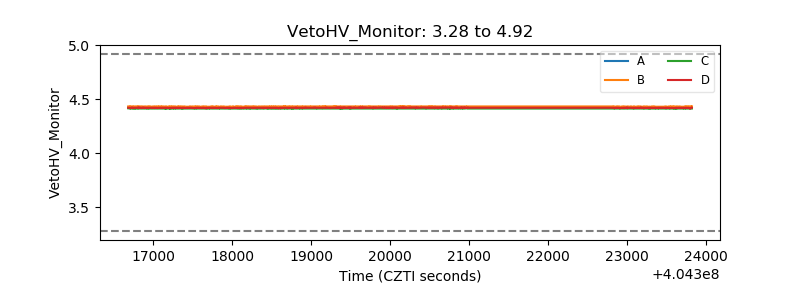 |
| Veto LLD | 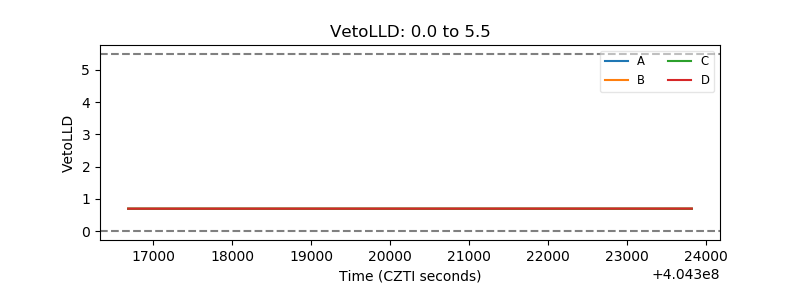 |
| Alpha Counter | 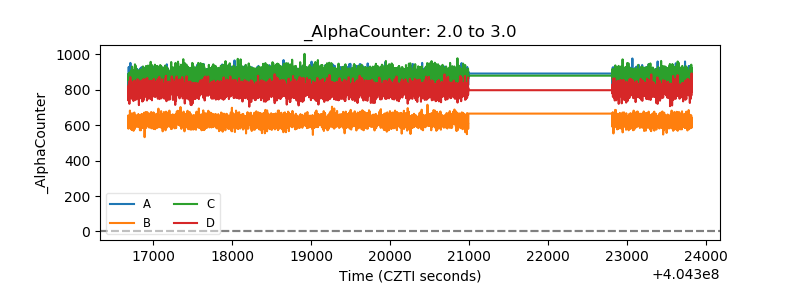 |
| _CPM_Rate | 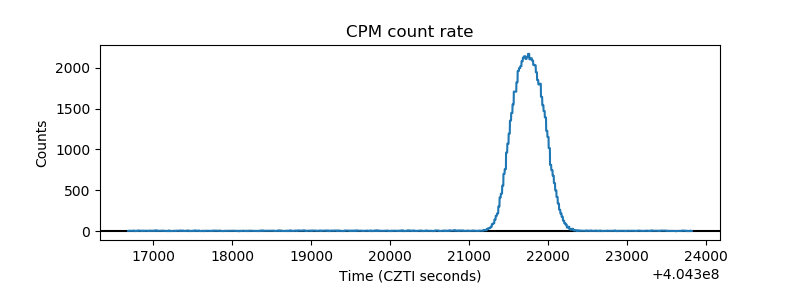 |
| CZT Counter | 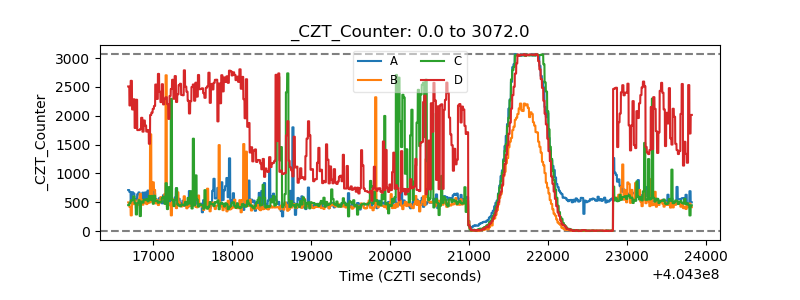 |
| +2.5 Volts monitor | 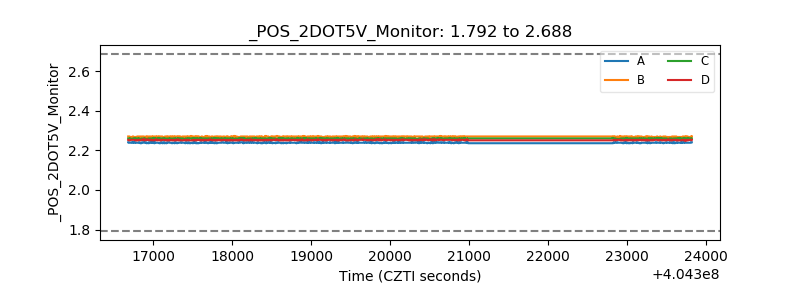 |
| +5 Volts monitor | 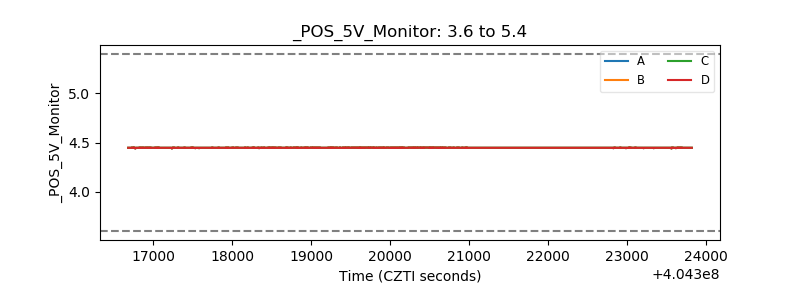 |
| _ROLL_ROT | 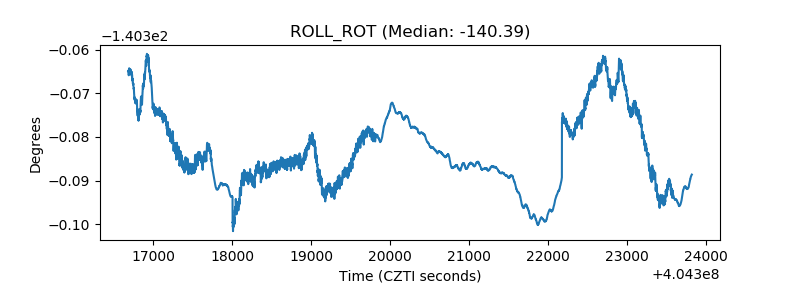 |
| _Roll_DEC | 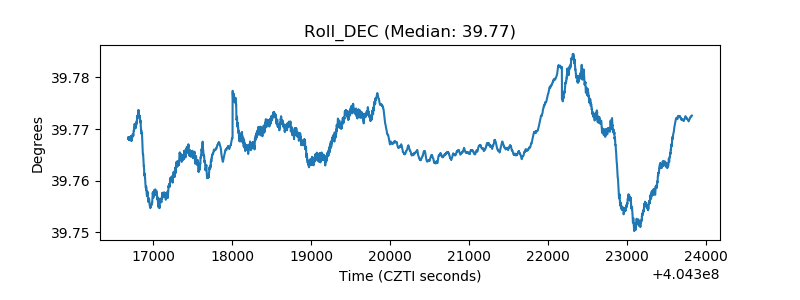 |
| _Roll_RA | 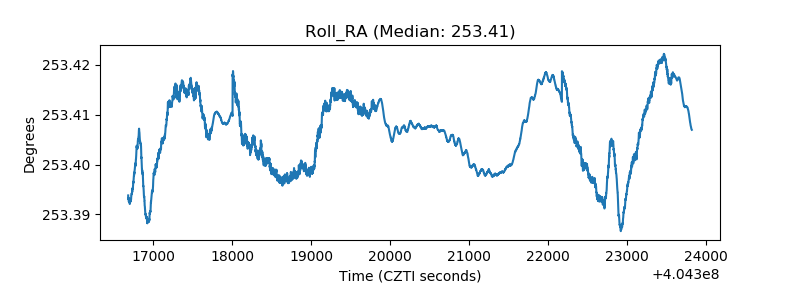 |
| Veto Counter | 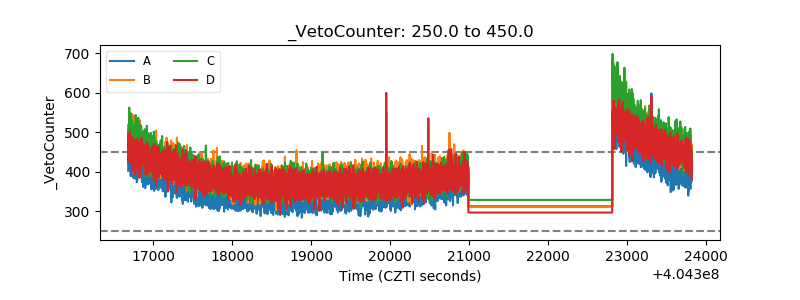 |