| Param | Original file | Final file |
|---|---|---|
| Filename | modeM0/AS1A07_145T01_9000005370_38243cztM0_level2.fits | modeM0/AS1A07_145T01_9000005370_38243cztM0_level2_quad_clean.evt |
| Size (bytes) | 462,185,280 | 87,998,400 |
| Size | 440.8 MB | 83.9 MB |
| Events in quadrant A | 2,794,042 | 625,103 |
| Events in quadrant B | 2,701,009 | 641,823 |
| Events in quadrant C | 3,432,008 | 591,140 |
| Events in quadrant D | 7,788,503 | 450,988 |
| Mode M9 | |||
|---|---|---|---|
| Quadrant | BADHDUFLAG | Total packets | Discarded packets |
| A | 0 | 21 | 0 |
| B | 0 | 21 | 0 |
| C | 0 | 21 | 0 |
| D | 0 | 22 | 0 |
| Mode SS | |||
|---|---|---|---|
| Quadrant | BADHDUFLAG | Total packets | Discarded packets |
| A | 0 | 106 | 0 |
| B | 0 | 106 | 0 |
| C | 0 | 106 | 0 |
| D | 0 | 106 | 0 |
| Mode M0 | |||
|---|---|---|---|
| Quadrant | BADHDUFLAG | Total packets | Discarded packets |
| A | 0 | 11400 | 3 |
| B | 0 | 11262 | 2 |
| C | 0 | 13260 | 2 |
| D | 0 | 26601 | 2 |
| Quadrant | Total seconds | Saturated seconds | Saturation percentage |
|---|---|---|---|
| A | 5062 | 15 | 0.296326% |
| B | 5062 | 69 | 1.363098% |
| C | 5062 | 283 | 5.590676% |
| D | 5062 | 1217 | 24.041881% |
Noise dominated data is calculated using 1-second bins in cleaned event files. If a bin has >2000 counts, and if more than 50% of those come from <1% of pixels, then it is considered to be noise-dominated and hence unusable.
| Quadrant | # 1 sec bins | Bins with >0 counts | Bins with >2000 counts | High rate bins dominated by noise | Noise dominated (total time) | Noise dominated (detector-on time) | Marked lightcurve |
|---|---|---|---|---|---|---|---|
| A | 7004 | 5063 | 7 | 7 | 0.10% | 0.14% | 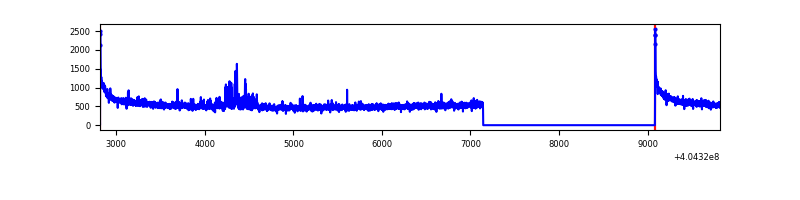 |
| B | 7004 | 5062 | 36 | 36 | 0.51% | 0.71% | 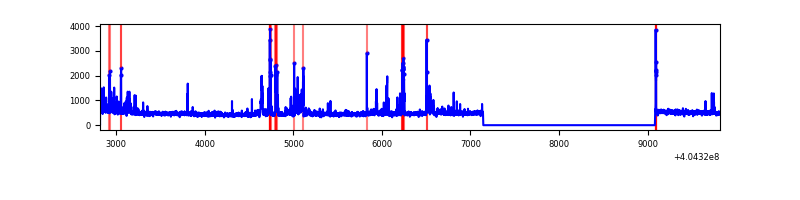 |
| C | 7004 | 5062 | 231 | 231 | 3.30% | 4.56% | 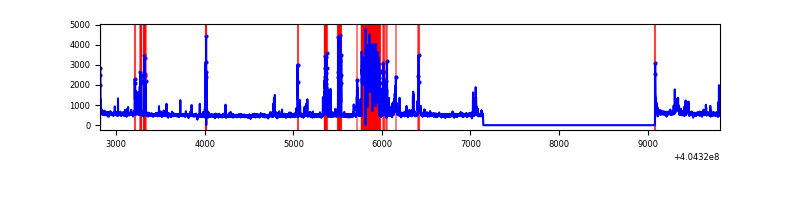 |
| D | 7004 | 5063 | 1305 | 1305 | 18.63% | 25.78% | 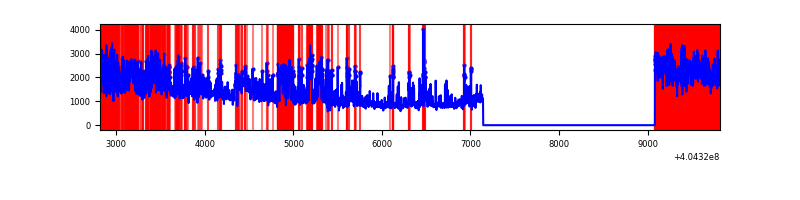 |
Top three noisy pixels from each quadrant. If the there are fewer than three noisy pixels in the level2.evt file, extra rows are filled as -1
| Pixel properties | Quadrant properties | ||||||
|---|---|---|---|---|---|---|---|
| Quadrant | DetID | PixID | Counts | Sigma | Mean | Median | Sigma |
| A | 10 | 83 | 379948 | 3197.71 | 588 | 575 | 118.6 |
| A | 12 | 189 | 103966 | 871.48 | 588 | 575 | 118.6 |
| A | 0 | 247 | 16019 | 130.18 | 588 | 575 | 118.6 |
| B | 5 | 184 | 214759 | 1906.93 | 590 | 575 | 112.3 |
| B | 15 | 85 | 69521 | 613.84 | 590 | 575 | 112.3 |
| B | 5 | 172 | 40133 | 352.19 | 590 | 575 | 112.3 |
| C | 9 | 236 | 744578 | 5617.25 | 568 | 572 | 132.5 |
| C | 15 | 214 | 208246 | 1567.94 | 568 | 572 | 132.5 |
| C | 14 | 254 | 173532 | 1305.85 | 568 | 572 | 132.5 |
| D | 10 | 203 | 3411314 | 26047.72 | 533 | 518 | 130.9 |
| D | 1 | 52 | 1704684 | 13014.45 | 533 | 518 | 130.9 |
| D | 12 | 235 | 296303 | 2258.86 | 533 | 518 | 130.9 |
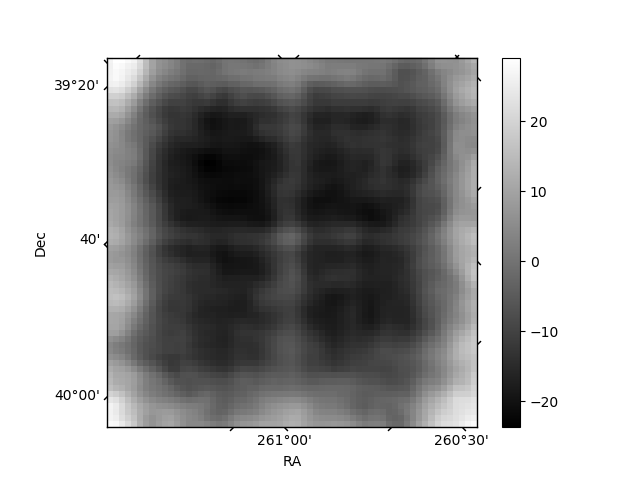
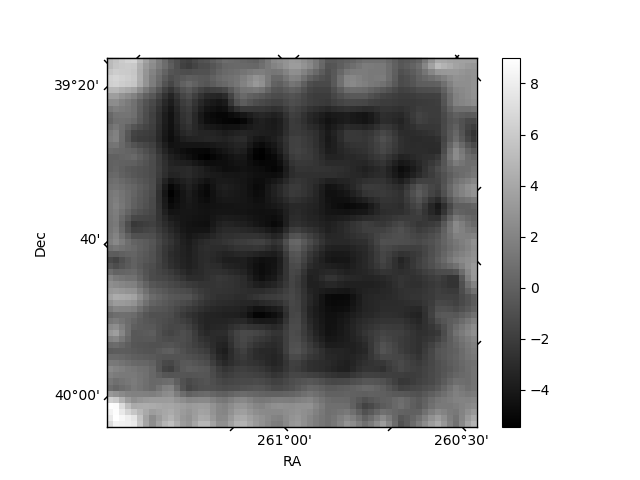
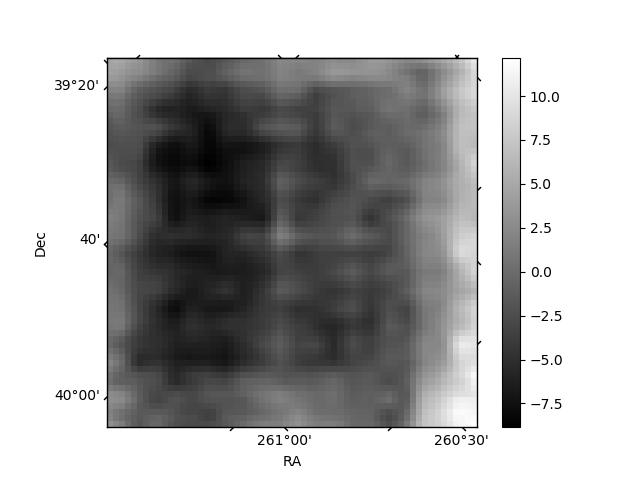
Histogram calculated using DETX and DETY for each event in the final _common_clean file
| Quadrant A | 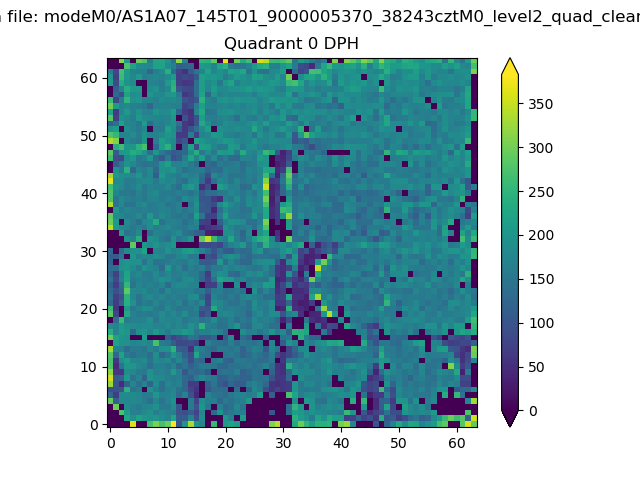 |
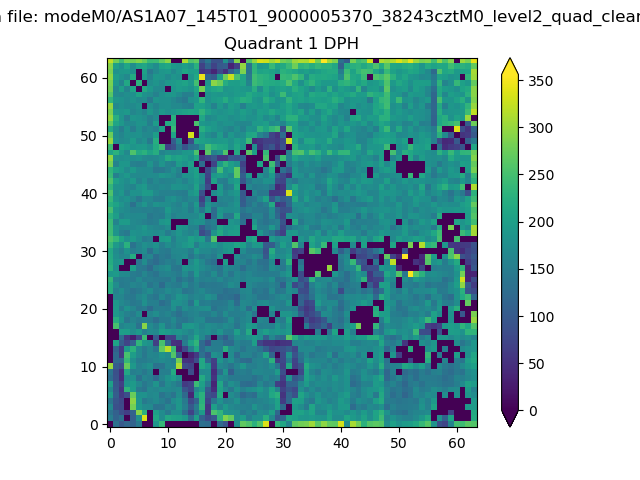 |
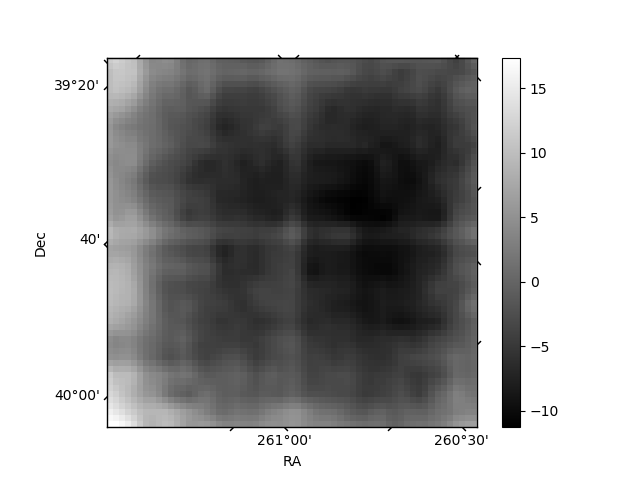
Quadrant B |
|---|---|---|---|
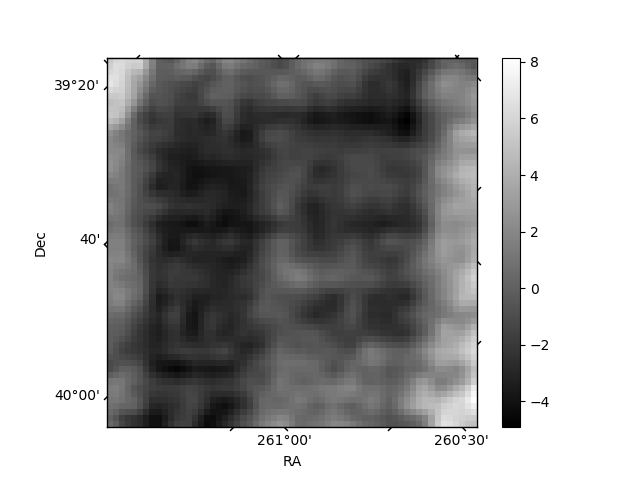
| Quadrant D | 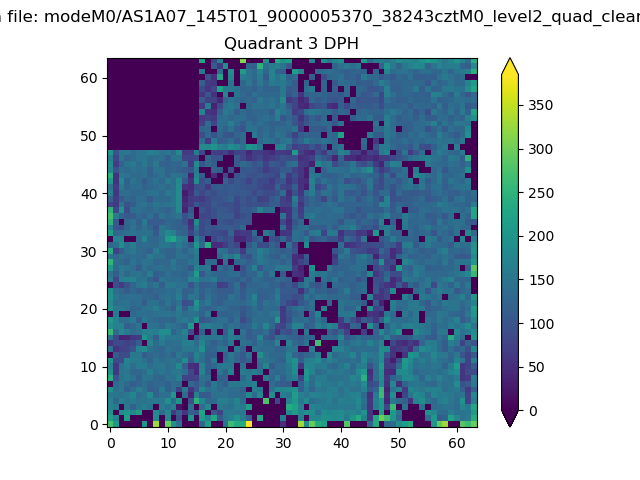 |
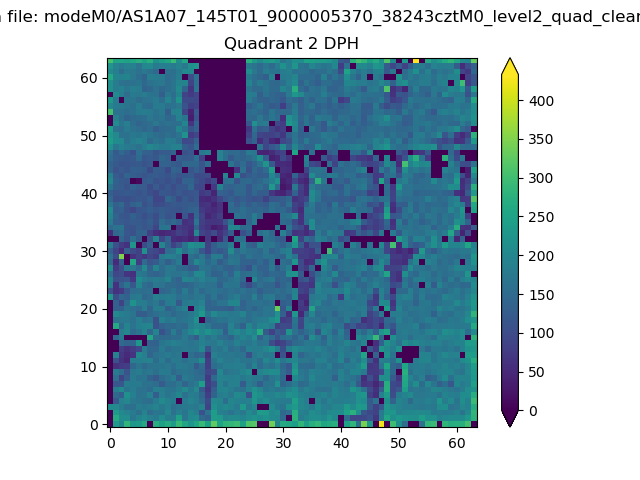 |
Quadrant C |
| Plot type | Count rate plots | Images |
|---|---|---|
| Comparison with Poisson distribution Blue bars denote a histogram of data divided into 1 sec bins. Red curve is a Poisson curve with rate = median count rate of data. |
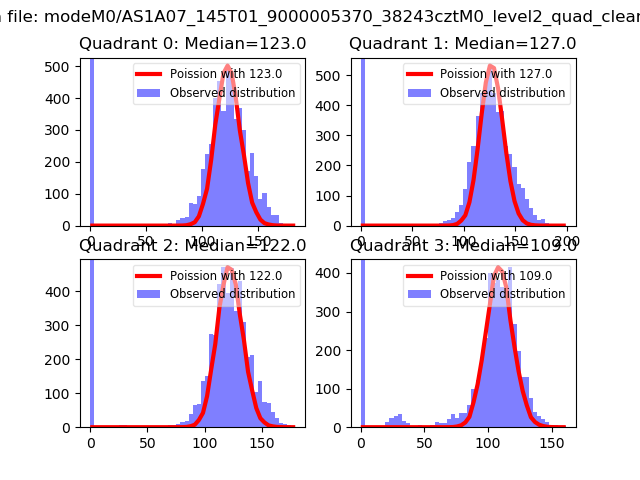 |
 |
| Quadrant-wise count rates Data is divided into 100 sec bins |
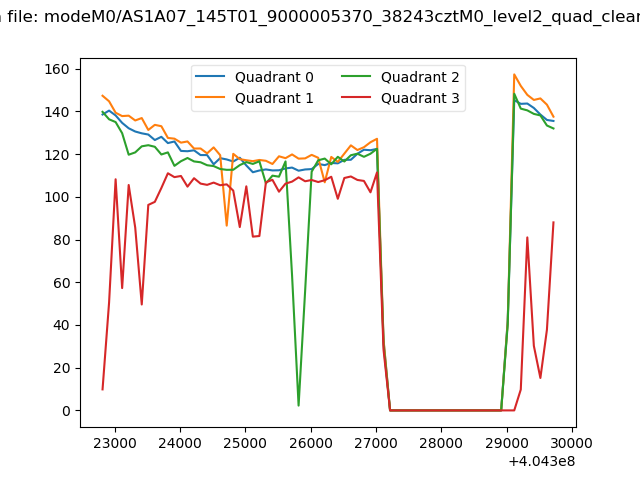 |
|
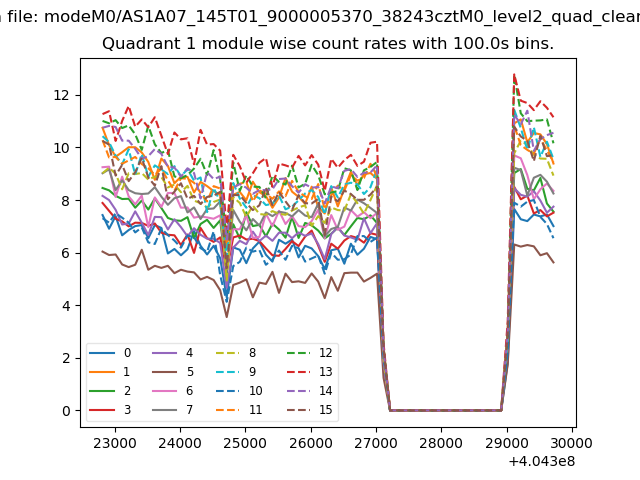
| Module-wise count rates for Quadrant A Data is divided into 100 sec bins |
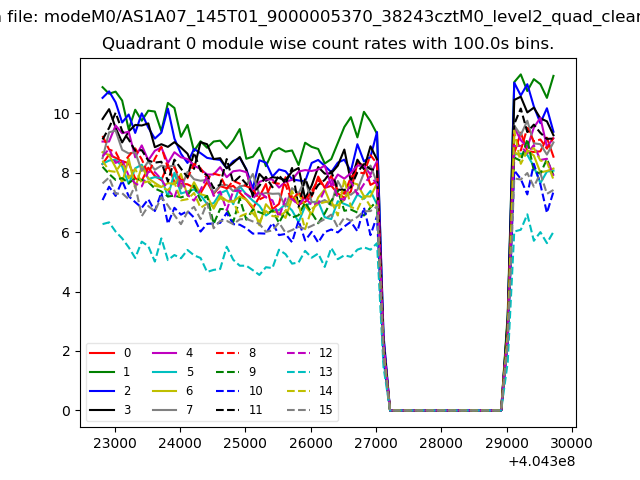 |
 |
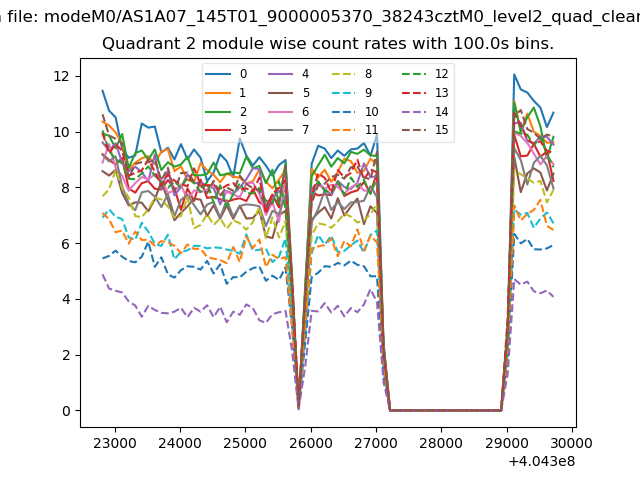
| Module-wise count rates for Quadrant B Data is divided into 100 sec bins |
 |
 |
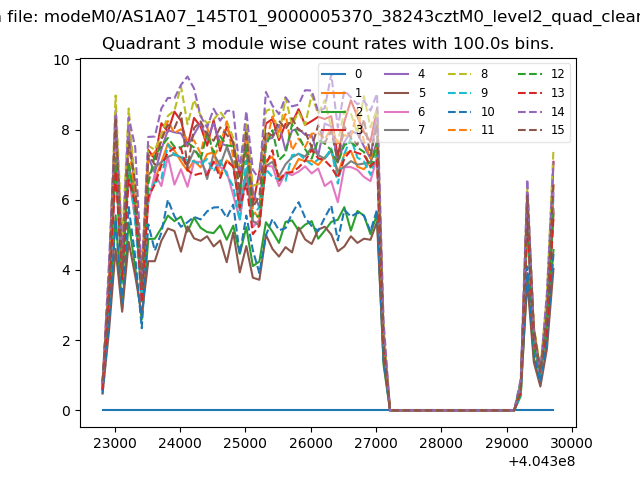
| Module-wise count rates for Quadrant C Data is divided into 100 sec bins |
 |
 |
| Module-wise count rates for Quadrant D Data is divided into 100 sec bins |
 |
 |
| Parameter | Plot |
|---|---|
| CZT HV Monitor | 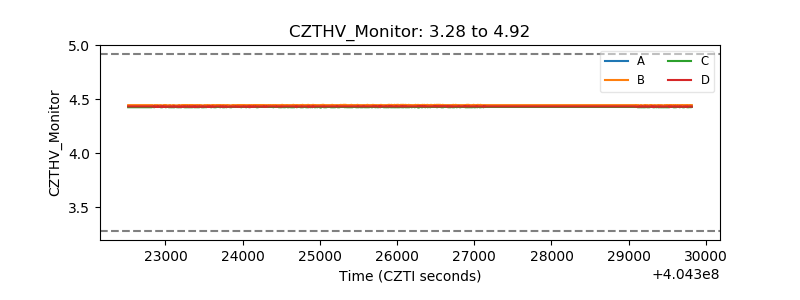 |
| D_VDD | 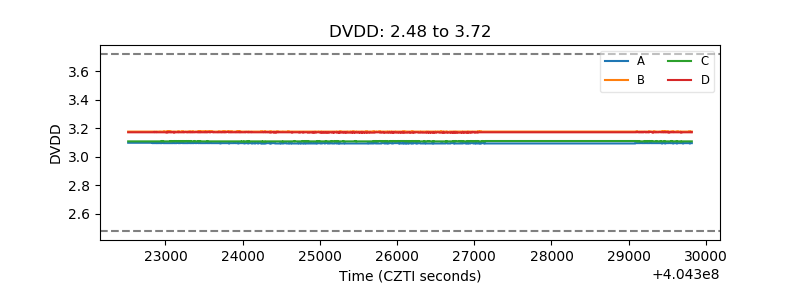 |
| Temperature 1 | 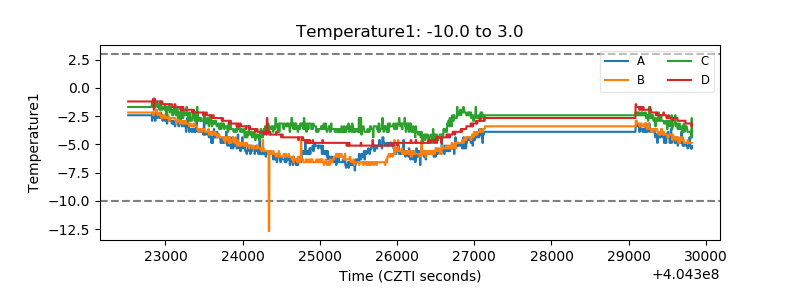 |
| Veto HV Monitor | 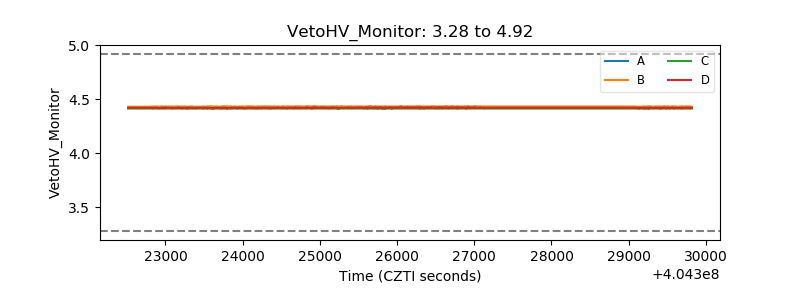 |
| Veto LLD | 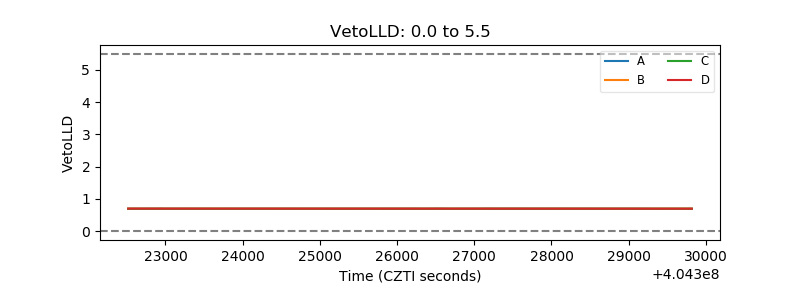 |
| Alpha Counter | 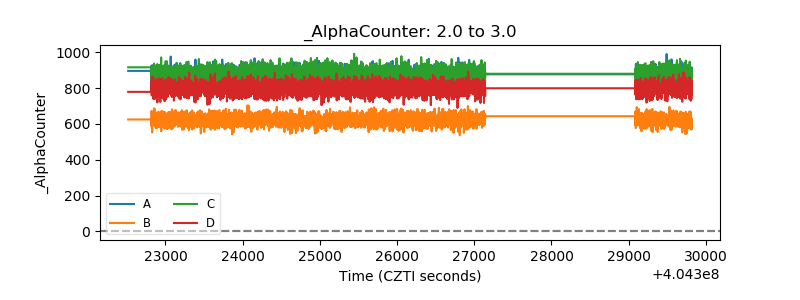 |
| _CPM_Rate | 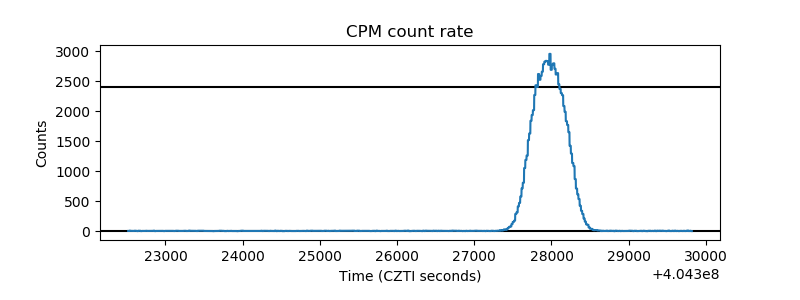 |
| CZT Counter | 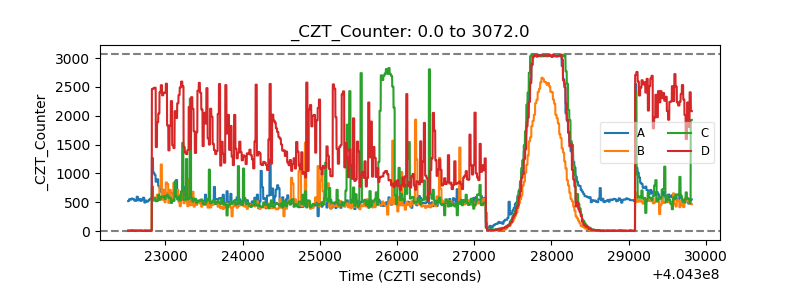 |
| +2.5 Volts monitor | 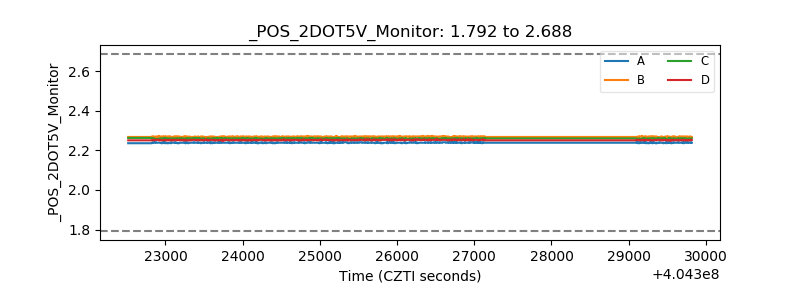 |
| +5 Volts monitor | 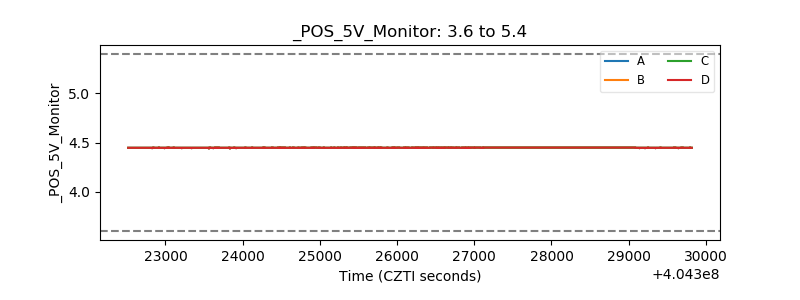 |
| _ROLL_ROT | 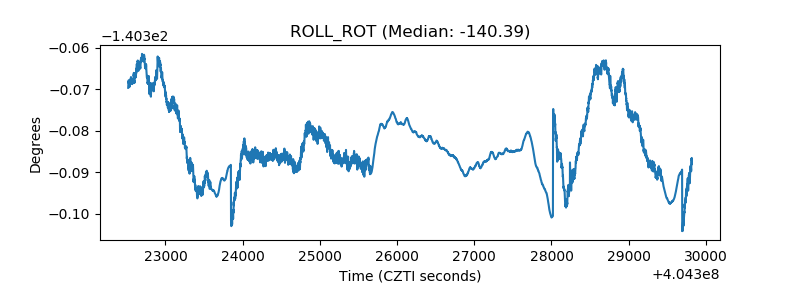 |
| _Roll_DEC | 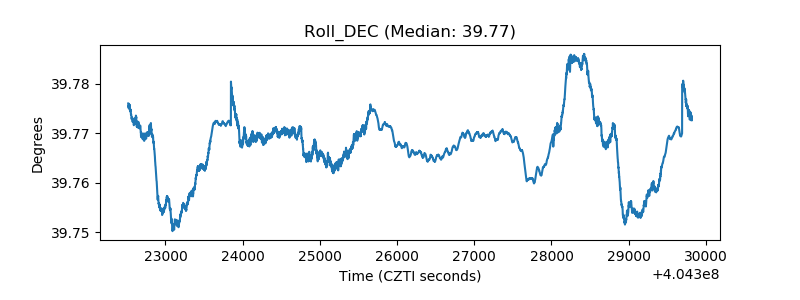 |
| _Roll_RA | 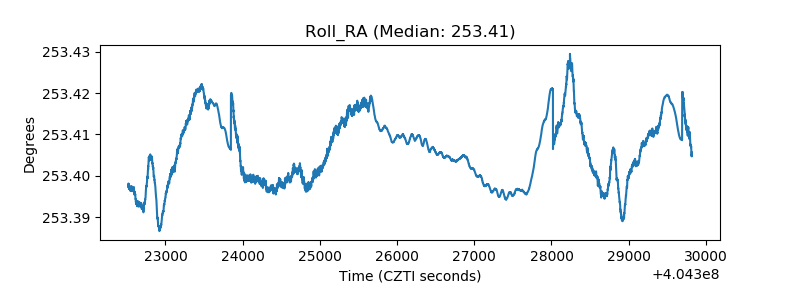 |
| Veto Counter | 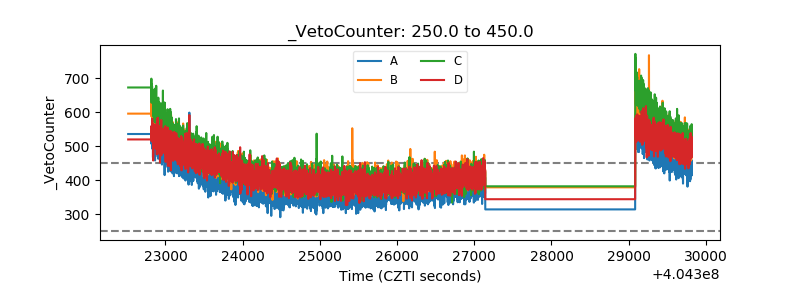 |