| Param | Original file | Final file |
|---|---|---|
| Filename | modeM0/AS1A07_145T01_9000005370_38244cztM0_level2.fits | modeM0/AS1A07_145T01_9000005370_38244cztM0_level2_quad_clean.evt |
| Size (bytes) | 505,869,120 | 82,463,040 |
| Size | 482.4 MB | 78.6 MB |
| Events in quadrant A | 2,662,588 | 627,533 |
| Events in quadrant B | 2,729,926 | 645,006 |
| Events in quadrant C | 2,933,458 | 626,623 |
| Events in quadrant D | 10,016,186 | 252,400 |
| Mode M9 | |||
|---|---|---|---|
| Quadrant | BADHDUFLAG | Total packets | Discarded packets |
| A | 0 | 28 | 0 |
| B | 0 | 28 | 0 |
| C | 0 | 28 | 0 |
| D | 0 | 29 | 0 |
| Mode SS | |||
|---|---|---|---|
| Quadrant | BADHDUFLAG | Total packets | Discarded packets |
| A | 0 | 100 | 0 |
| B | 0 | 100 | 0 |
| C | 0 | 100 | 0 |
| D | 0 | 100 | 0 |
| Mode M0 | |||
|---|---|---|---|
| Quadrant | BADHDUFLAG | Total packets | Discarded packets |
| A | 0 | 10877 | 3 |
| B | 0 | 11122 | 2 |
| C | 0 | 11668 | 2 |
| D | 0 | 33095 | 2 |
| Quadrant | Total seconds | Saturated seconds | Saturation percentage |
|---|---|---|---|
| A | 4928 | 14 | 0.284091% |
| B | 4928 | 119 | 2.414773% |
| C | 4928 | 62 | 1.258117% |
| D | 4928 | 3035 | 61.586851% |
Noise dominated data is calculated using 1-second bins in cleaned event files. If a bin has >2000 counts, and if more than 50% of those come from <1% of pixels, then it is considered to be noise-dominated and hence unusable.
| Quadrant | # 1 sec bins | Bins with >0 counts | Bins with >2000 counts | High rate bins dominated by noise | Noise dominated (total time) | Noise dominated (detector-on time) | Marked lightcurve |
|---|---|---|---|---|---|---|---|
| A | 6990 | 4929 | 8 | 8 | 0.11% | 0.16% | 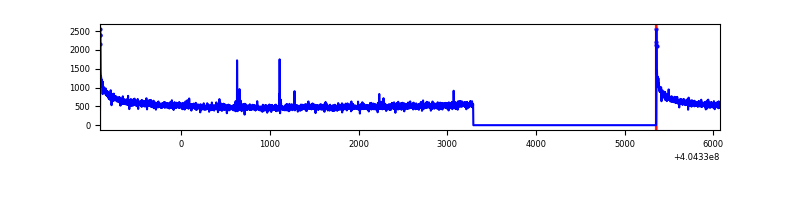 |
| B | 6990 | 4929 | 74 | 74 | 1.06% | 1.50% | 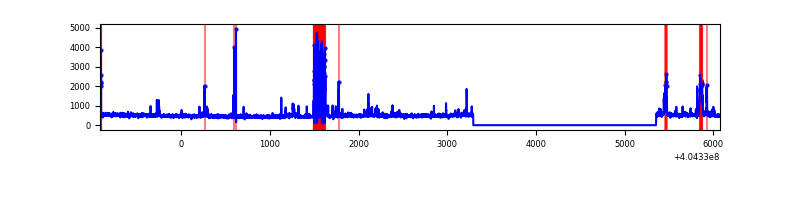 |
| C | 6990 | 4929 | 48 | 48 | 0.69% | 0.97% | 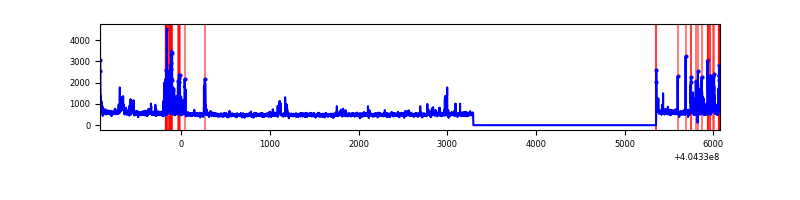 |
| D | 6990 | 4929 | 3100 | 3100 | 44.35% | 62.89% | 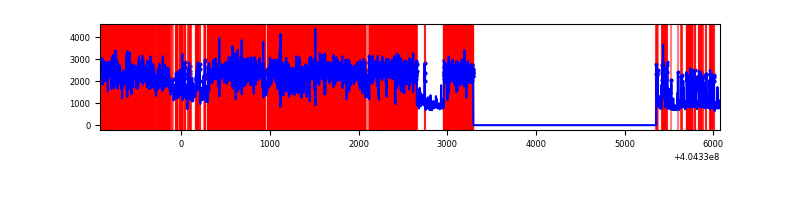 |
Top three noisy pixels from each quadrant. If the there are fewer than three noisy pixels in the level2.evt file, extra rows are filled as -1
| Pixel properties | Quadrant properties | ||||||
|---|---|---|---|---|---|---|---|
| Quadrant | DetID | PixID | Counts | Sigma | Mean | Median | Sigma |
| A | 10 | 83 | 360098 | 3053.63 | 582 | 571 | 117.7 |
| A | 12 | 189 | 13534 | 110.1 | 582 | 571 | 117.7 |
| A | 13 | 6 | 9575 | 76.48 | 582 | 571 | 117.7 |
| B | 5 | 172 | 297257 | 2695.61 | 583 | 571 | 110.1 |
| B | 5 | 184 | 111313 | 1006.17 | 583 | 571 | 110.1 |
| B | 15 | 85 | 14981 | 130.93 | 583 | 571 | 110.1 |
| C | 14 | 254 | 359575 | 2665.47 | 582 | 586 | 134.7 |
| C | 15 | 214 | 209265 | 1549.43 | 582 | 586 | 134.7 |
| C | 2 | 16 | 32197 | 234.71 | 582 | 586 | 134.7 |
| D | 1 | 52 | 4188557 | 38478.33 | 450 | 439 | 108.8 |
| D | 10 | 203 | 3549233 | 32604.54 | 450 | 439 | 108.8 |
| D | 12 | 235 | 224162 | 2055.45 | 450 | 439 | 108.8 |
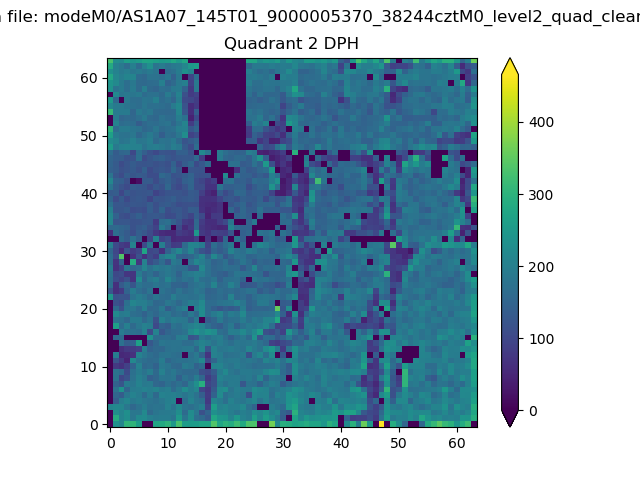
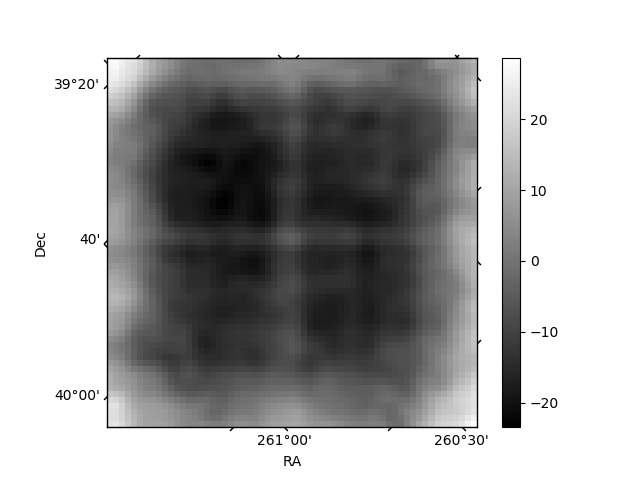
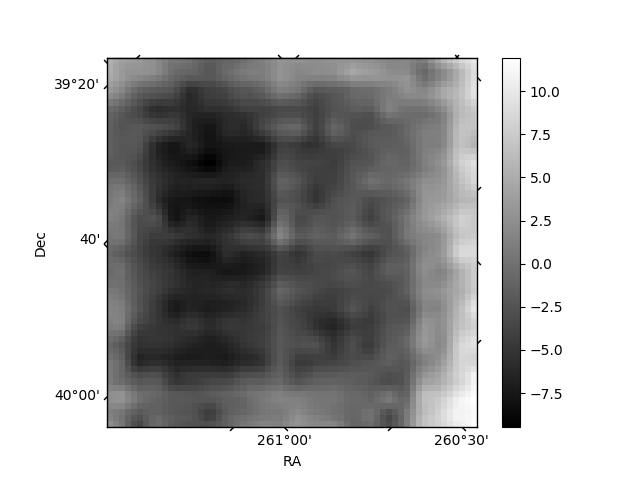
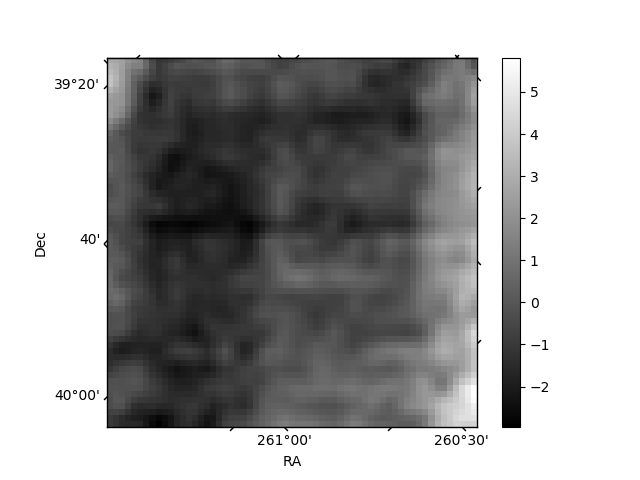
Histogram calculated using DETX and DETY for each event in the final _common_clean file
| Quadrant A | 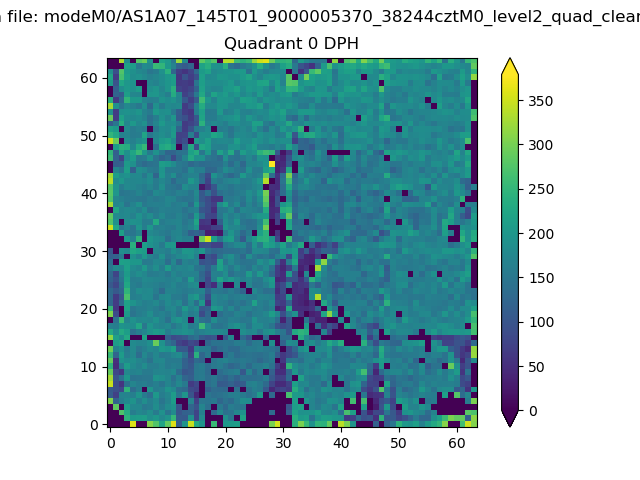 |
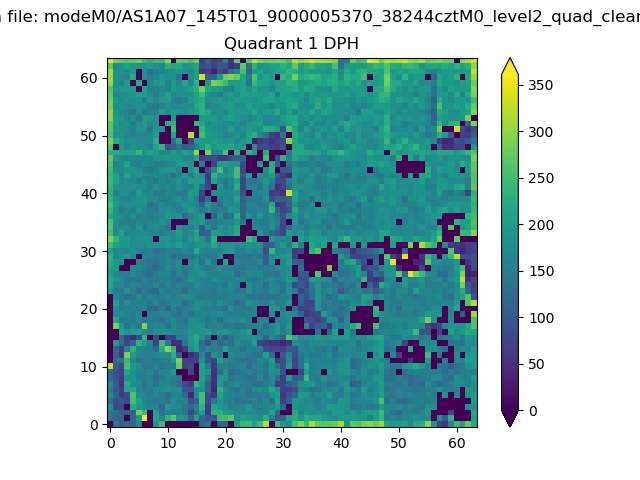 |
Quadrant B |
|---|---|---|---|
| Quadrant D | 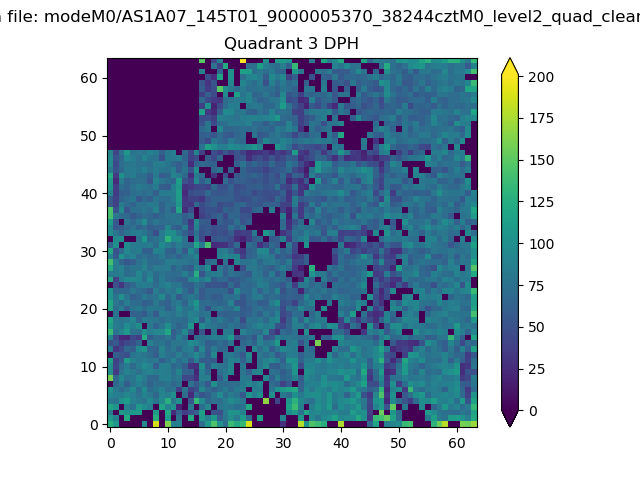 |
 |
Quadrant C |
| Plot type | Count rate plots | Images |
|---|---|---|
| Comparison with Poisson distribution Blue bars denote a histogram of data divided into 1 sec bins. Red curve is a Poisson curve with rate = median count rate of data. |
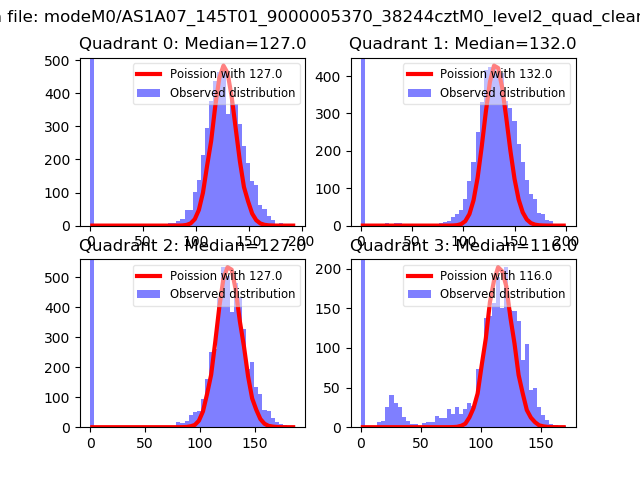 |
 |
| Quadrant-wise count rates Data is divided into 100 sec bins |
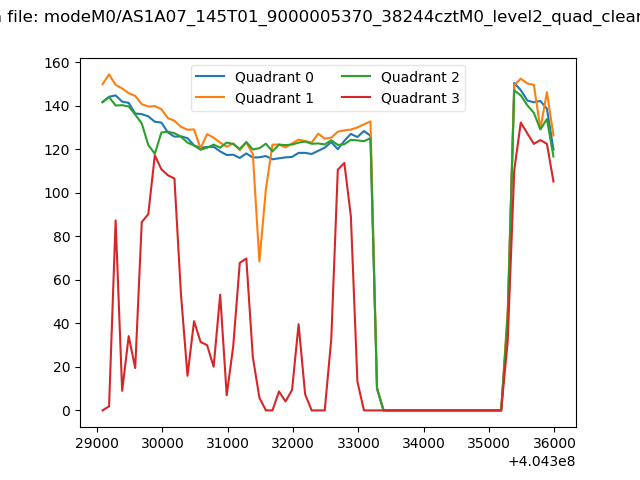 |
|
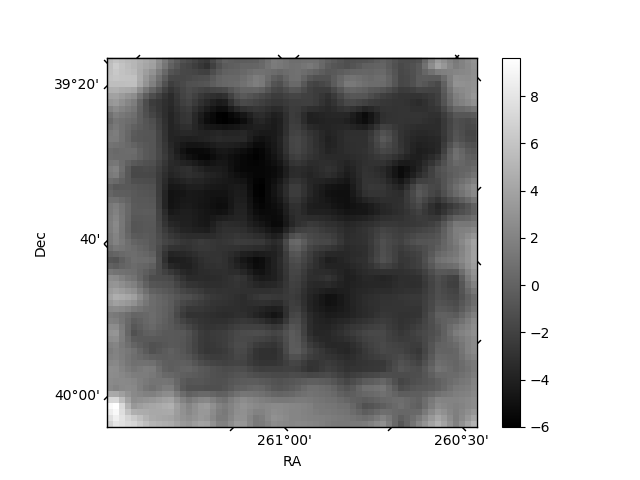
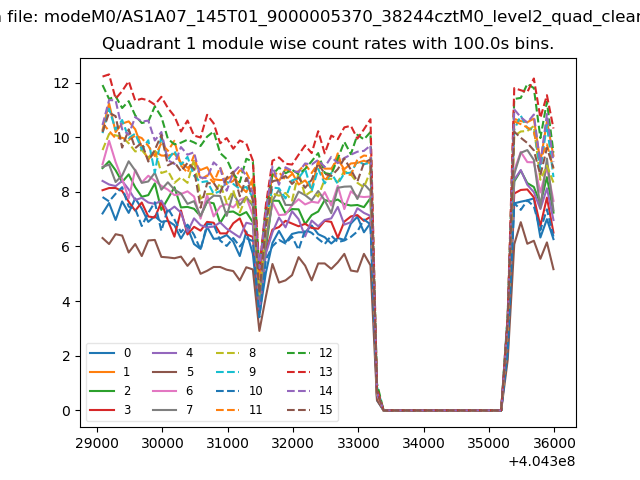
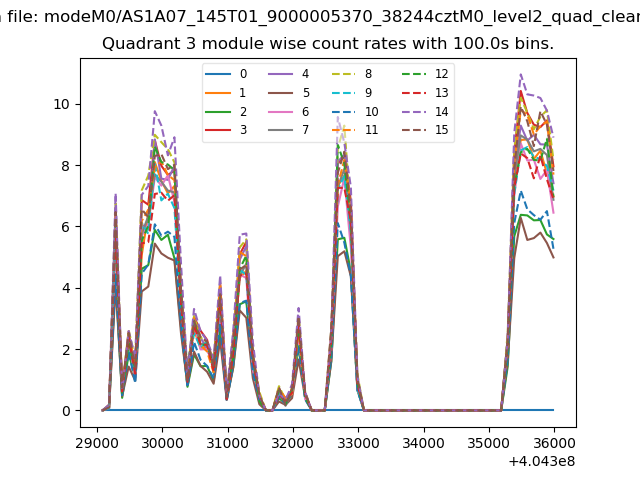
| Module-wise count rates for Quadrant A Data is divided into 100 sec bins |
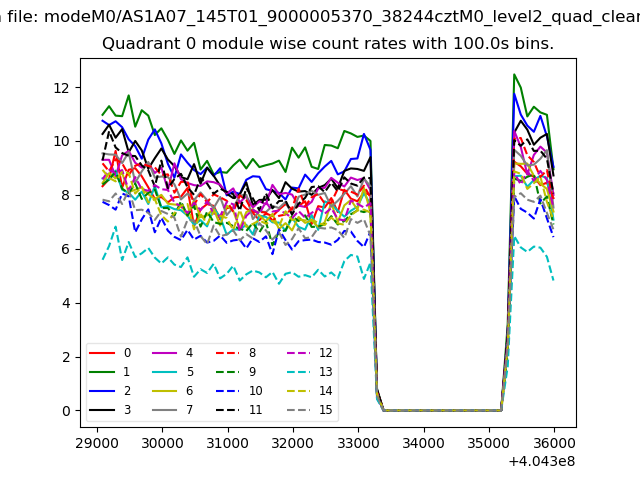 |
 |
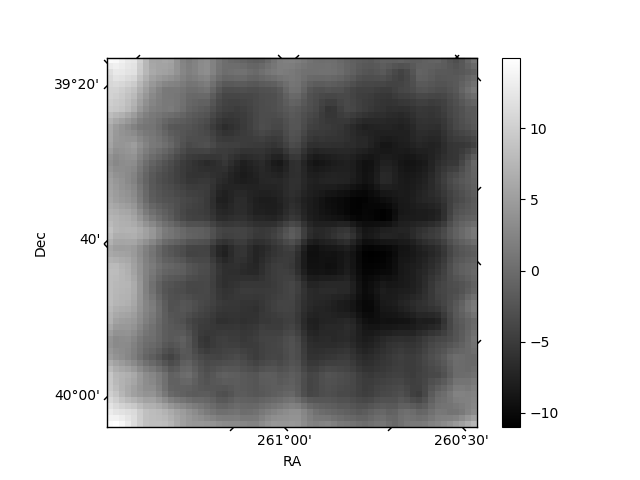
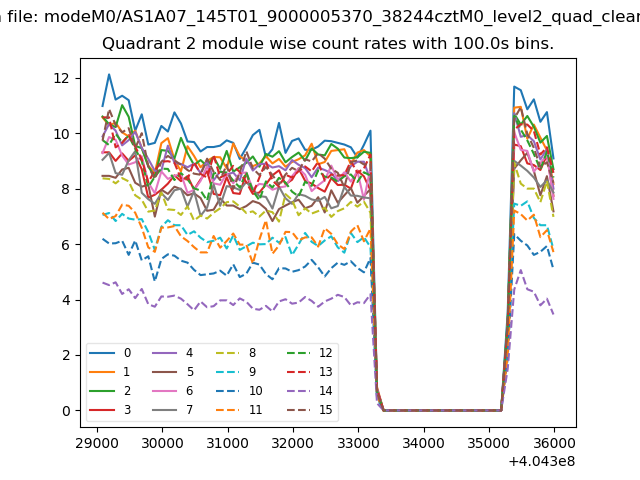
| Module-wise count rates for Quadrant B Data is divided into 100 sec bins |
 |
 |
| Module-wise count rates for Quadrant C Data is divided into 100 sec bins |
 |
 |
| Module-wise count rates for Quadrant D Data is divided into 100 sec bins |
 |
 |
| Parameter | Plot |
|---|---|
| CZT HV Monitor | 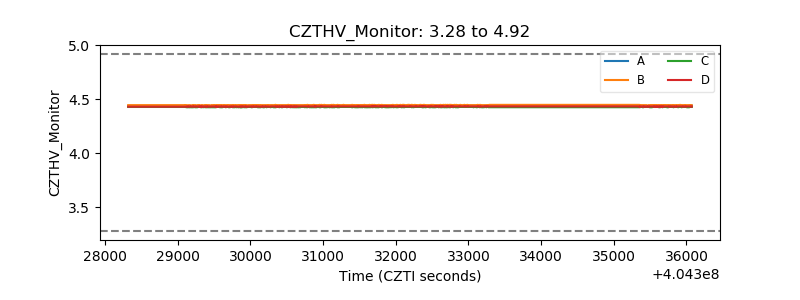 |
| D_VDD | 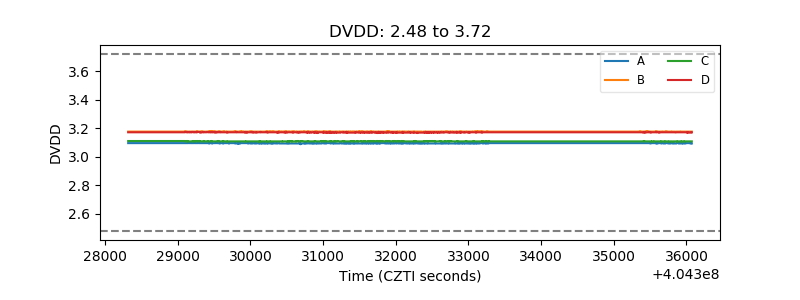 |
| Temperature 1 | 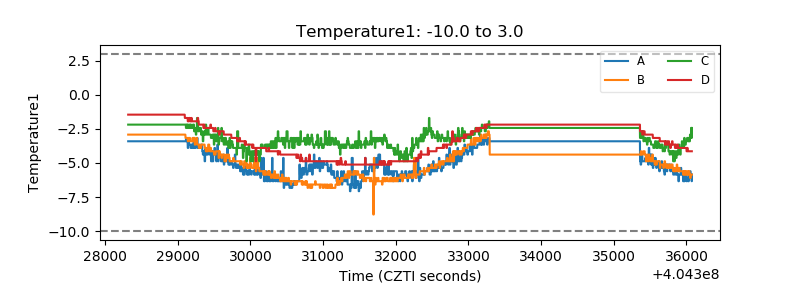 |
| Veto HV Monitor | 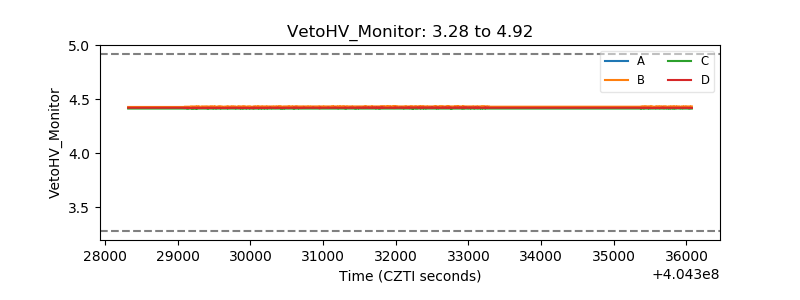 |
| Veto LLD | 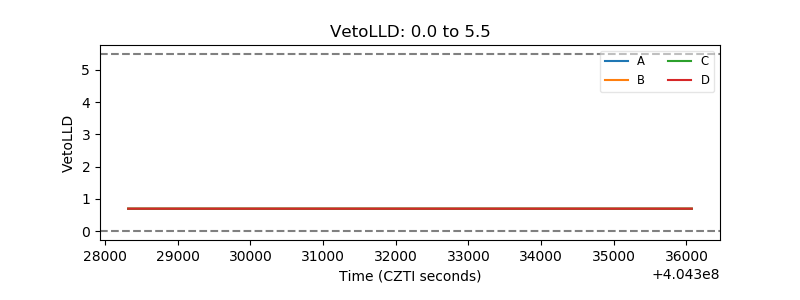 |
| Alpha Counter | 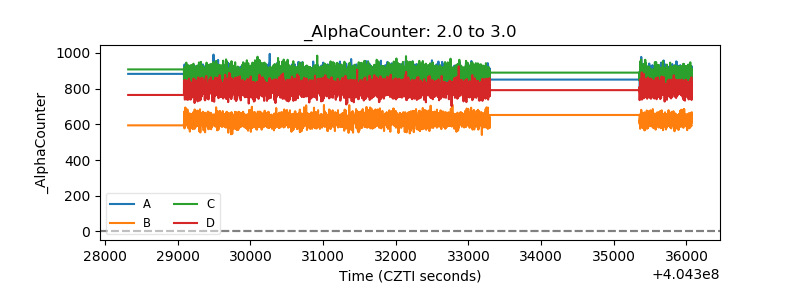 |
| _CPM_Rate | 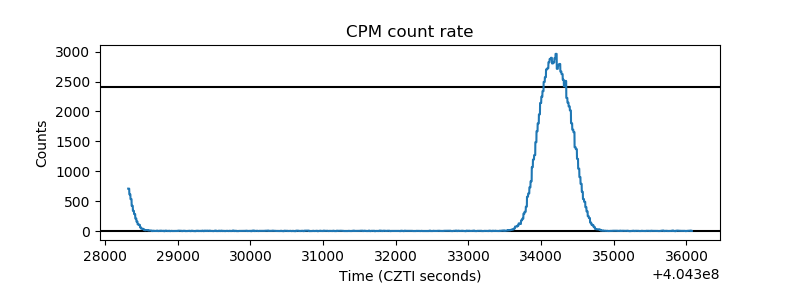 |
| CZT Counter | 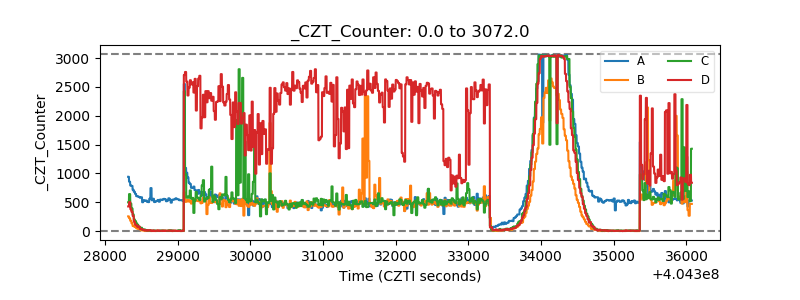 |
| +2.5 Volts monitor | 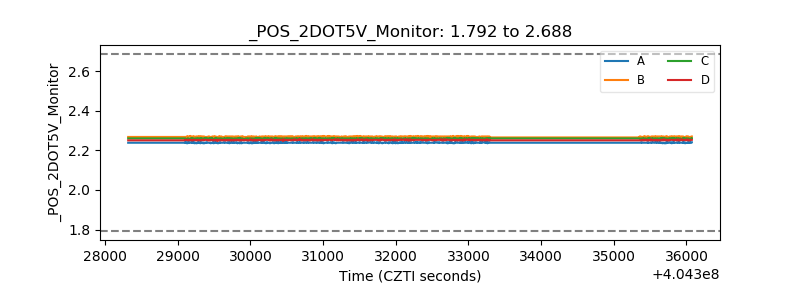 |
| +5 Volts monitor | 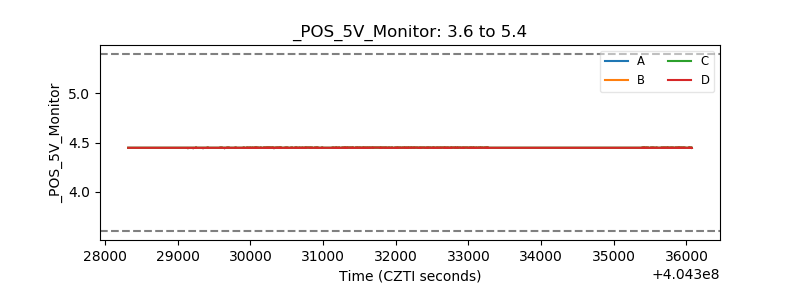 |
| _ROLL_ROT | 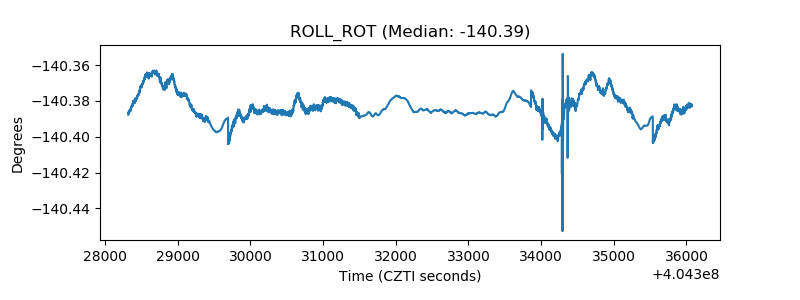 |
| _Roll_DEC | 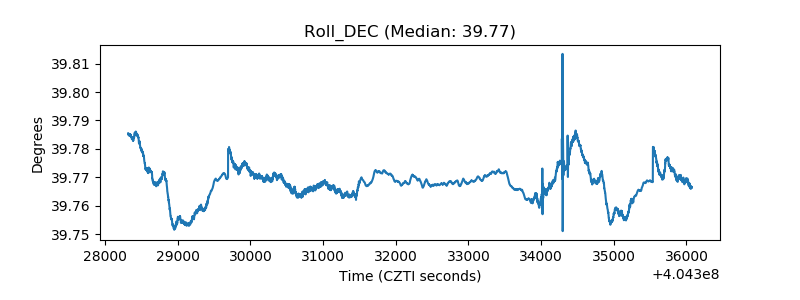 |
| _Roll_RA | 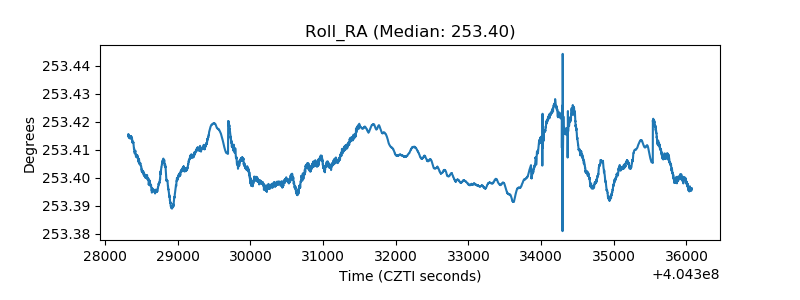 |
| Veto Counter | 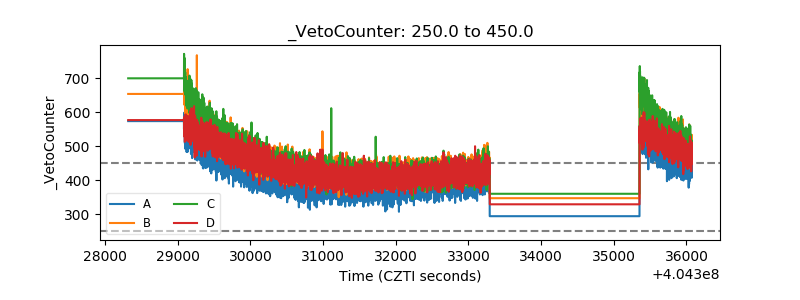 |