| Param | Original file | Final file |
|---|---|---|
| Filename | modeM0/AS1A07_145T01_9000005370_38245cztM0_level2.fits | modeM0/AS1A07_145T01_9000005370_38245cztM0_level2_quad_clean.evt |
| Size (bytes) | 394,764,480 | 95,624,640 |
| Size | 376.5 MB | 91.2 MB |
| Events in quadrant A | 2,744,740 | 649,714 |
| Events in quadrant B | 2,558,053 | 676,144 |
| Events in quadrant C | 3,321,201 | 638,173 |
| Events in quadrant D | 5,591,533 | 573,870 |
| Mode M9 | |||
|---|---|---|---|
| Quadrant | BADHDUFLAG | Total packets | Discarded packets |
| A | 0 | 26 | 0 |
| B | 0 | 26 | 0 |
| C | 0 | 26 | 0 |
| D | 0 | 27 | 0 |
| Mode SS | |||
|---|---|---|---|
| Quadrant | BADHDUFLAG | Total packets | Discarded packets |
| A | 0 | 102 | 0 |
| B | 0 | 102 | 0 |
| C | 0 | 102 | 0 |
| D | 0 | 102 | 0 |
| Mode M0 | |||
|---|---|---|---|
| Quadrant | BADHDUFLAG | Total packets | Discarded packets |
| A | 0 | 11180 | 3 |
| B | 0 | 10748 | 2 |
| C | 0 | 12916 | 2 |
| D | 0 | 20310 | 2 |
| Quadrant | Total seconds | Saturated seconds | Saturation percentage |
|---|---|---|---|
| A | 5114 | 9 | 0.175987% |
| B | 5114 | 37 | 0.723504% |
| C | 5114 | 136 | 2.659366% |
| D | 5114 | 345 | 6.746187% |
Noise dominated data is calculated using 1-second bins in cleaned event files. If a bin has >2000 counts, and if more than 50% of those come from <1% of pixels, then it is considered to be noise-dominated and hence unusable.
| Quadrant | # 1 sec bins | Bins with >0 counts | Bins with >2000 counts | High rate bins dominated by noise | Noise dominated (total time) | Noise dominated (detector-on time) | Marked lightcurve |
|---|---|---|---|---|---|---|---|
| A | 7237 | 5115 | 7 | 7 | 0.10% | 0.14% | 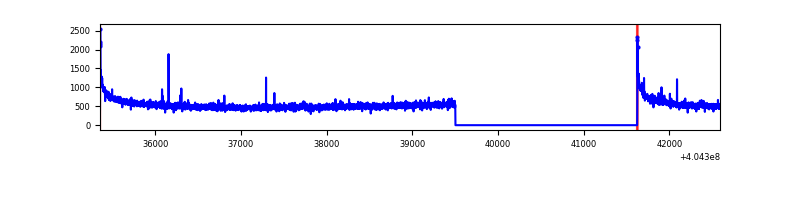 |
| B | 7237 | 5115 | 22 | 22 | 0.30% | 0.43% | 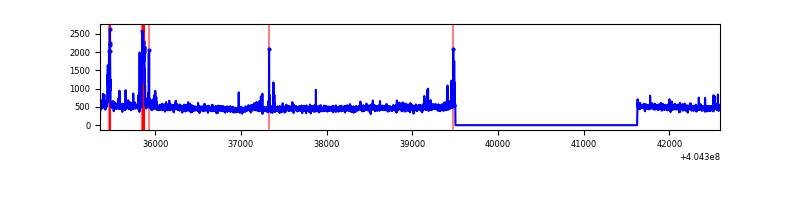 |
| C | 7237 | 5115 | 124 | 124 | 1.71% | 2.42% | 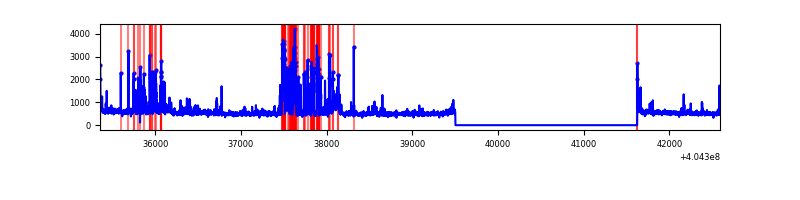 |
| D | 7237 | 5115 | 435 | 435 | 6.01% | 8.50% | 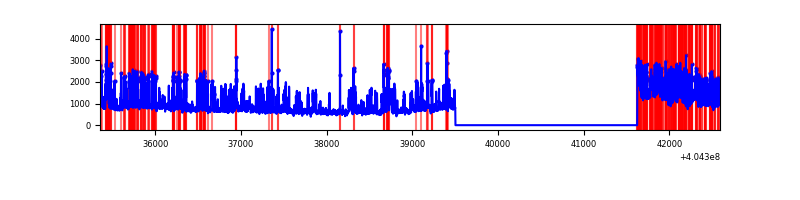 |
Top three noisy pixels from each quadrant. If the there are fewer than three noisy pixels in the level2.evt file, extra rows are filled as -1
| Pixel properties | Quadrant properties | ||||||
|---|---|---|---|---|---|---|---|
| Quadrant | DetID | PixID | Counts | Sigma | Mean | Median | Sigma |
| A | 10 | 83 | 363795 | 3002.09 | 603 | 592 | 121.0 |
| A | 12 | 189 | 17747 | 141.8 | 603 | 592 | 121.0 |
| A | 13 | 6 | 8760 | 67.51 | 603 | 592 | 121.0 |
| B | 5 | 184 | 96399 | 834.43 | 608 | 592 | 114.8 |
| B | 5 | 172 | 63009 | 543.62 | 608 | 592 | 114.8 |
| B | 12 | 111 | 14017 | 116.92 | 608 | 592 | 114.8 |
| C | 14 | 254 | 718257 | 5131.1 | 597 | 602 | 139.9 |
| C | 15 | 214 | 215414 | 1535.87 | 597 | 602 | 139.9 |
| C | 9 | 236 | 23906 | 166.62 | 597 | 602 | 139.9 |
| D | 10 | 203 | 2293650 | 16277.06 | 585 | 571 | 140.9 |
| D | 12 | 235 | 609839 | 4324.79 | 585 | 571 | 140.9 |
| D | 1 | 52 | 120337 | 850.14 | 585 | 571 | 140.9 |
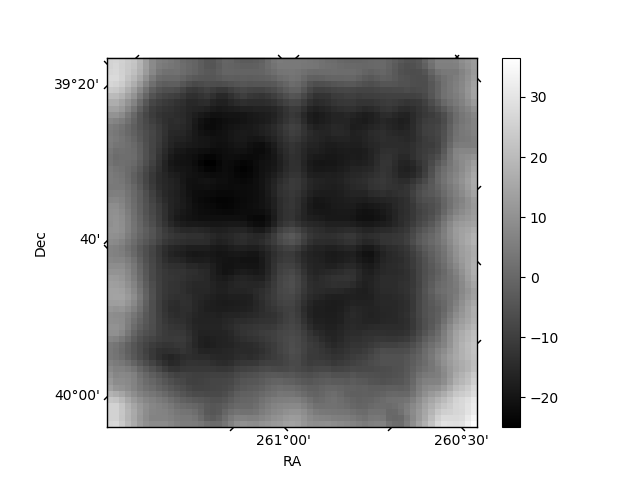
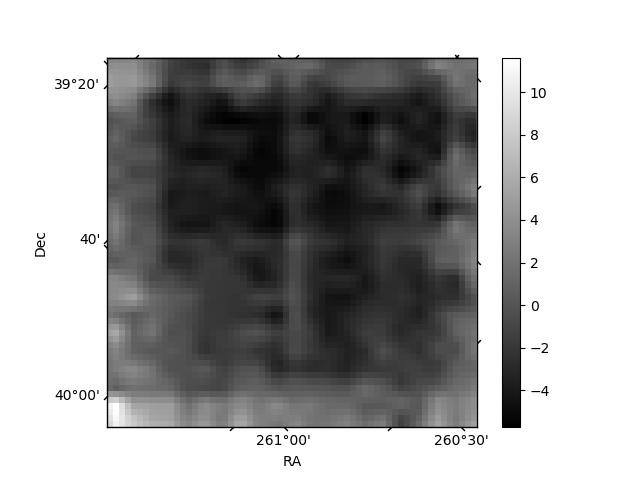
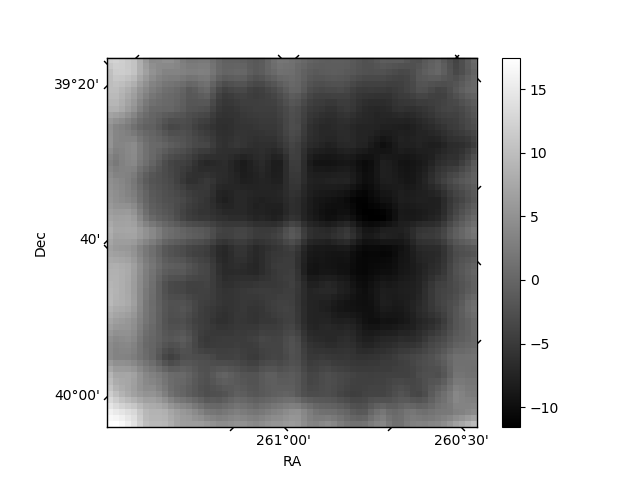
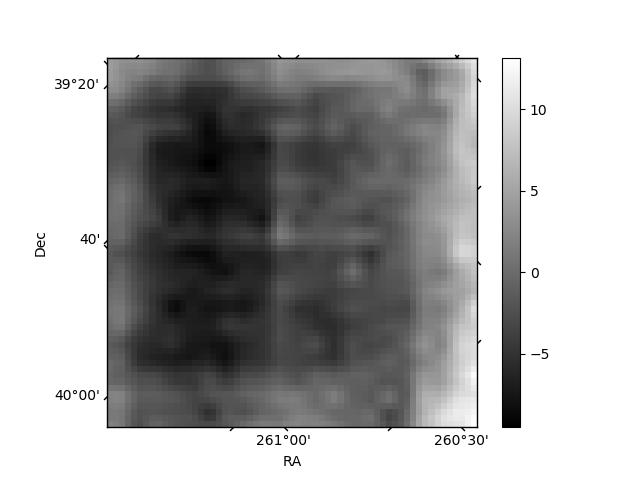
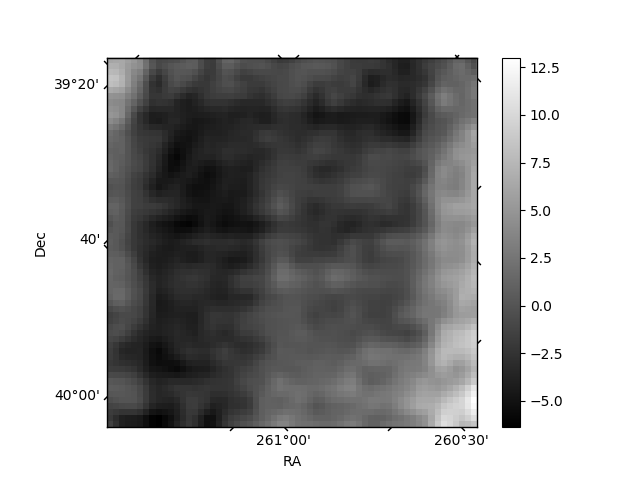
Histogram calculated using DETX and DETY for each event in the final _common_clean file
| Quadrant A | 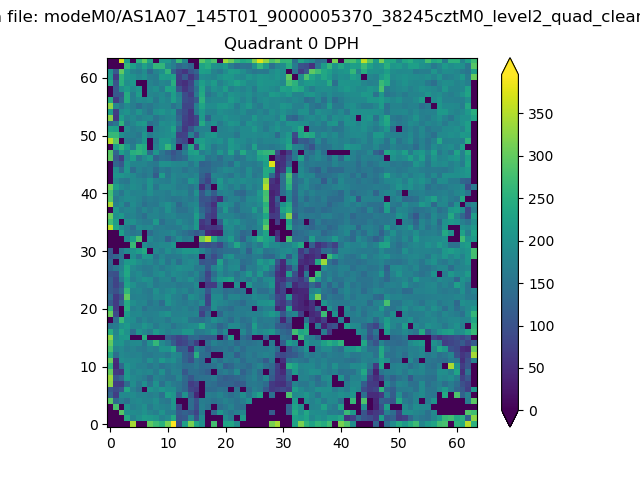 |
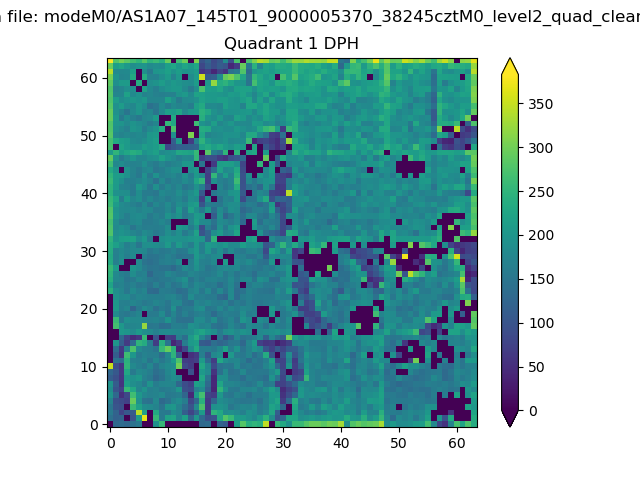 |
Quadrant B |
|---|---|---|---|
| Quadrant D | 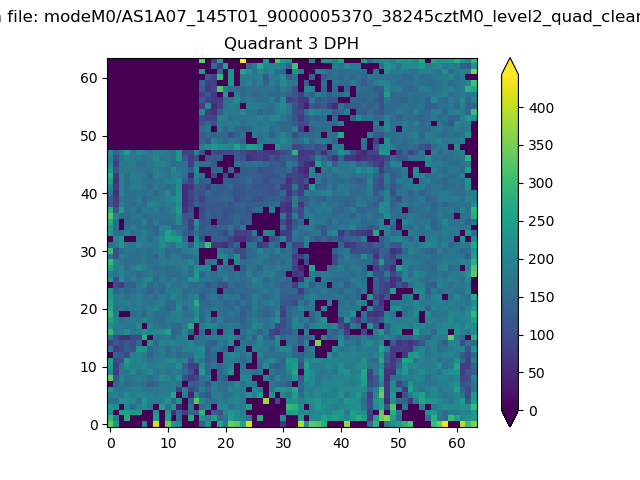 |
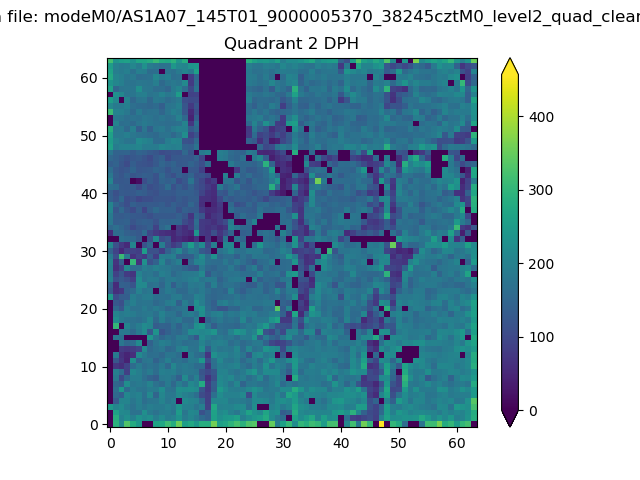 |
Quadrant C |
| Plot type | Count rate plots | Images |
|---|---|---|
| Comparison with Poisson distribution Blue bars denote a histogram of data divided into 1 sec bins. Red curve is a Poisson curve with rate = median count rate of data. |
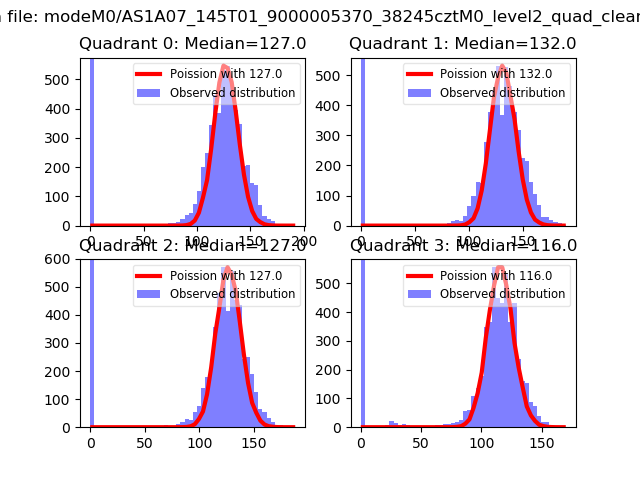 |
 |
| Quadrant-wise count rates Data is divided into 100 sec bins |
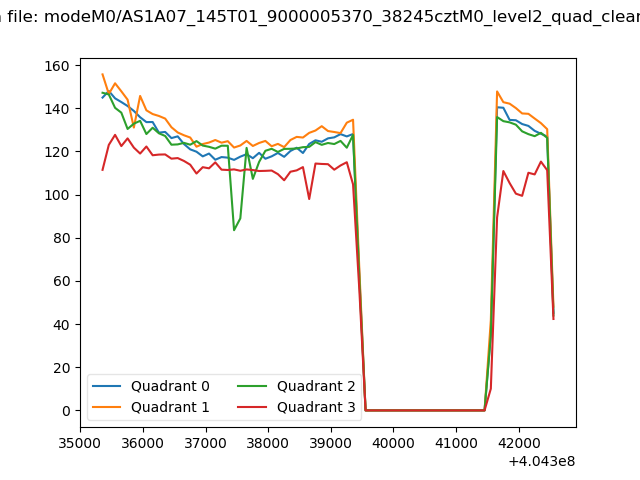 |
|
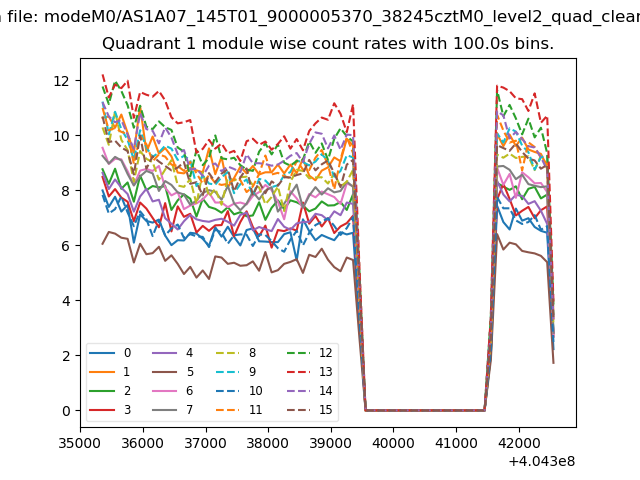
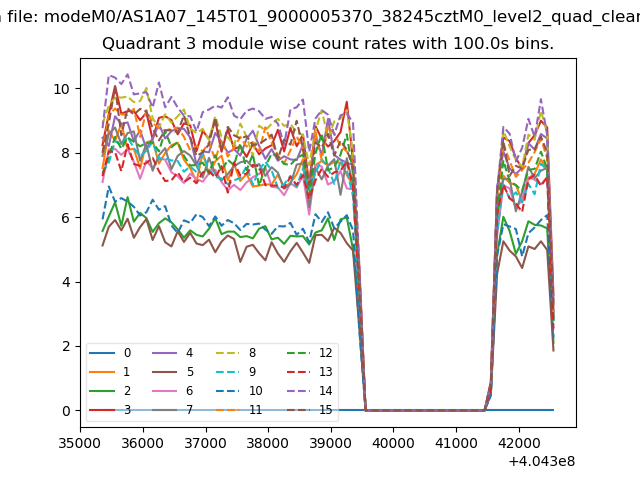
| Module-wise count rates for Quadrant A Data is divided into 100 sec bins |
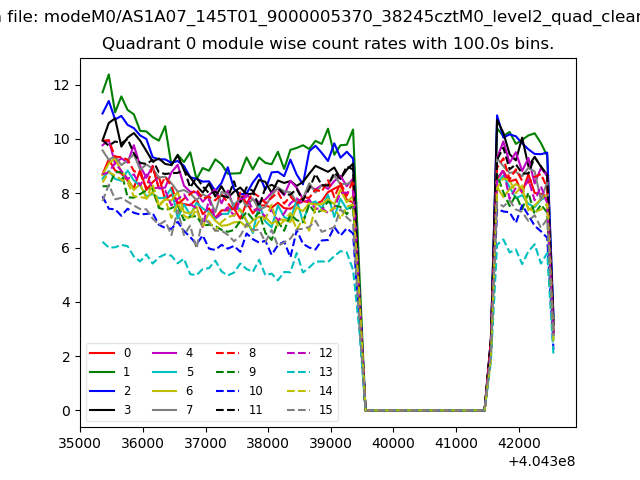 |
 |
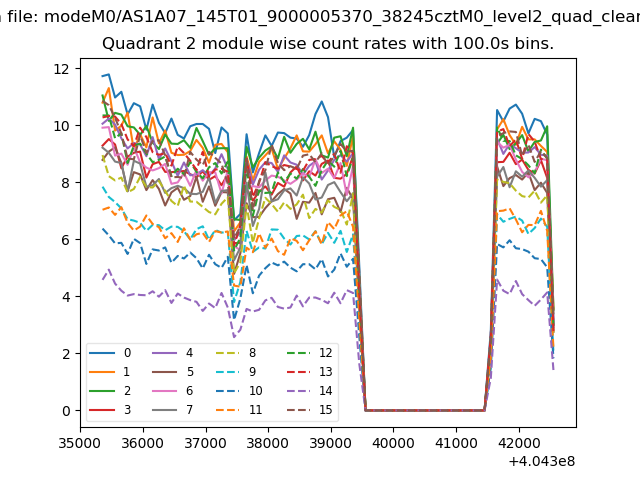
| Module-wise count rates for Quadrant B Data is divided into 100 sec bins |
 |
 |
| Module-wise count rates for Quadrant C Data is divided into 100 sec bins |
 |
 |
| Module-wise count rates for Quadrant D Data is divided into 100 sec bins |
 |
 |
| Parameter | Plot |
|---|---|
| CZT HV Monitor | 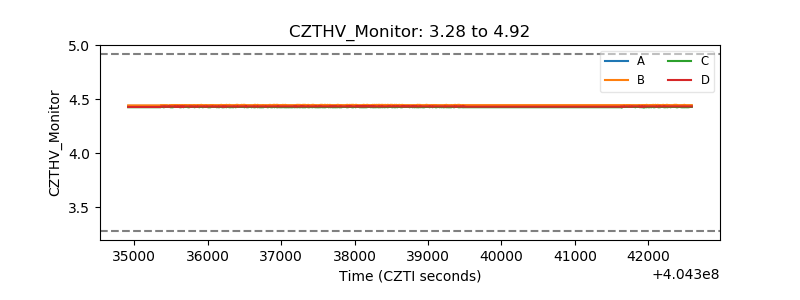 |
| D_VDD | 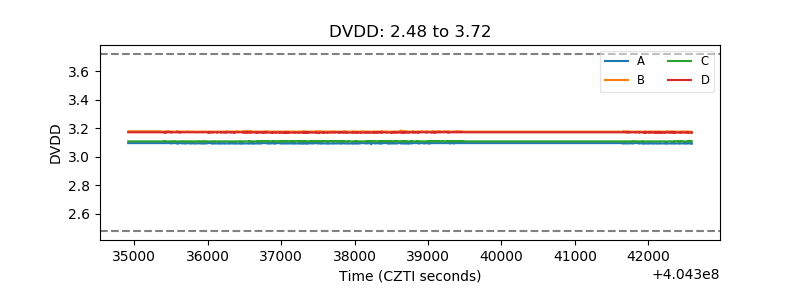 |
| Temperature 1 | 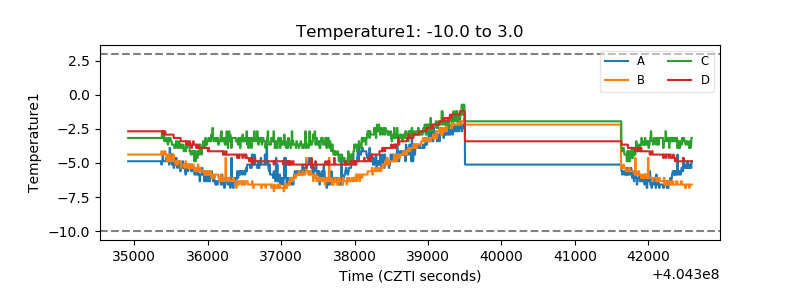 |
| Veto HV Monitor |  |
| Veto LLD | 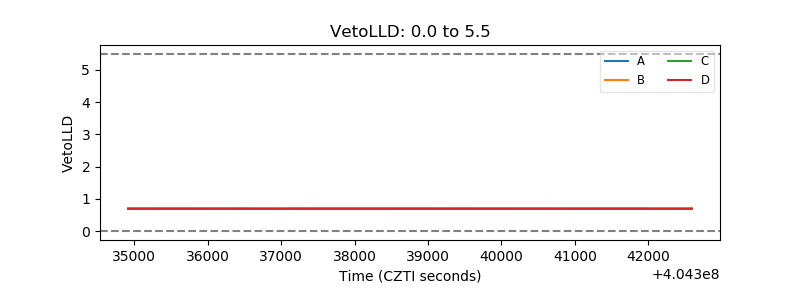 |
| Alpha Counter | 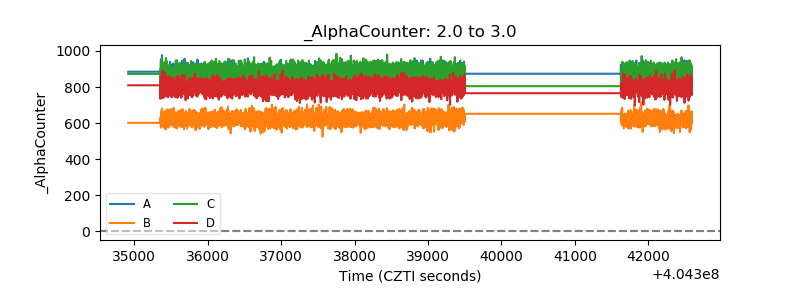 |
| _CPM_Rate | 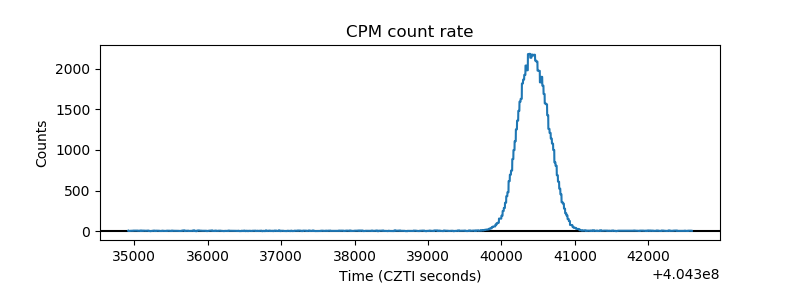 |
| CZT Counter | 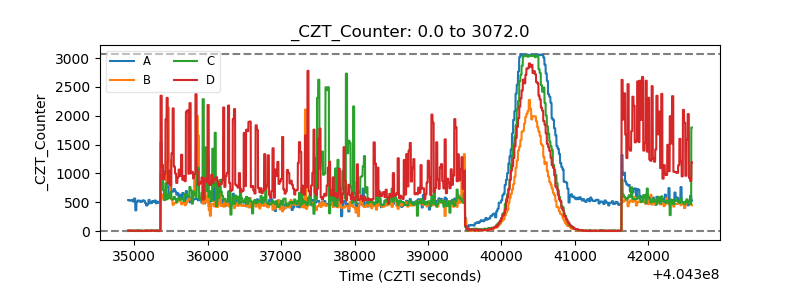 |
| +2.5 Volts monitor | 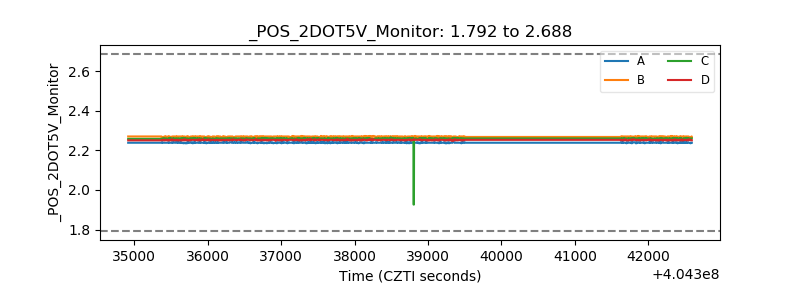 |
| +5 Volts monitor | 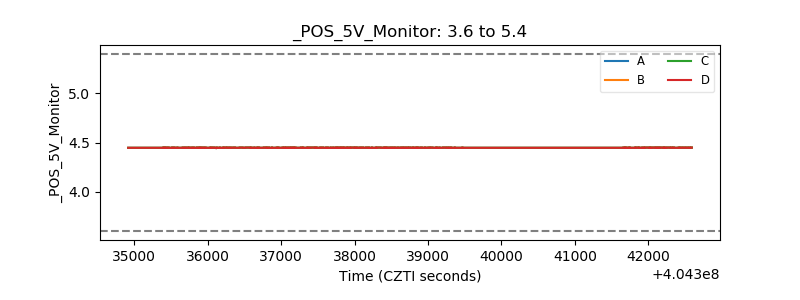 |
| _ROLL_ROT | 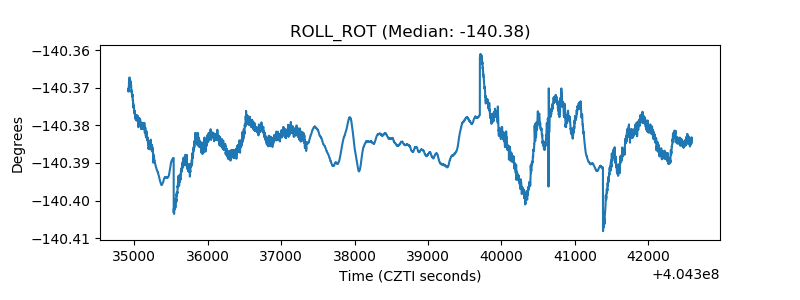 |
| _Roll_DEC | 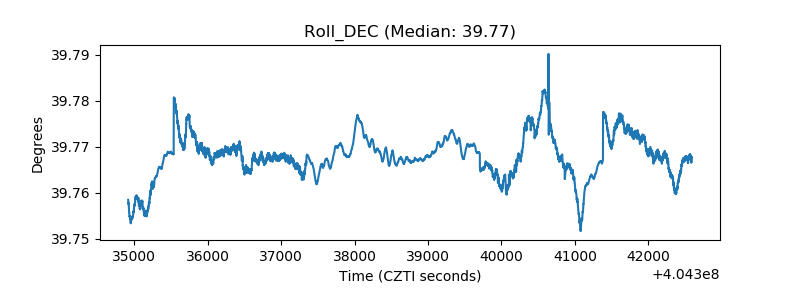 |
| _Roll_RA | 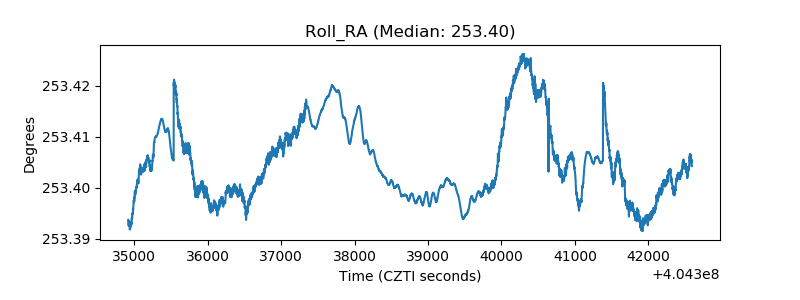 |
| Veto Counter | 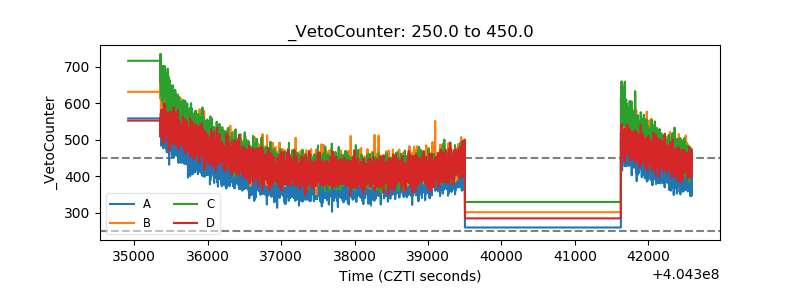 |