| Param | Original file | Final file |
|---|---|---|
| Filename | modeM0/AS1A07_145T01_9000005370_38246cztM0_level2.fits | modeM0/AS1A07_145T01_9000005370_38246cztM0_level2_quad_clean.evt |
| Size (bytes) | 417,156,480 | 91,163,520 |
| Size | 397.8 MB | 86.9 MB |
| Events in quadrant A | 2,668,085 | 619,657 |
| Events in quadrant B | 2,423,600 | 644,032 |
| Events in quadrant C | 3,005,472 | 612,029 |
| Events in quadrant D | 6,952,767 | 530,787 |
| Mode M9 | |||
|---|---|---|---|
| Quadrant | BADHDUFLAG | Total packets | Discarded packets |
| A | 0 | 28 | 0 |
| B | 0 | 28 | 0 |
| C | 0 | 28 | 0 |
| D | 0 | 29 | 0 |
| Mode SS | |||
|---|---|---|---|
| Quadrant | BADHDUFLAG | Total packets | Discarded packets |
| A | 0 | 104 | 0 |
| B | 0 | 104 | 0 |
| C | 0 | 104 | 0 |
| D | 0 | 104 | 0 |
| Mode M0 | |||
|---|---|---|---|
| Quadrant | BADHDUFLAG | Total packets | Discarded packets |
| A | 0 | 10918 | 3 |
| B | 0 | 10417 | 2 |
| C | 0 | 11926 | 2 |
| D | 0 | 24220 | 2 |
| Quadrant | Total seconds | Saturated seconds | Saturation percentage |
|---|---|---|---|
| A | 5047 | 11 | 0.217951% |
| B | 5047 | 12 | 0.237765% |
| C | 5047 | 70 | 1.386963% |
| D | 5047 | 529 | 10.481474% |
Noise dominated data is calculated using 1-second bins in cleaned event files. If a bin has >2000 counts, and if more than 50% of those come from <1% of pixels, then it is considered to be noise-dominated and hence unusable.
| Quadrant | # 1 sec bins | Bins with >0 counts | Bins with >2000 counts | High rate bins dominated by noise | Noise dominated (total time) | Noise dominated (detector-on time) | Marked lightcurve |
|---|---|---|---|---|---|---|---|
| A | 7201 | 5048 | 8 | 8 | 0.11% | 0.16% | 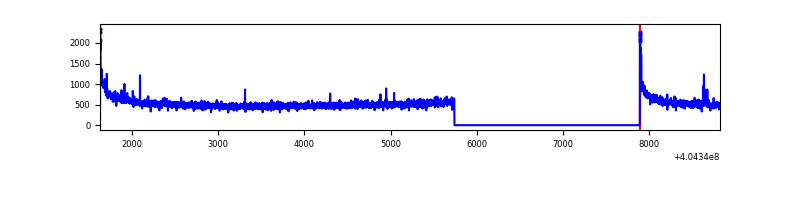 |
| B | 7201 | 5048 | 2 | 2 | 0.03% | 0.04% | 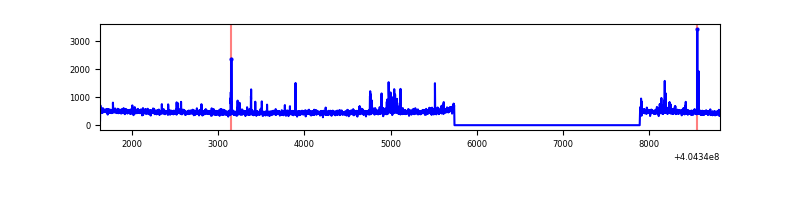 |
| C | 7201 | 5048 | 69 | 69 | 0.96% | 1.37% | 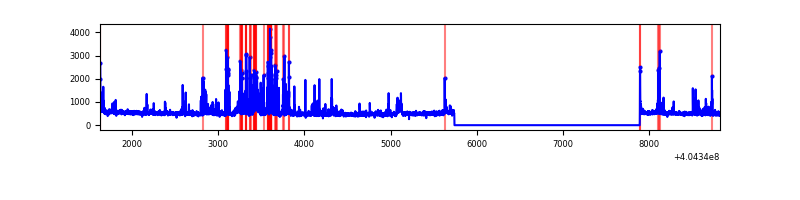 |
| D | 7201 | 5048 | 643 | 643 | 8.93% | 12.74% | 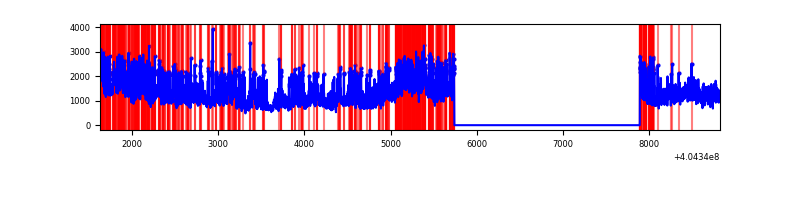 |
Top three noisy pixels from each quadrant. If the there are fewer than three noisy pixels in the level2.evt file, extra rows are filled as -1
| Pixel properties | Quadrant properties | ||||||
|---|---|---|---|---|---|---|---|
| Quadrant | DetID | PixID | Counts | Sigma | Mean | Median | Sigma |
| A | 10 | 83 | 357807 | 3039.85 | 583 | 572 | 117.5 |
| A | 12 | 189 | 20992 | 173.76 | 583 | 572 | 117.5 |
| A | 13 | 6 | 10011 | 80.32 | 583 | 572 | 117.5 |
| B | 5 | 172 | 88562 | 792.27 | 585 | 571 | 111.1 |
| B | 12 | 111 | 13787 | 119.0 | 585 | 571 | 111.1 |
| B | 11 | 111 | 12399 | 106.5 | 585 | 571 | 111.1 |
| C | 9 | 236 | 460006 | 3465.02 | 573 | 579 | 132.6 |
| C | 15 | 214 | 210776 | 1585.31 | 573 | 579 | 132.6 |
| C | 14 | 254 | 58538 | 437.13 | 573 | 579 | 132.6 |
| D | 10 | 203 | 2663794 | 19799.34 | 555 | 541 | 134.5 |
| D | 12 | 235 | 1297090 | 9638.89 | 555 | 541 | 134.5 |
| D | 1 | 52 | 640522 | 4757.79 | 555 | 541 | 134.5 |
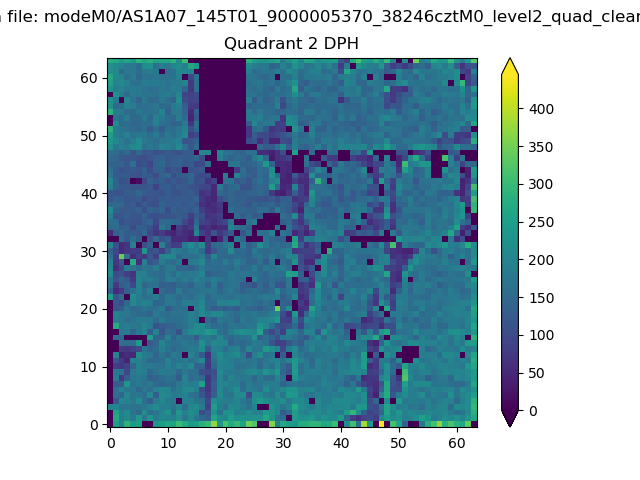
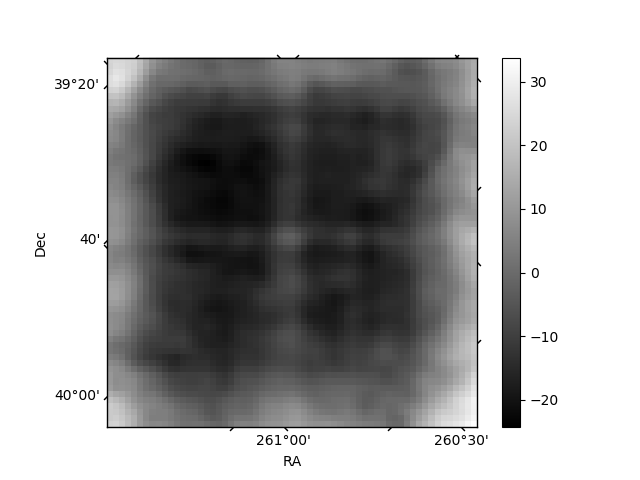
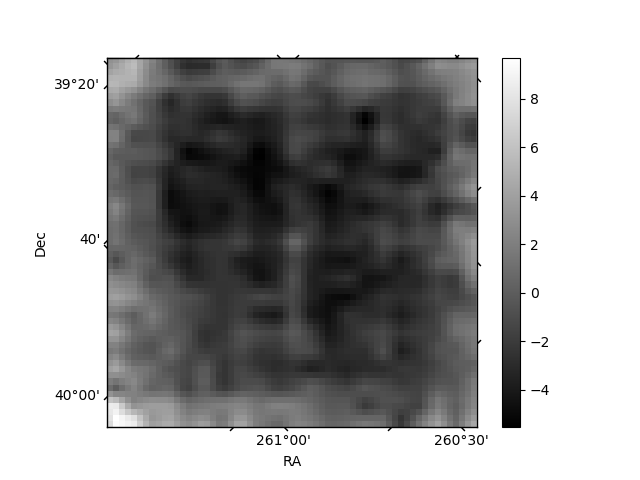
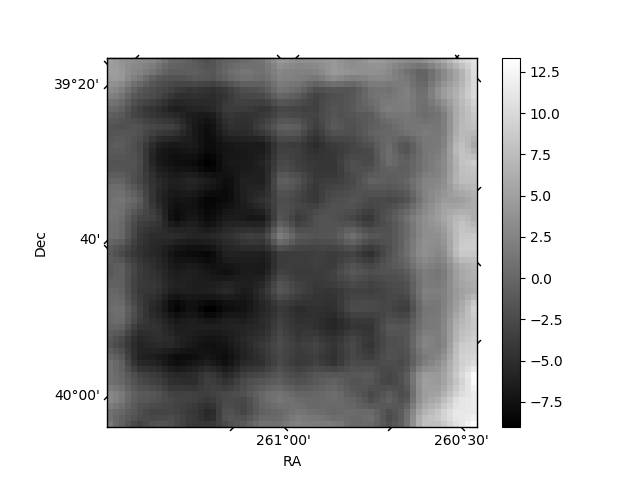
Histogram calculated using DETX and DETY for each event in the final _common_clean file
| Quadrant A | 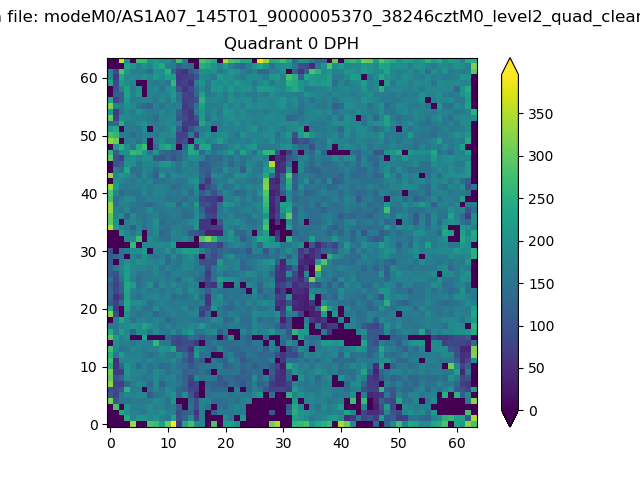 |
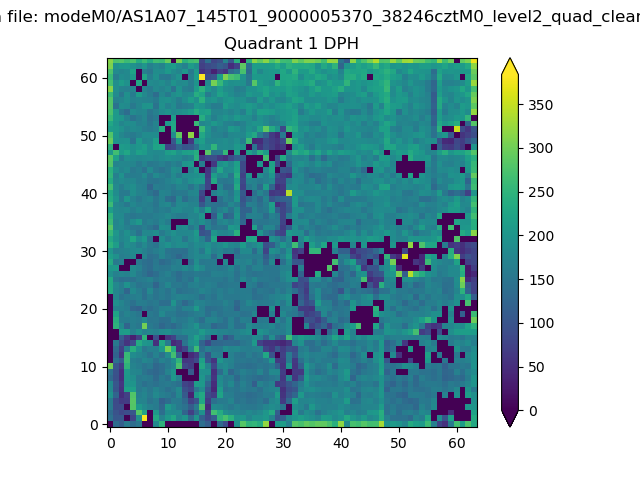 |
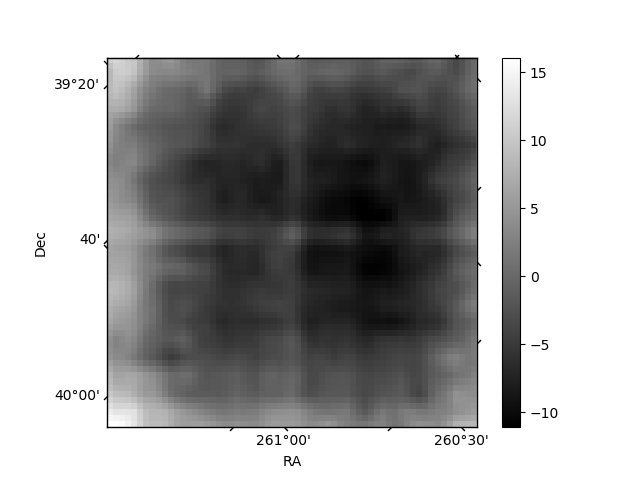
Quadrant B |
|---|---|---|---|
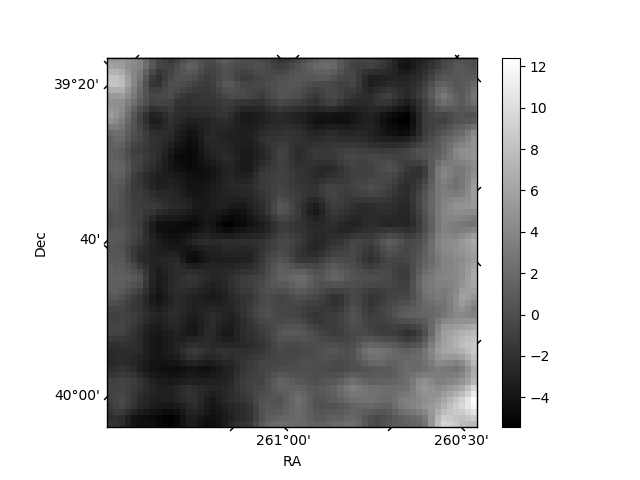
| Quadrant D | 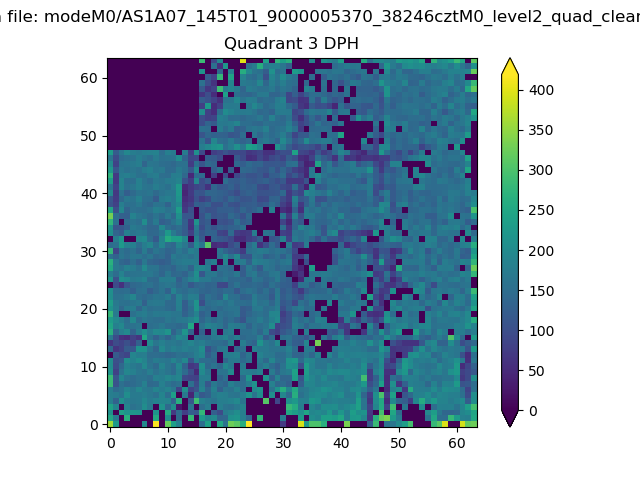 |
 |
Quadrant C |
| Plot type | Count rate plots | Images |
|---|---|---|
| Comparison with Poisson distribution Blue bars denote a histogram of data divided into 1 sec bins. Red curve is a Poisson curve with rate = median count rate of data. |
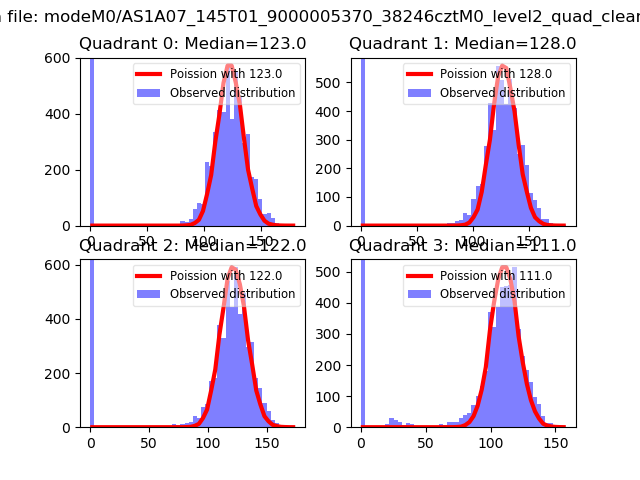 |
 |
| Quadrant-wise count rates Data is divided into 100 sec bins |
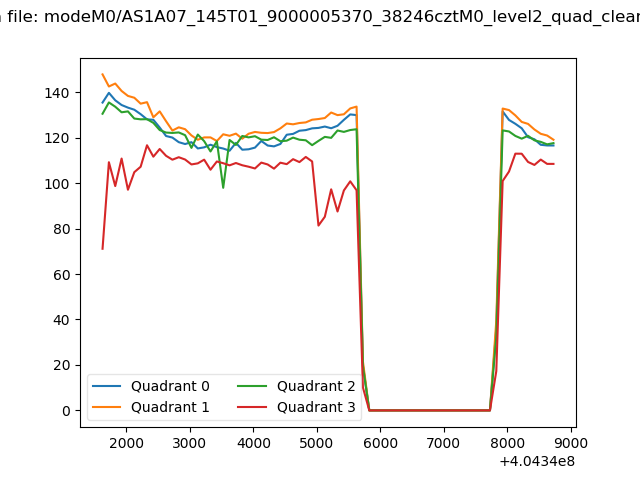 |
|
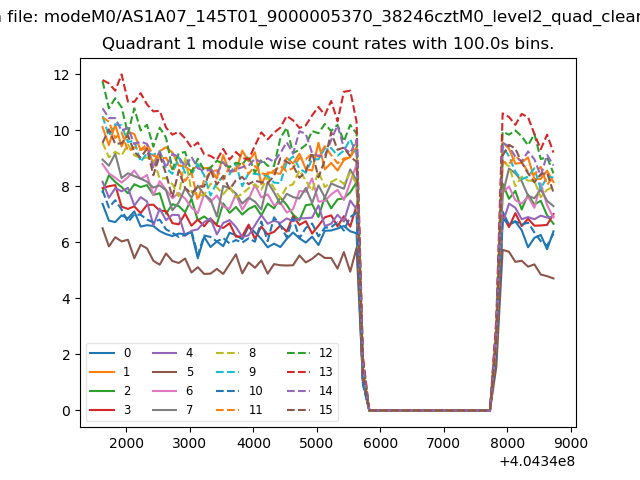
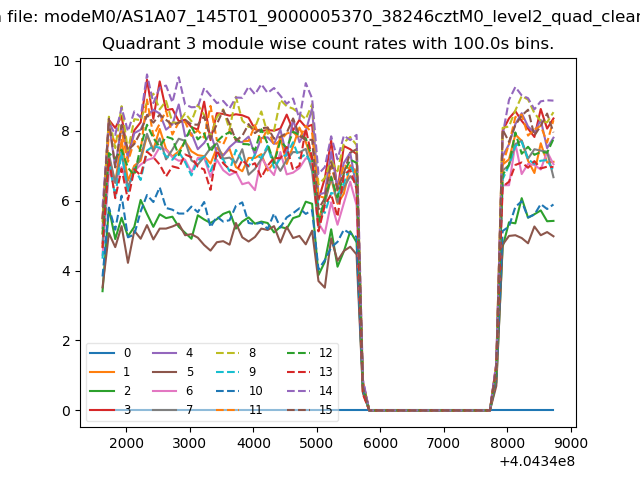
| Module-wise count rates for Quadrant A Data is divided into 100 sec bins |
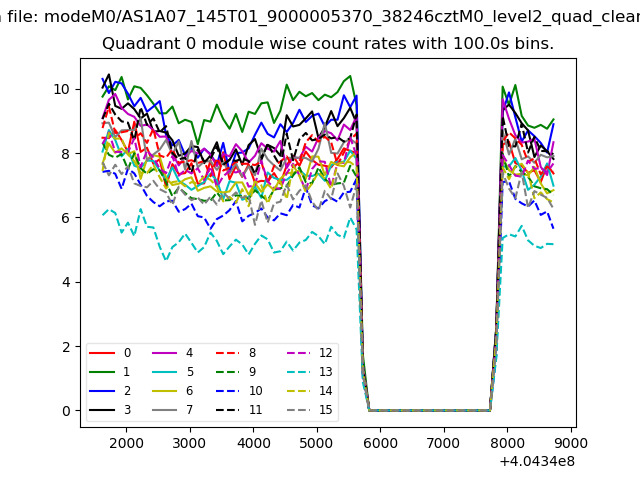 |
 |
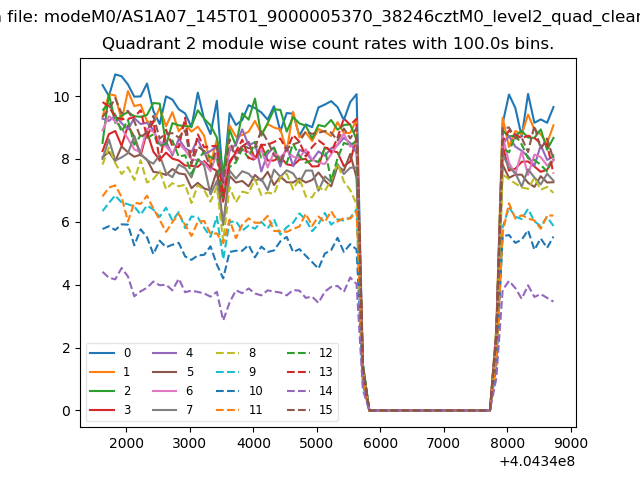
| Module-wise count rates for Quadrant B Data is divided into 100 sec bins |
 |
 |
| Module-wise count rates for Quadrant C Data is divided into 100 sec bins |
 |
 |
| Module-wise count rates for Quadrant D Data is divided into 100 sec bins |
 |
 |
| Parameter | Plot |
|---|---|
| CZT HV Monitor | 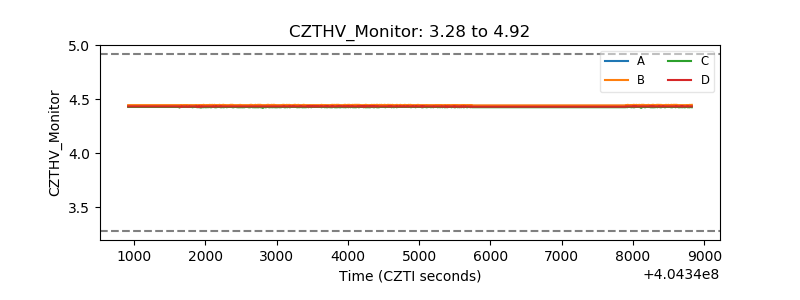 |
| D_VDD | 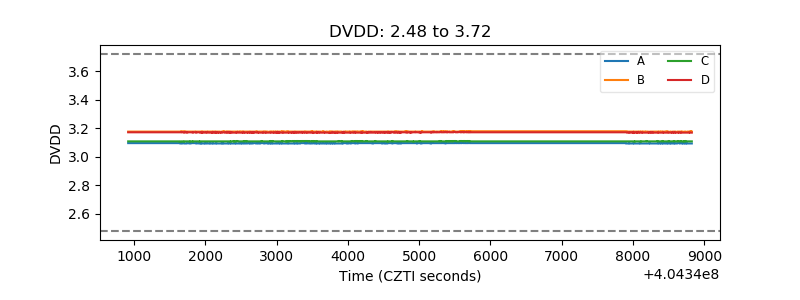 |
| Temperature 1 | 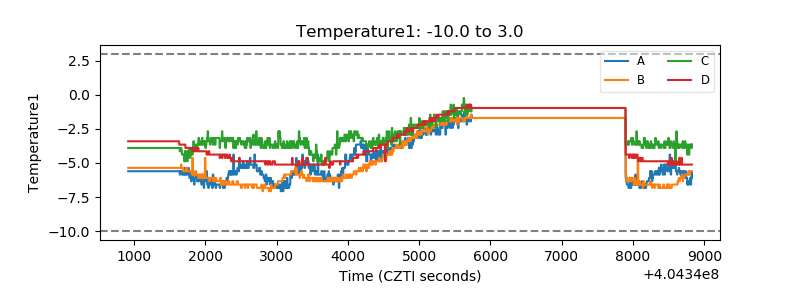 |
| Veto HV Monitor | 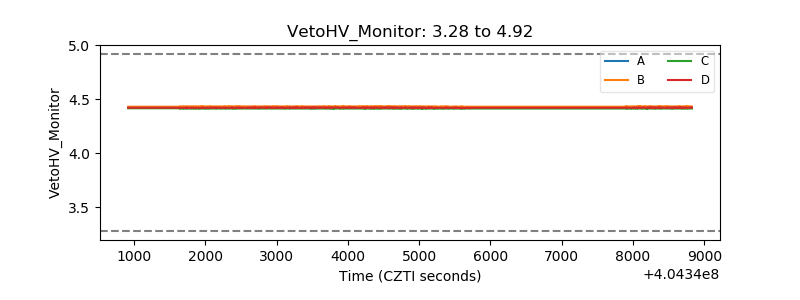 |
| Veto LLD | 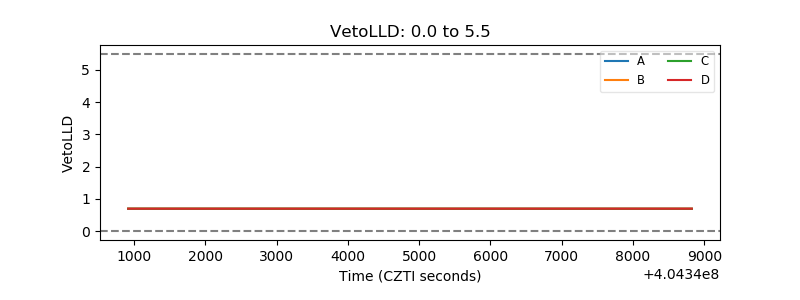 |
| Alpha Counter | 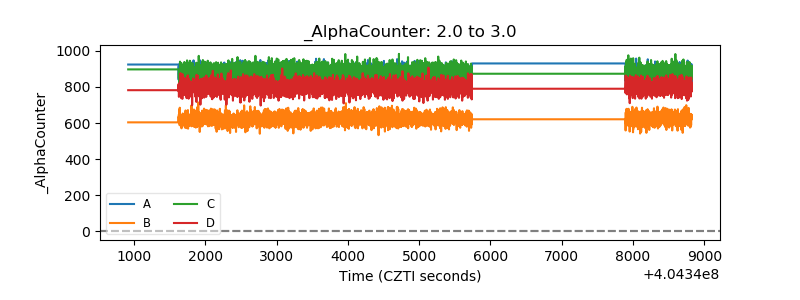 |
| _CPM_Rate | 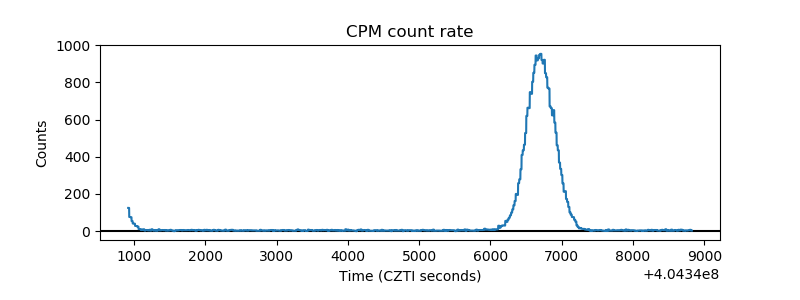 |
| CZT Counter | 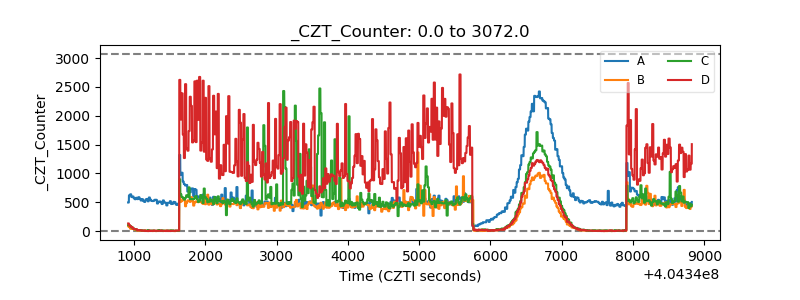 |
| +2.5 Volts monitor | 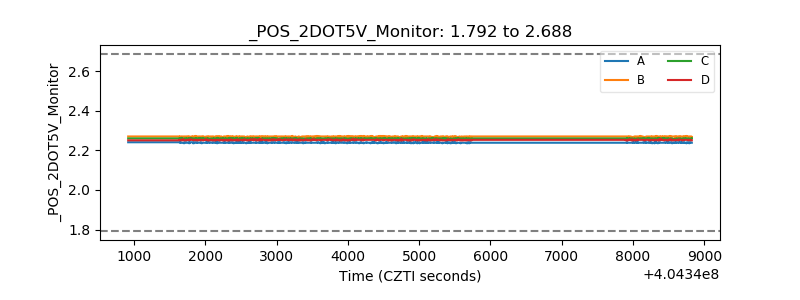 |
| +5 Volts monitor | 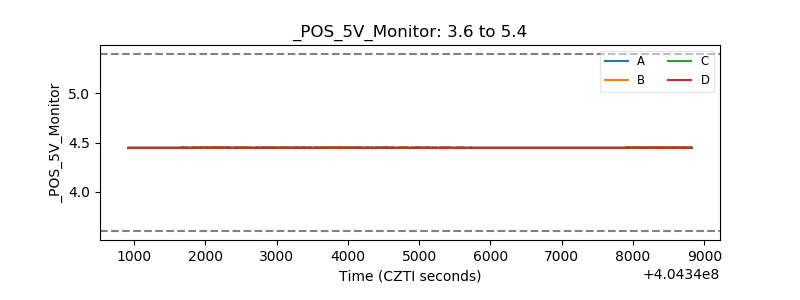 |
| _ROLL_ROT | 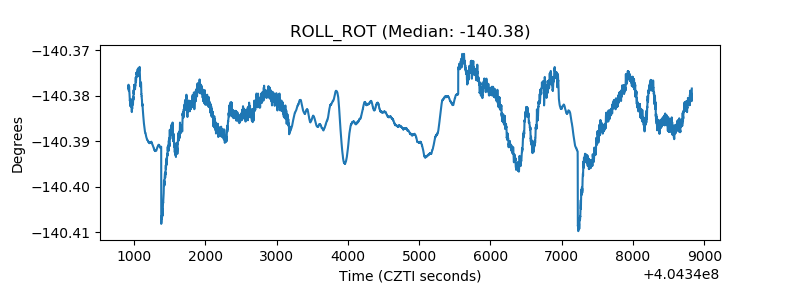 |
| _Roll_DEC | 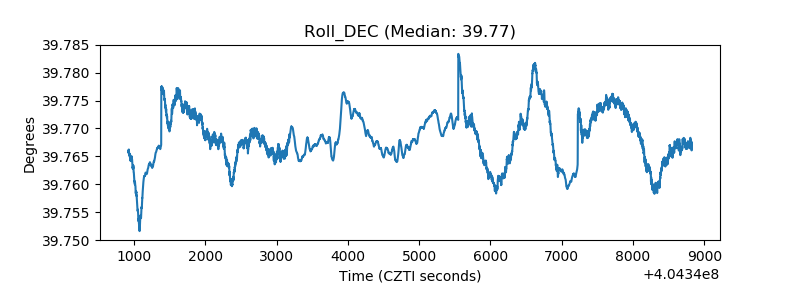 |
| _Roll_RA | 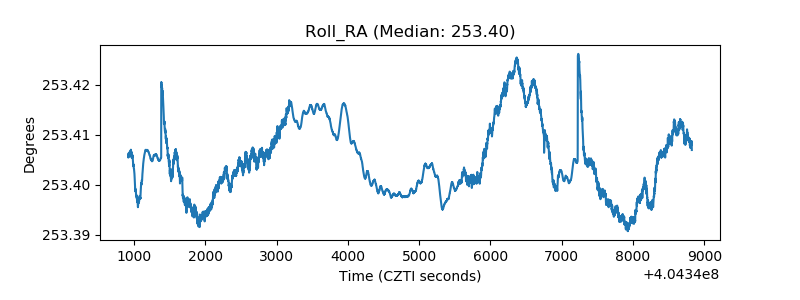 |
| Veto Counter | 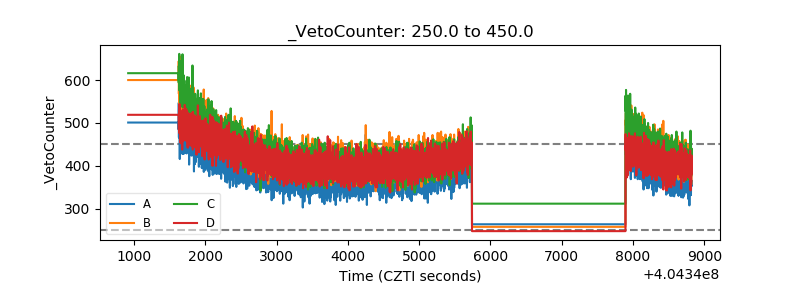 |