| Param | Original file | Final file |
|---|---|---|
| Filename | modeM0/AS1A07_145T01_9000005370_38247cztM0_level2.fits | modeM0/AS1A07_145T01_9000005370_38247cztM0_level2_quad_clean.evt |
| Size (bytes) | 398,485,440 | 90,501,120 |
| Size | 380.0 MB | 86.3 MB |
| Events in quadrant A | 2,700,247 | 608,336 |
| Events in quadrant B | 2,437,621 | 628,514 |
| Events in quadrant C | 3,212,863 | 596,779 |
| Events in quadrant D | 5,994,708 | 540,892 |
| Mode M9 | |||
|---|---|---|---|
| Quadrant | BADHDUFLAG | Total packets | Discarded packets |
| A | 0 | 29 | 0 |
| B | 0 | 29 | 0 |
| C | 0 | 29 | 0 |
| D | 0 | 30 | 0 |
| Mode SS | |||
|---|---|---|---|
| Quadrant | BADHDUFLAG | Total packets | Discarded packets |
| A | 0 | 108 | 0 |
| B | 0 | 108 | 0 |
| C | 0 | 108 | 0 |
| D | 0 | 108 | 0 |
| Mode M0 | |||
|---|---|---|---|
| Quadrant | BADHDUFLAG | Total packets | Discarded packets |
| A | 0 | 11167 | 3 |
| B | 0 | 10753 | 2 |
| C | 0 | 12706 | 2 |
| D | 0 | 21532 | 2 |
| Quadrant | Total seconds | Saturated seconds | Saturation percentage |
|---|---|---|---|
| A | 5219 | 9 | 0.172447% |
| B | 5219 | 16 | 0.306572% |
| C | 5219 | 111 | 2.126844% |
| D | 5219 | 266 | 5.096762% |
Noise dominated data is calculated using 1-second bins in cleaned event files. If a bin has >2000 counts, and if more than 50% of those come from <1% of pixels, then it is considered to be noise-dominated and hence unusable.
| Quadrant | # 1 sec bins | Bins with >0 counts | Bins with >2000 counts | High rate bins dominated by noise | Noise dominated (total time) | Noise dominated (detector-on time) | Marked lightcurve |
|---|---|---|---|---|---|---|---|
| A | 7252 | 5220 | 7 | 7 | 0.10% | 0.13% | 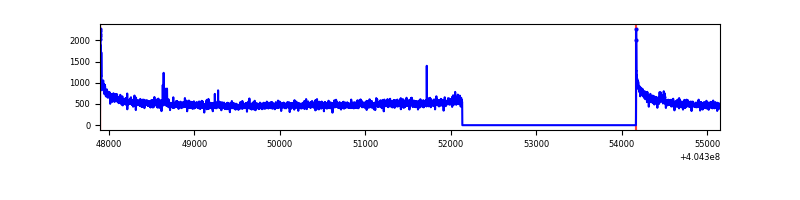 |
| B | 7252 | 5220 | 4 | 4 | 0.06% | 0.08% | 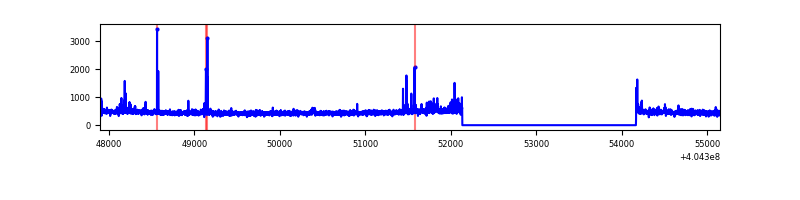 |
| C | 7252 | 5220 | 105 | 105 | 1.45% | 2.01% | 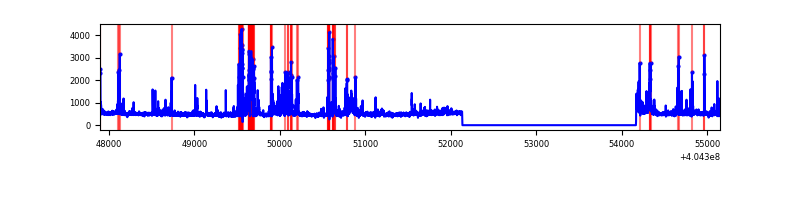 |
| D | 7252 | 5220 | 295 | 295 | 4.07% | 5.65% | 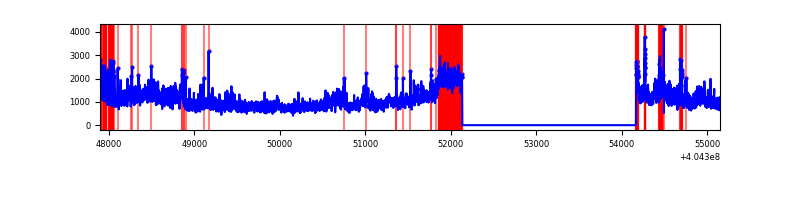 |
Top three noisy pixels from each quadrant. If the there are fewer than three noisy pixels in the level2.evt file, extra rows are filled as -1
| Pixel properties | Quadrant properties | ||||||
|---|---|---|---|---|---|---|---|
| Quadrant | DetID | PixID | Counts | Sigma | Mean | Median | Sigma |
| A | 10 | 83 | 362055 | 3011.94 | 587 | 575 | 120.0 |
| A | 12 | 189 | 33436 | 273.8 | 587 | 575 | 120.0 |
| A | 13 | 6 | 18110 | 146.1 | 587 | 575 | 120.0 |
| B | 5 | 172 | 50277 | 441.01 | 588 | 574 | 112.7 |
| B | 0 | 229 | 32360 | 282.04 | 588 | 574 | 112.7 |
| B | 4 | 232 | 16628 | 142.45 | 588 | 574 | 112.7 |
| C | 14 | 254 | 394511 | 2965.15 | 571 | 576 | 132.9 |
| C | 15 | 214 | 218411 | 1639.65 | 571 | 576 | 132.9 |
| C | 15 | 208 | 177967 | 1335.22 | 571 | 576 | 132.9 |
| D | 10 | 203 | 2363722 | 17258.47 | 565 | 550 | 136.9 |
| D | 12 | 235 | 1044780 | 7626.11 | 565 | 550 | 136.9 |
| D | 13 | 249 | 182783 | 1330.87 | 565 | 550 | 136.9 |
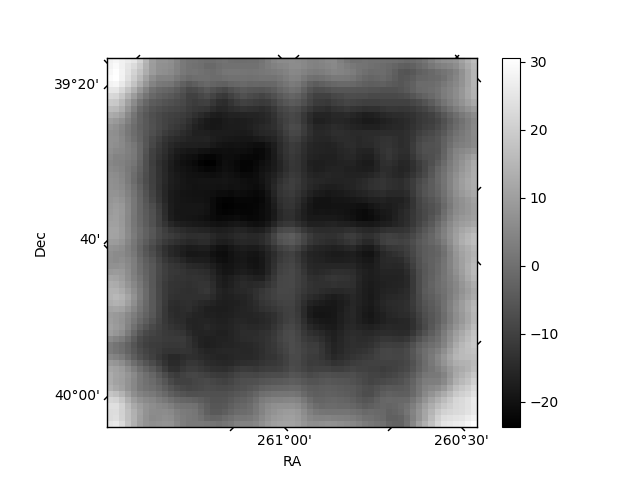
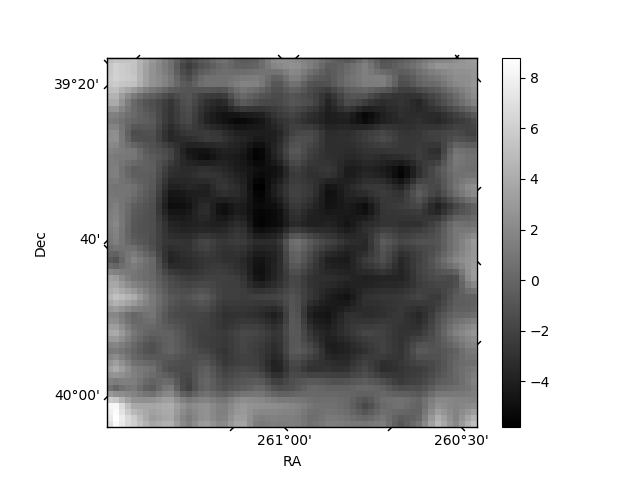
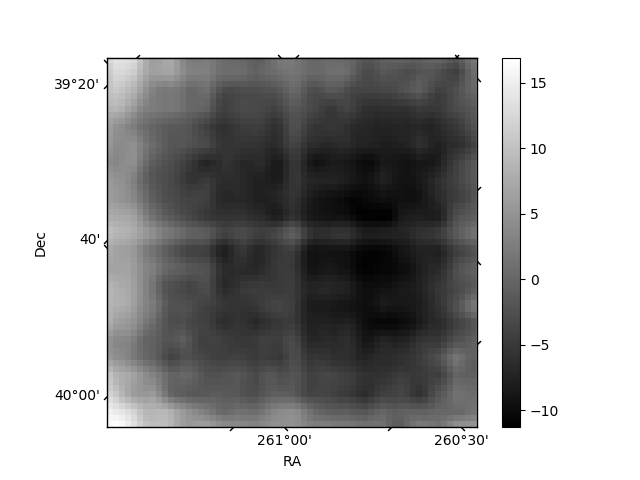
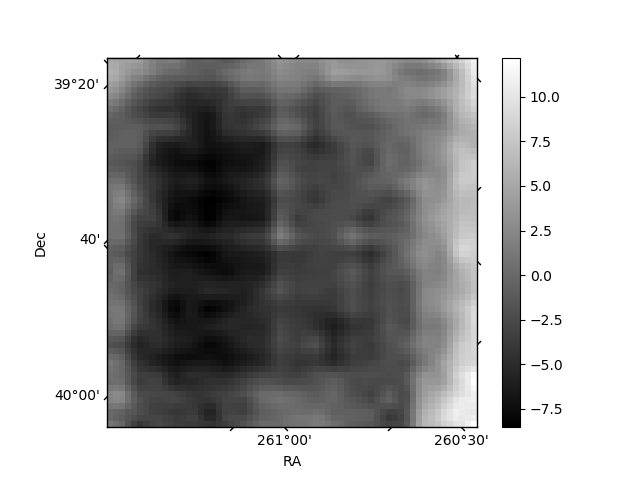
Histogram calculated using DETX and DETY for each event in the final _common_clean file
| Quadrant A | 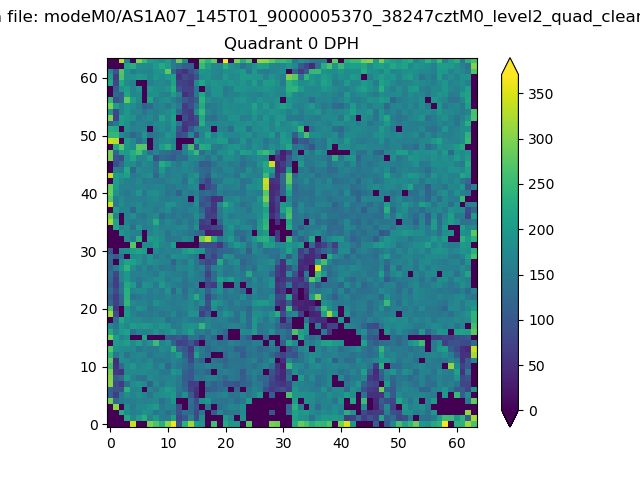 |
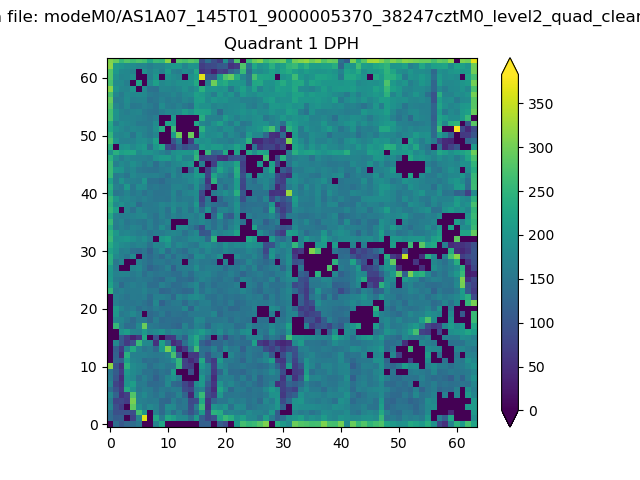 |
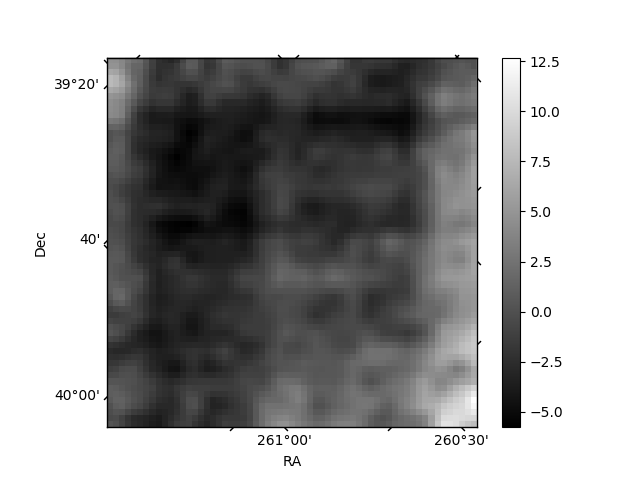
Quadrant B |
|---|---|---|---|
| Quadrant D | 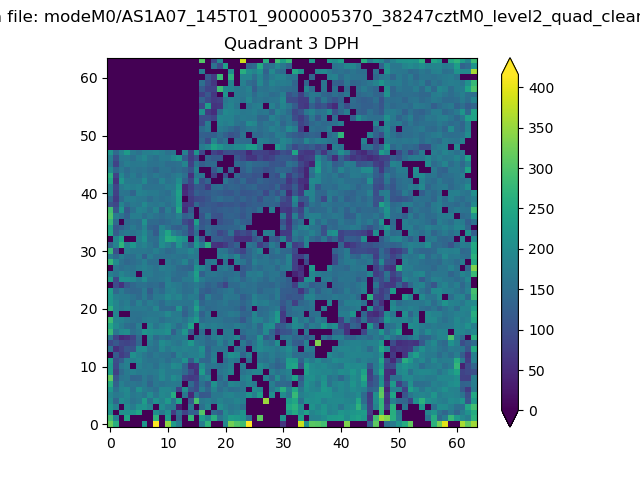 |
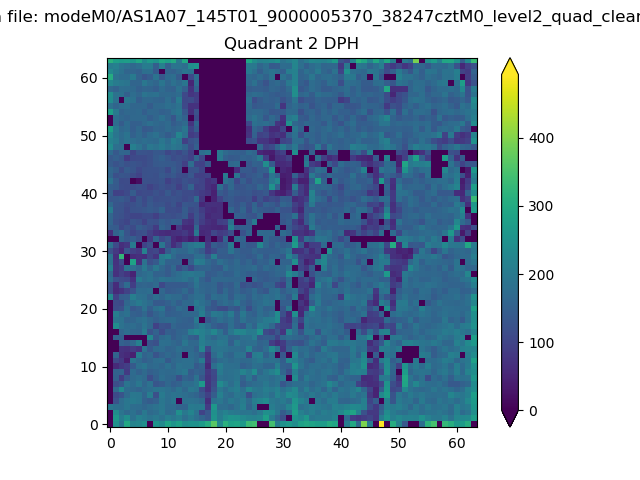 |
Quadrant C |
| Plot type | Count rate plots | Images |
|---|---|---|
| Comparison with Poisson distribution Blue bars denote a histogram of data divided into 1 sec bins. Red curve is a Poisson curve with rate = median count rate of data. |
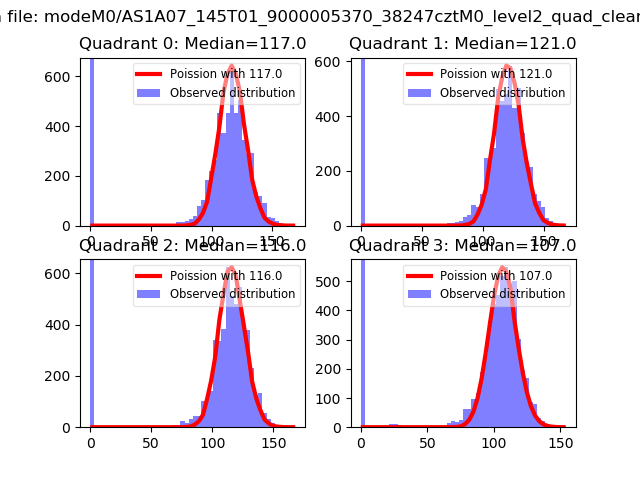 |
 |
| Quadrant-wise count rates Data is divided into 100 sec bins |
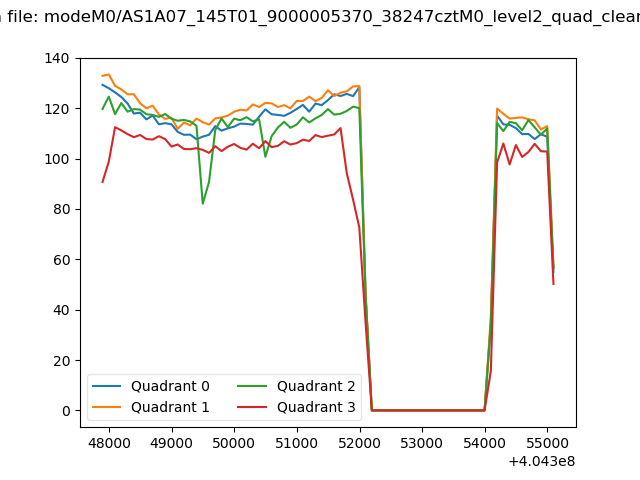 |
|
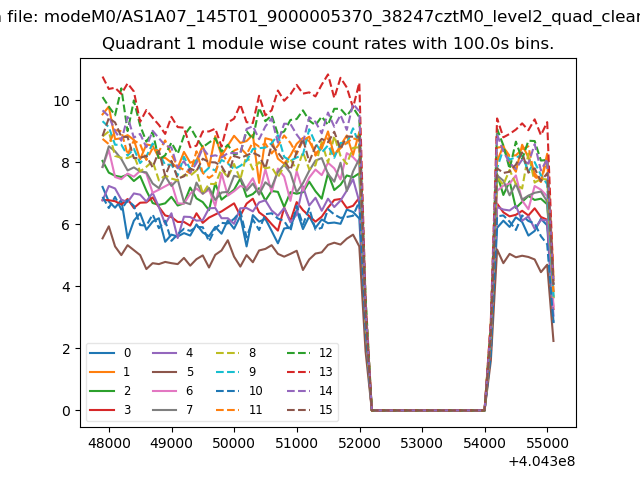
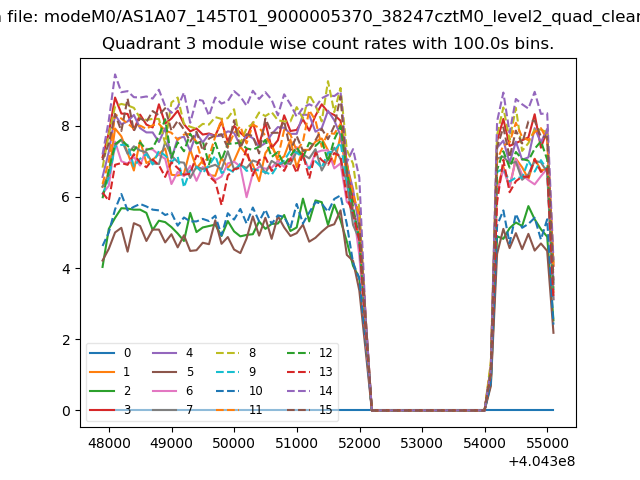
| Module-wise count rates for Quadrant A Data is divided into 100 sec bins |
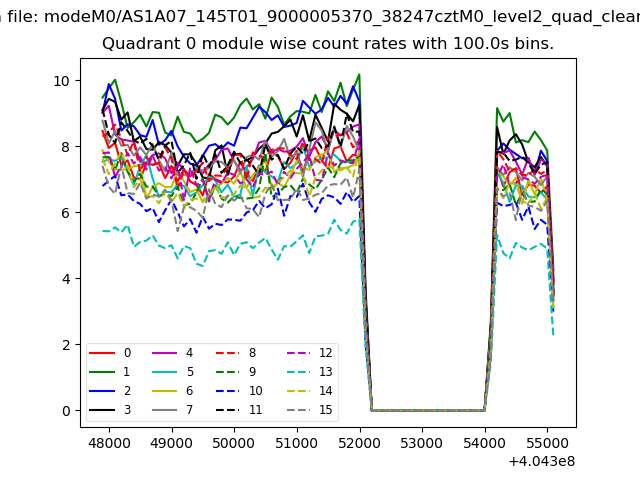 |
 |
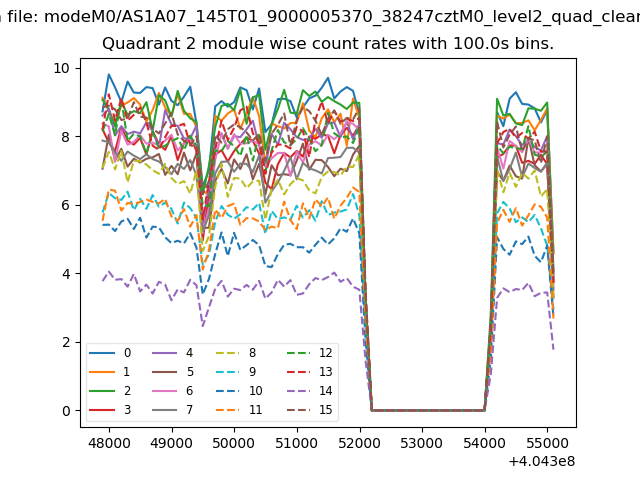
| Module-wise count rates for Quadrant B Data is divided into 100 sec bins |
 |
 |
| Module-wise count rates for Quadrant C Data is divided into 100 sec bins |
 |
 |
| Module-wise count rates for Quadrant D Data is divided into 100 sec bins |
 |
 |
| Parameter | Plot |
|---|---|
| CZT HV Monitor | 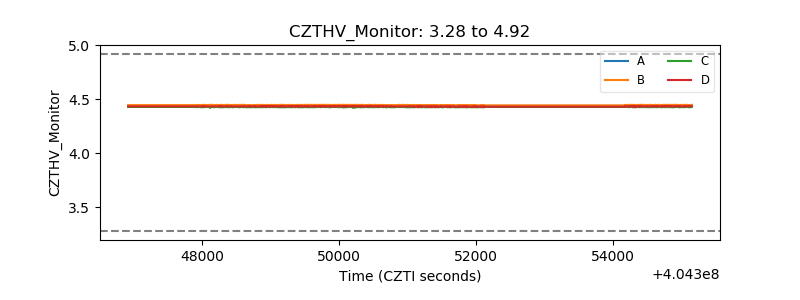 |
| D_VDD | 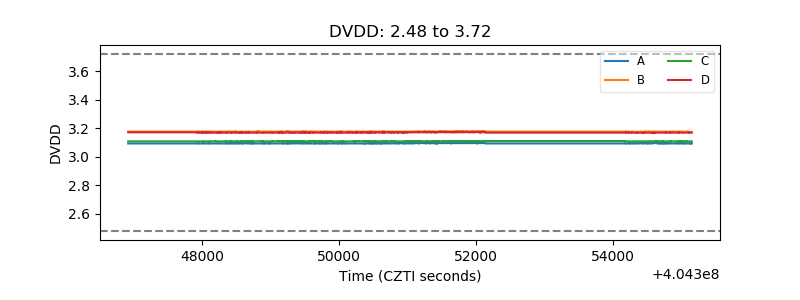 |
| Temperature 1 | 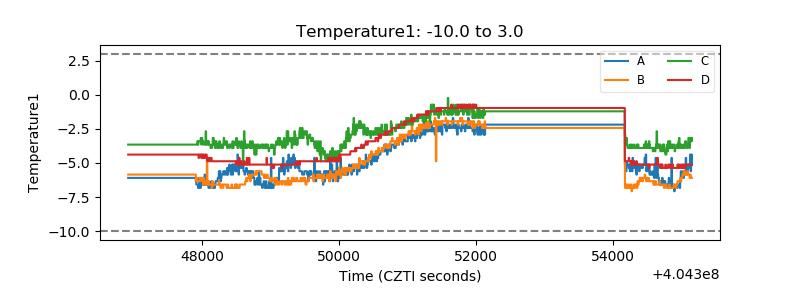 |
| Veto HV Monitor | 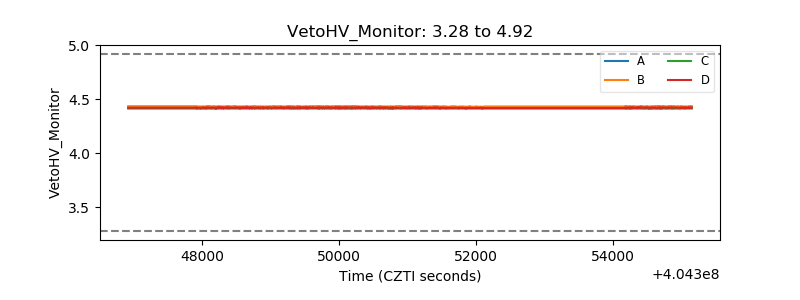 |
| Veto LLD | 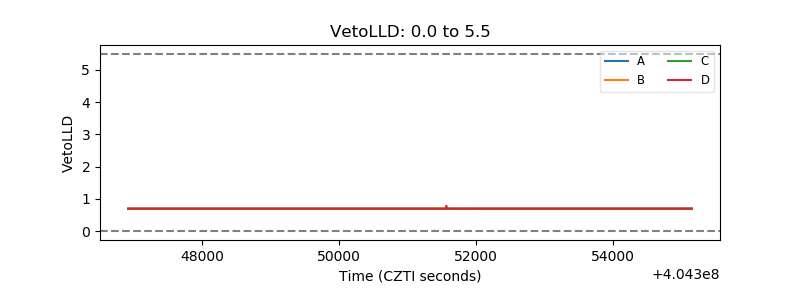 |
| Alpha Counter | 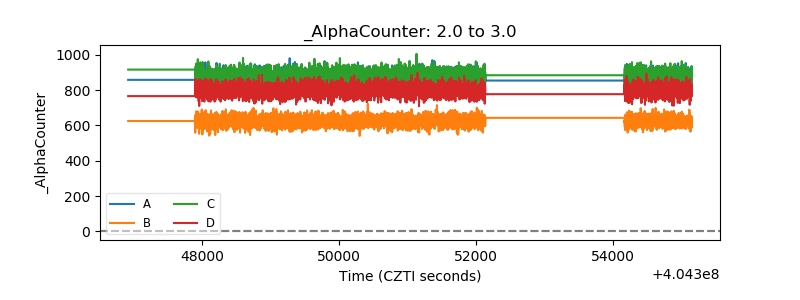 |
| _CPM_Rate | 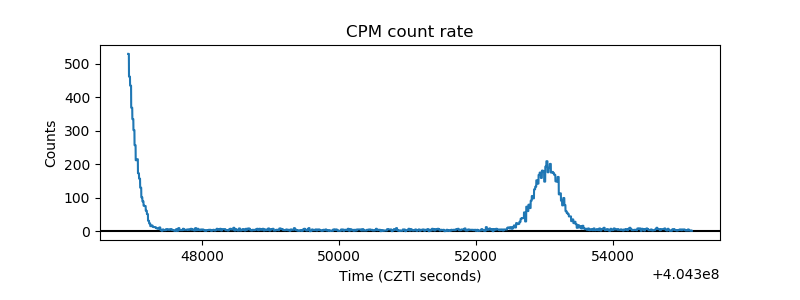 |
| CZT Counter | 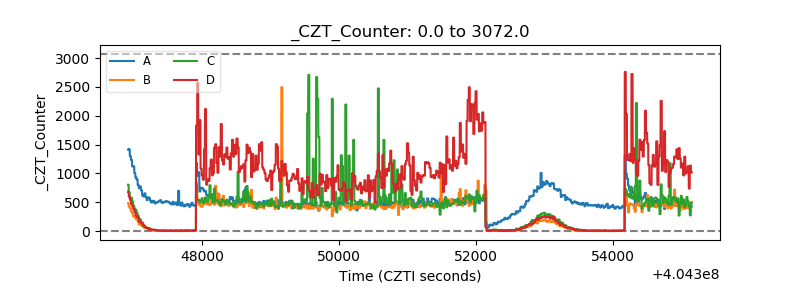 |
| +2.5 Volts monitor | 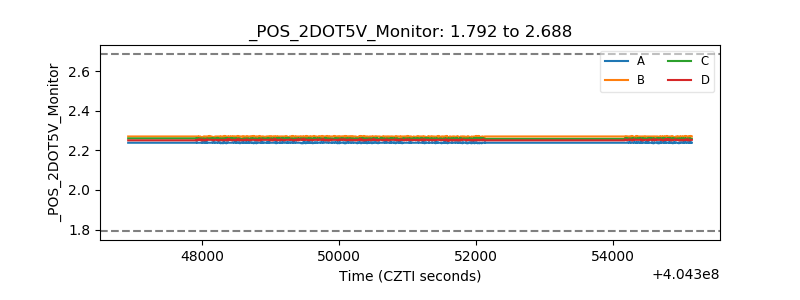 |
| +5 Volts monitor | 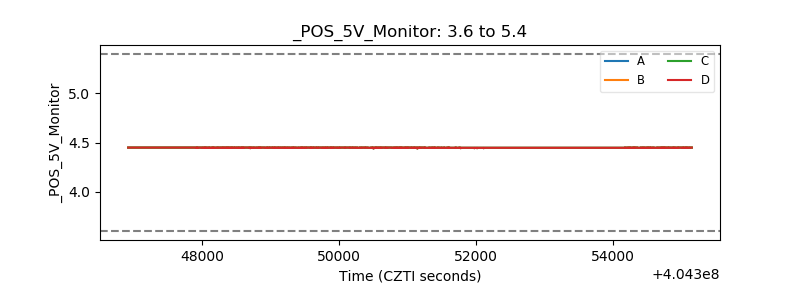 |
| _ROLL_ROT |  |
| _Roll_DEC | 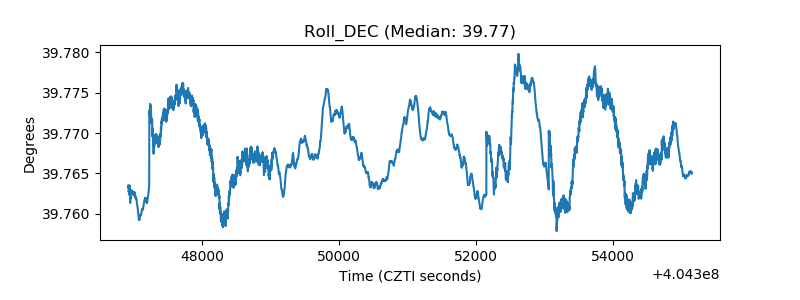 |
| _Roll_RA | 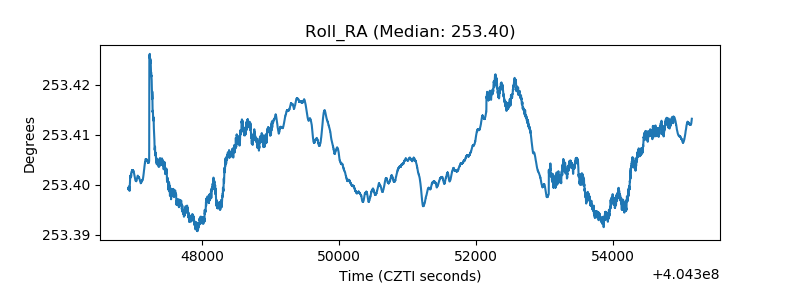 |
| Veto Counter | 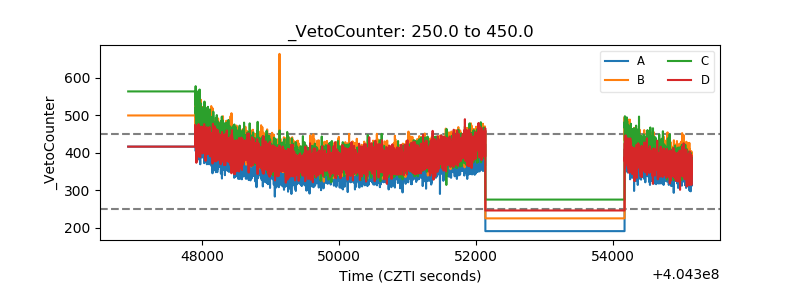 |