| Param | Original file | Final file |
|---|---|---|
| Filename | modeM0/AS1A07_145T01_9000005370_38248cztM0_level2.fits | modeM0/AS1A07_145T01_9000005370_38248cztM0_level2_quad_clean.evt |
| Size (bytes) | 469,160,640 | 88,986,240 |
| Size | 447.4 MB | 84.9 MB |
| Events in quadrant A | 2,863,211 | 609,115 |
| Events in quadrant B | 2,632,865 | 625,697 |
| Events in quadrant C | 3,719,755 | 588,225 |
| Events in quadrant D | 7,731,571 | 493,519 |
| Mode M9 | |||
|---|---|---|---|
| Quadrant | BADHDUFLAG | Total packets | Discarded packets |
| A | 0 | 29 | 0 |
| B | 0 | 29 | 0 |
| C | 0 | 29 | 0 |
| D | 0 | 30 | 0 |
| Mode SS | |||
|---|---|---|---|
| Quadrant | BADHDUFLAG | Total packets | Discarded packets |
| A | 0 | 108 | 0 |
| B | 0 | 108 | 0 |
| C | 0 | 108 | 0 |
| D | 0 | 108 | 0 |
| Mode M0 | |||
|---|---|---|---|
| Quadrant | BADHDUFLAG | Total packets | Discarded packets |
| A | 0 | 11900 | 3 |
| B | 0 | 11530 | 2 |
| C | 0 | 14463 | 2 |
| D | 0 | 26820 | 2 |
| Quadrant | Total seconds | Saturated seconds | Saturation percentage |
|---|---|---|---|
| A | 5405 | 9 | 0.166512% |
| B | 5405 | 38 | 0.703053% |
| C | 5405 | 229 | 4.236818% |
| D | 5405 | 925 | 17.113784% |
Noise dominated data is calculated using 1-second bins in cleaned event files. If a bin has >2000 counts, and if more than 50% of those come from <1% of pixels, then it is considered to be noise-dominated and hence unusable.
| Quadrant | # 1 sec bins | Bins with >0 counts | Bins with >2000 counts | High rate bins dominated by noise | Noise dominated (total time) | Noise dominated (detector-on time) | Marked lightcurve |
|---|---|---|---|---|---|---|---|
| A | 7138 | 5406 | 6 | 6 | 0.08% | 0.11% | 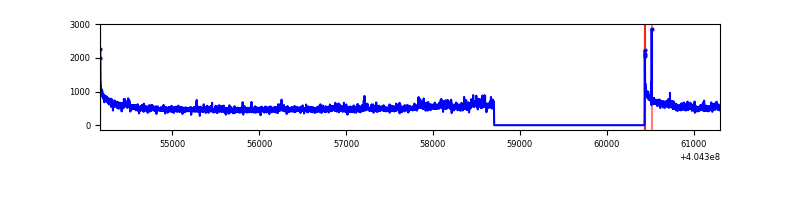 |
| B | 7138 | 5406 | 21 | 21 | 0.29% | 0.39% | 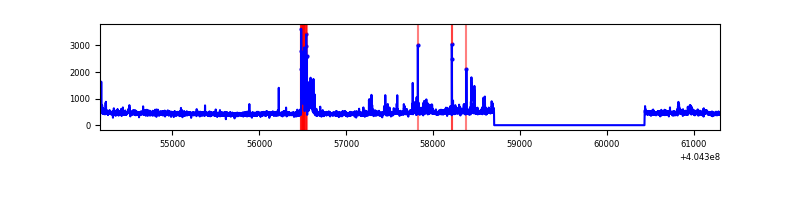 |
| C | 7138 | 5406 | 188 | 188 | 2.63% | 3.48% | 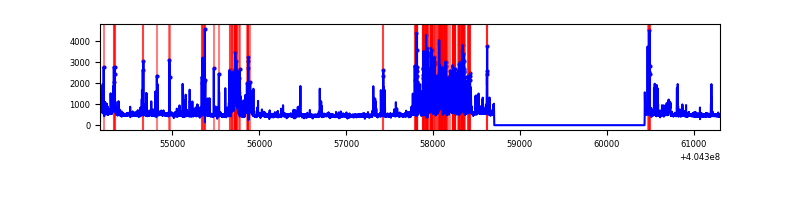 |
| D | 7138 | 5406 | 1106 | 1106 | 15.49% | 20.46% | 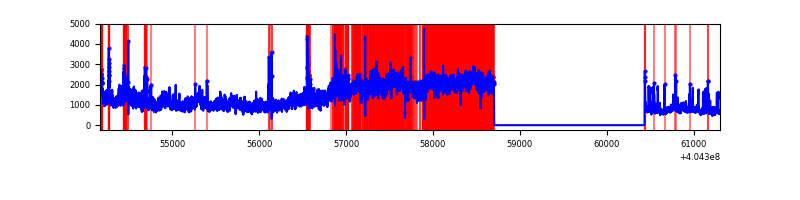 |
Top three noisy pixels from each quadrant. If the there are fewer than three noisy pixels in the level2.evt file, extra rows are filled as -1
| Pixel properties | Quadrant properties | ||||||
|---|---|---|---|---|---|---|---|
| Quadrant | DetID | PixID | Counts | Sigma | Mean | Median | Sigma |
| A | 10 | 83 | 380745 | 3116.24 | 601 | 589 | 122.0 |
| A | 12 | 189 | 124765 | 1017.9 | 601 | 589 | 122.0 |
| A | 13 | 6 | 12844 | 100.46 | 601 | 589 | 122.0 |
| B | 5 | 184 | 161233 | 1367.63 | 601 | 586 | 117.5 |
| B | 0 | 229 | 43235 | 363.08 | 601 | 586 | 117.5 |
| B | 5 | 172 | 38168 | 319.95 | 601 | 586 | 117.5 |
| C | 9 | 236 | 655692 | 4853.56 | 578 | 582 | 135.0 |
| C | 14 | 254 | 329233 | 2434.9 | 578 | 582 | 135.0 |
| C | 15 | 214 | 223910 | 1654.59 | 578 | 582 | 135.0 |
| D | 10 | 203 | 3412067 | 24681.7 | 566 | 549 | 138.2 |
| D | 12 | 235 | 1684013 | 12179.55 | 566 | 549 | 138.2 |
| D | 13 | 249 | 176721 | 1274.57 | 566 | 549 | 138.2 |
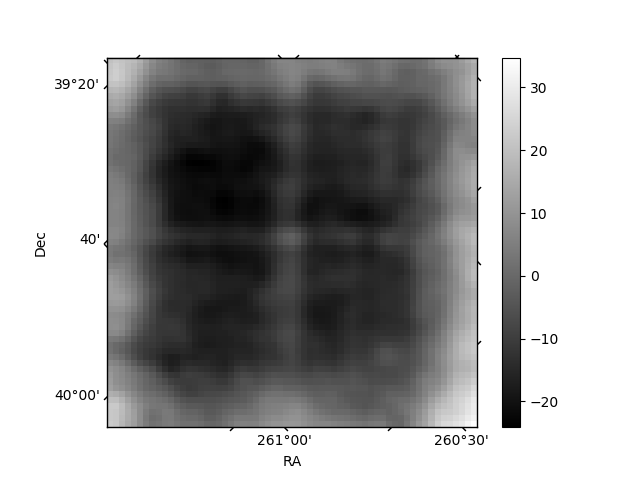
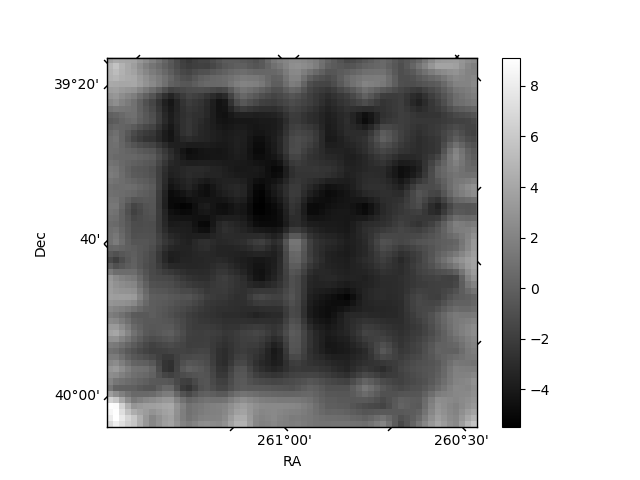
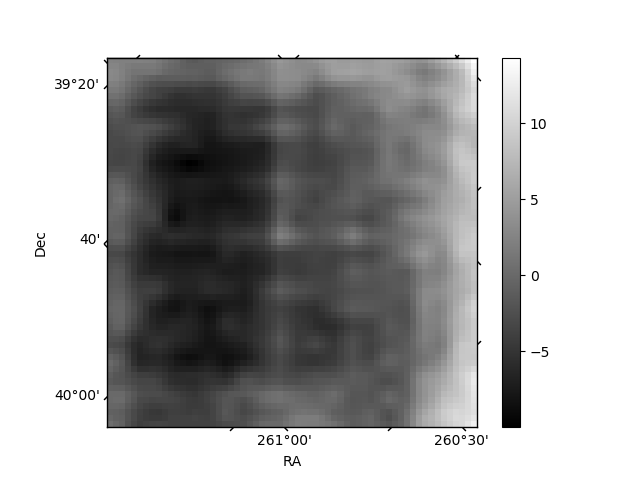
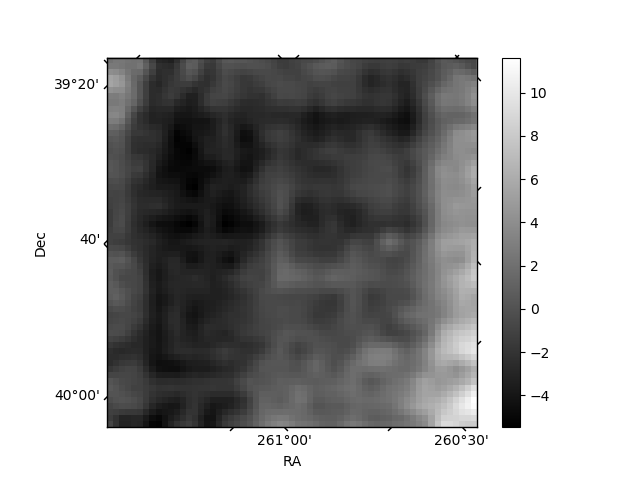
Histogram calculated using DETX and DETY for each event in the final _common_clean file
| Quadrant A | 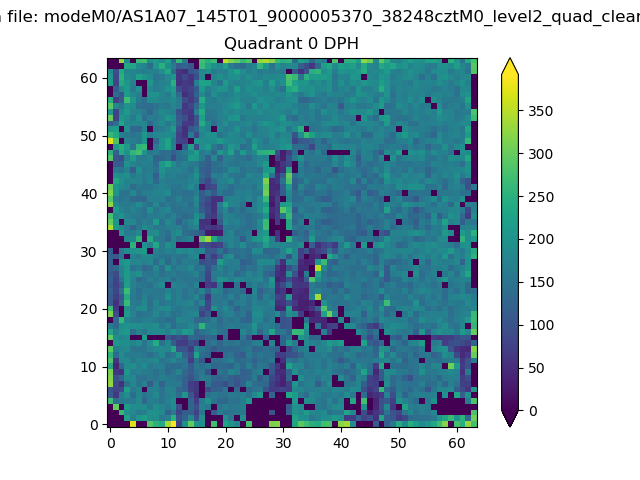 |
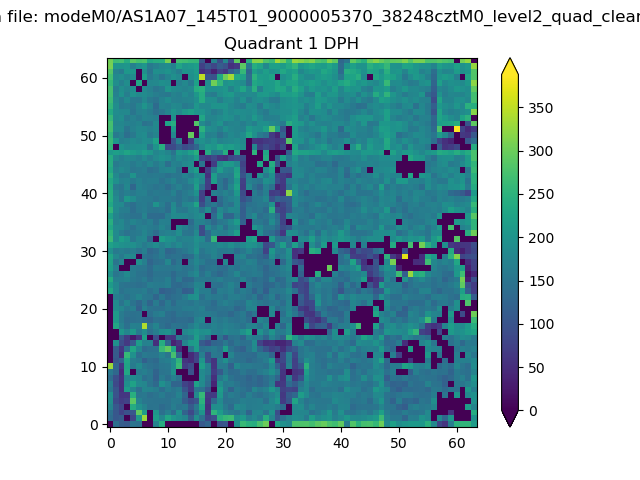 |
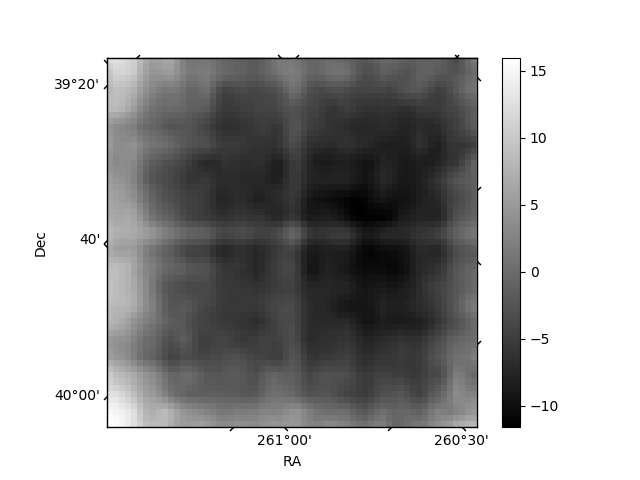
Quadrant B |
|---|---|---|---|
| Quadrant D | 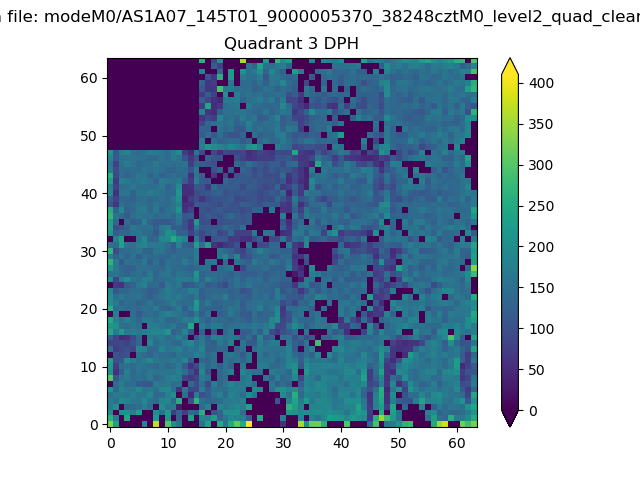 |
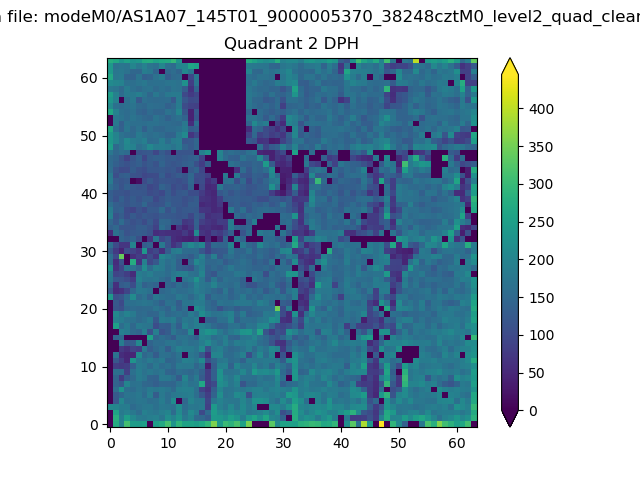 |
Quadrant C |
| Plot type | Count rate plots | Images |
|---|---|---|
| Comparison with Poisson distribution Blue bars denote a histogram of data divided into 1 sec bins. Red curve is a Poisson curve with rate = median count rate of data. |
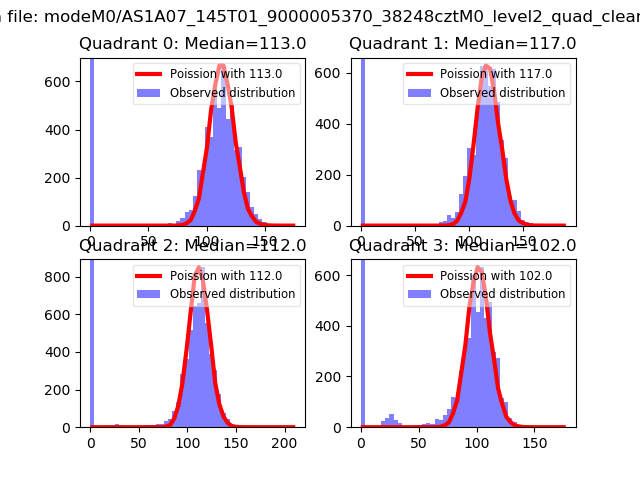 |
 |
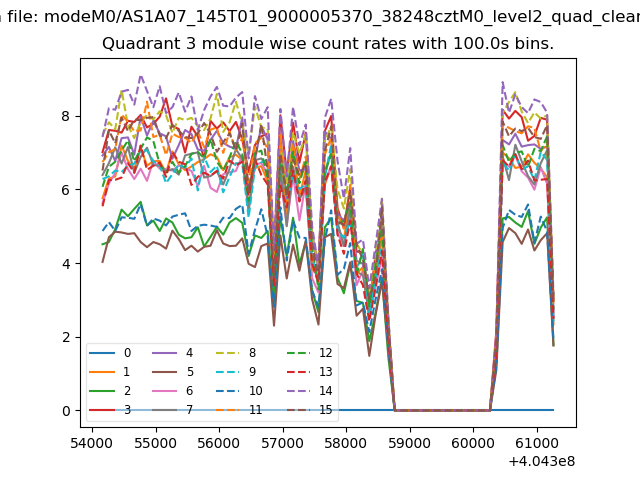
| Quadrant-wise count rates Data is divided into 100 sec bins |
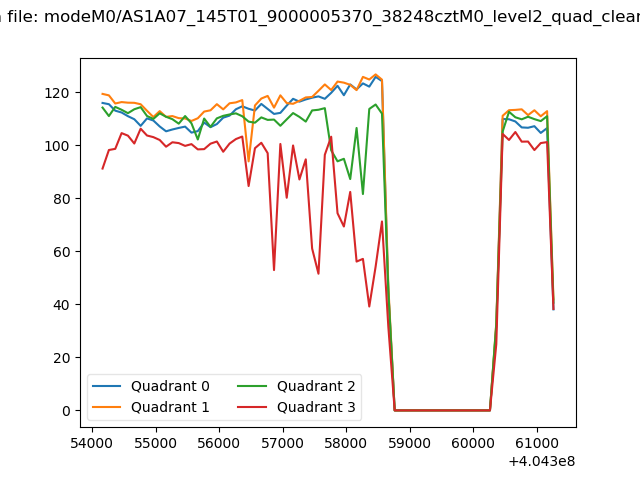 |
|
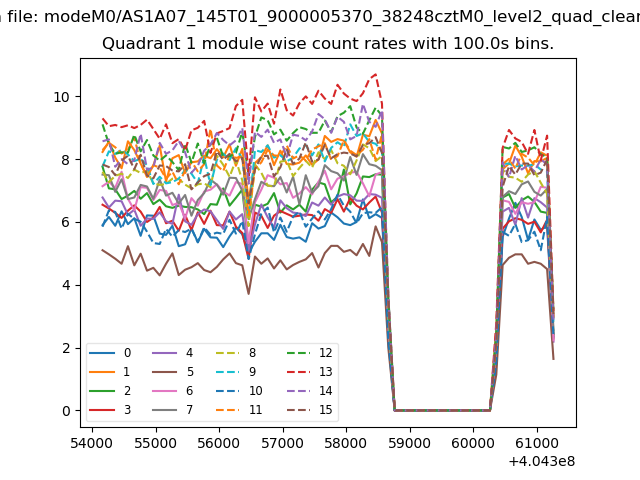
| Module-wise count rates for Quadrant A Data is divided into 100 sec bins |
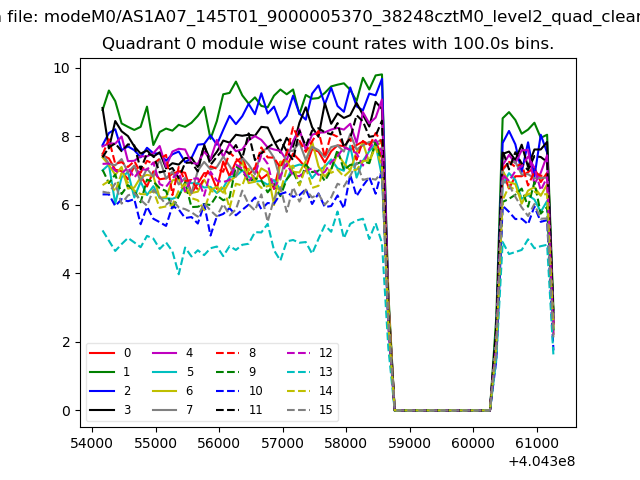 |
 |
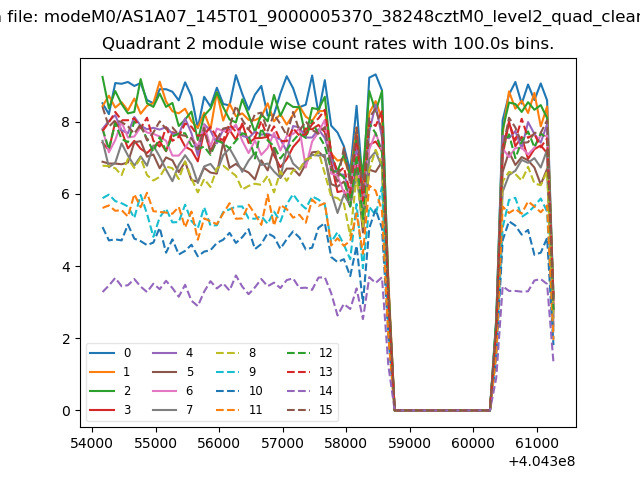
| Module-wise count rates for Quadrant B Data is divided into 100 sec bins |
 |
 |
| Module-wise count rates for Quadrant C Data is divided into 100 sec bins |
 |
 |
| Module-wise count rates for Quadrant D Data is divided into 100 sec bins |
 |
 |
| Parameter | Plot |
|---|---|
| CZT HV Monitor | 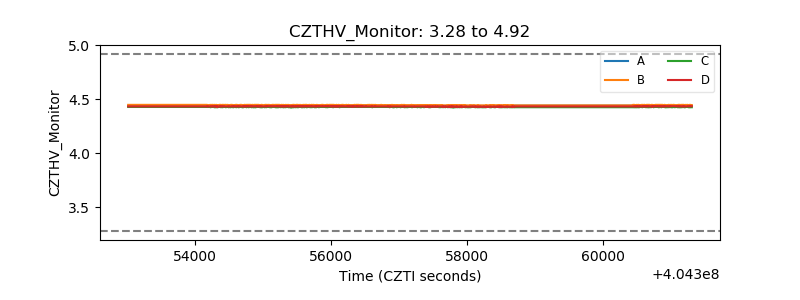 |
| D_VDD | 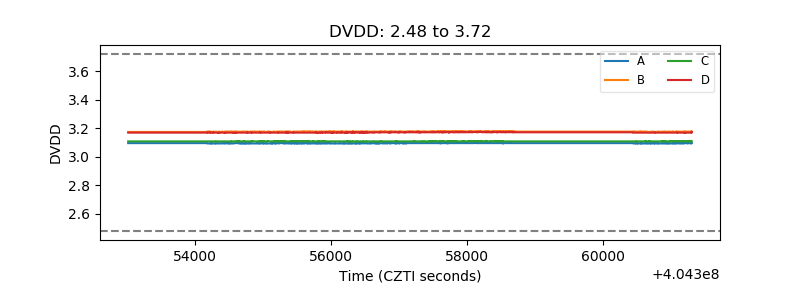 |
| Temperature 1 | 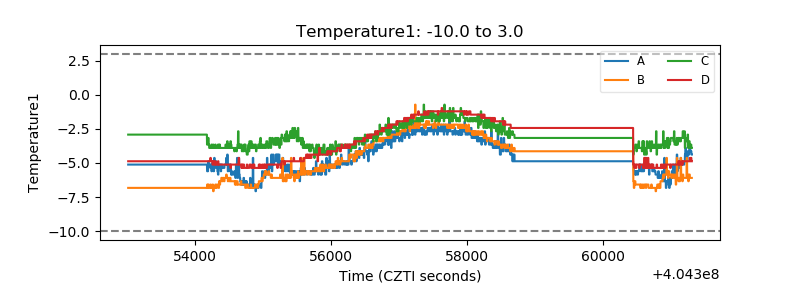 |
| Veto HV Monitor |  |
| Veto LLD | 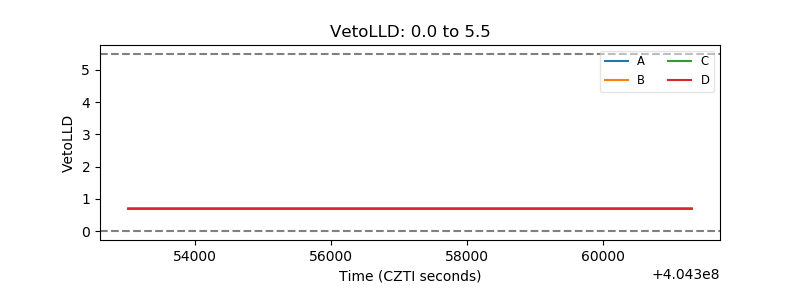 |
| Alpha Counter | 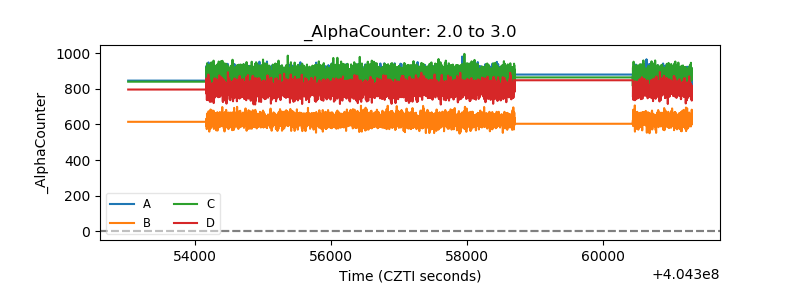 |
| _CPM_Rate | 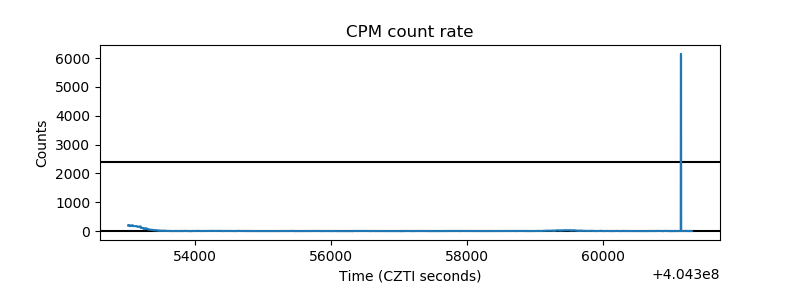 |
| CZT Counter | 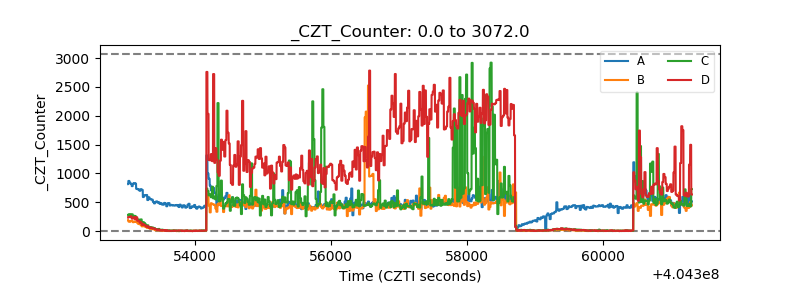 |
| +2.5 Volts monitor | 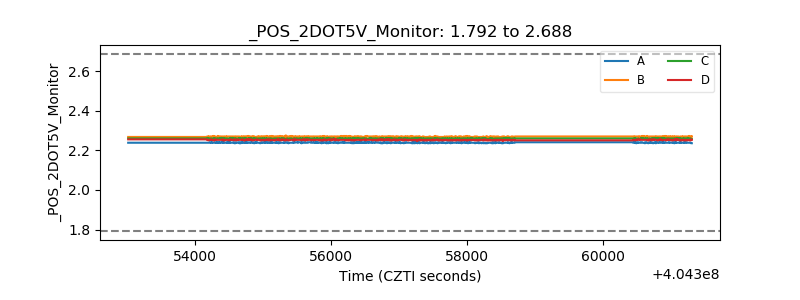 |
| +5 Volts monitor | 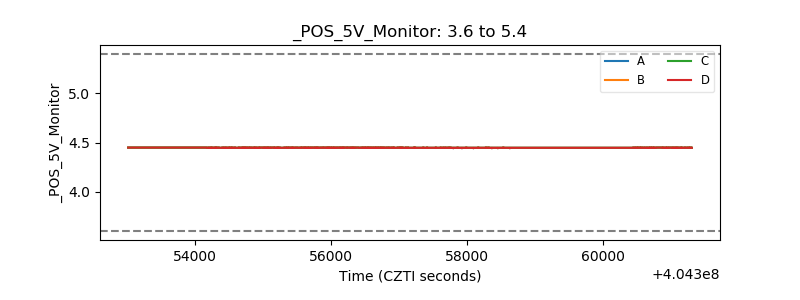 |
| _ROLL_ROT | 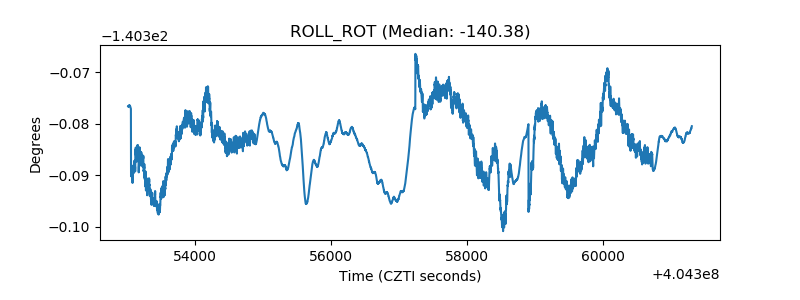 |
| _Roll_DEC | 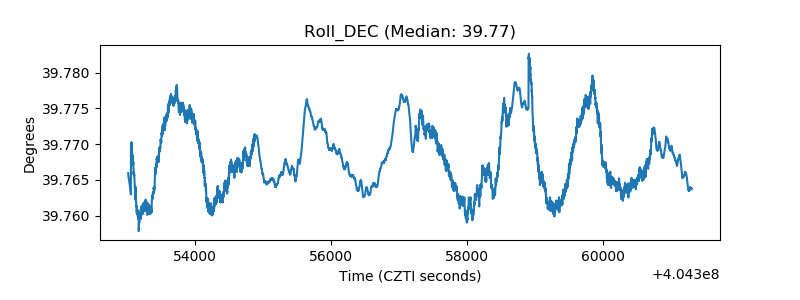 |
| _Roll_RA | 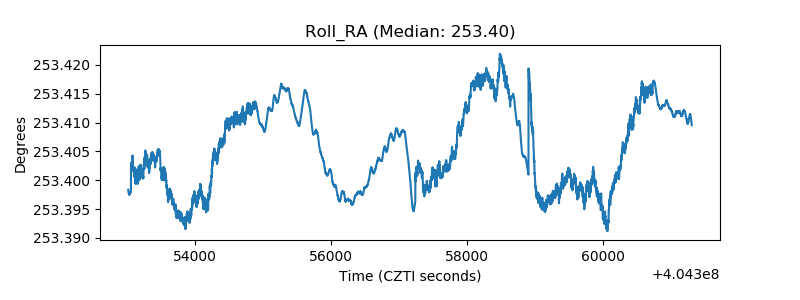 |
| Veto Counter | 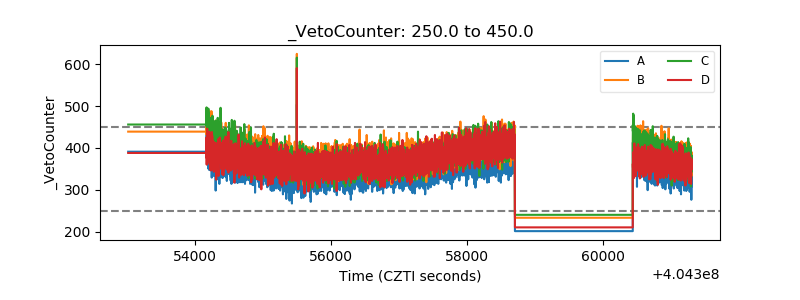 |