| Param | Original file | Final file |
|---|---|---|
| Filename | modeM0/AS1A07_145T01_9000005370_38249cztM0_level2.fits | modeM0/AS1A07_145T01_9000005370_38249cztM0_level2_quad_clean.evt |
| Size (bytes) | 519,189,120 | 95,132,160 |
| Size | 495.1 MB | 90.7 MB |
| Events in quadrant A | 3,214,841 | 661,475 |
| Events in quadrant B | 2,904,937 | 676,365 |
| Events in quadrant C | 3,974,001 | 640,710 |
| Events in quadrant D | 8,667,977 | 490,456 |
| Mode M9 | |||
|---|---|---|---|
| Quadrant | BADHDUFLAG | Total packets | Discarded packets |
| A | 0 | 32 | 0 |
| B | 0 | 32 | 0 |
| C | 0 | 32 | 0 |
| D | 0 | 32 | 0 |
| Mode SS | |||
|---|---|---|---|
| Quadrant | BADHDUFLAG | Total packets | Discarded packets |
| A | 0 | 120 | 0 |
| B | 0 | 120 | 0 |
| C | 0 | 120 | 0 |
| D | 0 | 120 | 0 |
| Mode M0 | |||
|---|---|---|---|
| Quadrant | BADHDUFLAG | Total packets | Discarded packets |
| A | 0 | 13148 | 3 |
| B | 0 | 12623 | 2 |
| C | 0 | 15525 | 2 |
| D | 0 | 29941 | 2 |
| Quadrant | Total seconds | Saturated seconds | Saturation percentage |
|---|---|---|---|
| A | 5891 | 16 | 0.271601% |
| B | 5891 | 58 | 0.984553% |
| C | 5891 | 148 | 2.512307% |
| D | 5891 | 1367 | 23.204889% |
Noise dominated data is calculated using 1-second bins in cleaned event files. If a bin has >2000 counts, and if more than 50% of those come from <1% of pixels, then it is considered to be noise-dominated and hence unusable.
| Quadrant | # 1 sec bins | Bins with >0 counts | Bins with >2000 counts | High rate bins dominated by noise | Noise dominated (total time) | Noise dominated (detector-on time) | Marked lightcurve |
|---|---|---|---|---|---|---|---|
| A | 9056 | 5893 | 7 | 7 | 0.08% | 0.12% | 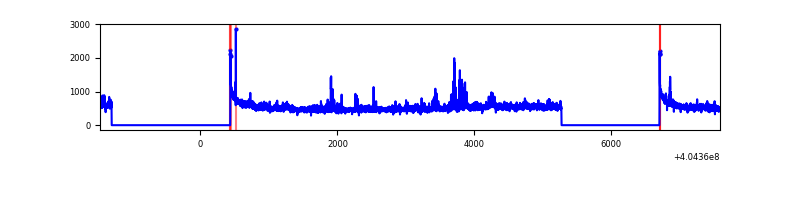 |
| B | 9056 | 5893 | 33 | 33 | 0.36% | 0.56% | 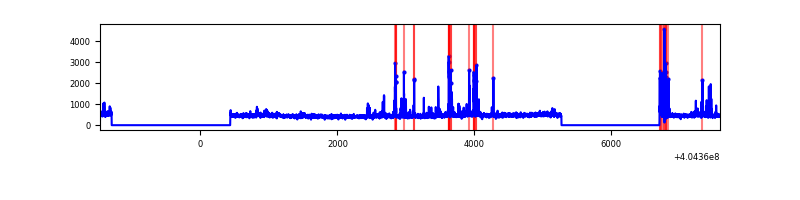 |
| C | 9056 | 5893 | 131 | 131 | 1.45% | 2.22% | 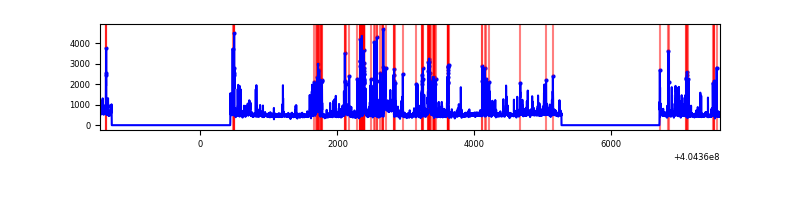 |
| D | 9056 | 5893 | 1498 | 1498 | 16.54% | 25.42% | 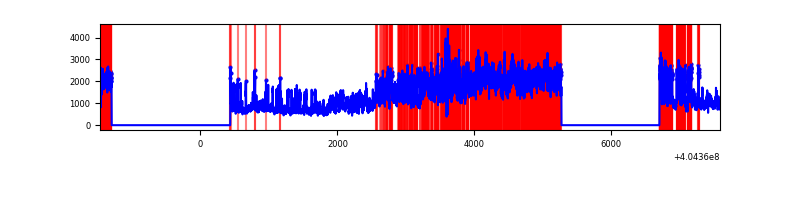 |
Top three noisy pixels from each quadrant. If the there are fewer than three noisy pixels in the level2.evt file, extra rows are filled as -1
| Pixel properties | Quadrant properties | ||||||
|---|---|---|---|---|---|---|---|
| Quadrant | DetID | PixID | Counts | Sigma | Mean | Median | Sigma |
| A | 10 | 83 | 411906 | 3081.15 | 659 | 647 | 133.5 |
| A | 12 | 189 | 118977 | 886.53 | 659 | 647 | 133.5 |
| A | 12 | 16 | 86000 | 639.46 | 659 | 647 | 133.5 |
| B | 5 | 172 | 170538 | 1327.82 | 654 | 637 | 128.0 |
| B | 15 | 85 | 62786 | 485.71 | 654 | 637 | 128.0 |
| B | 0 | 229 | 46830 | 361.01 | 654 | 637 | 128.0 |
| C | 9 | 236 | 723953 | 4865.26 | 638 | 642 | 148.7 |
| C | 15 | 208 | 297129 | 1994.28 | 638 | 642 | 148.7 |
| C | 15 | 214 | 248202 | 1665.18 | 638 | 642 | 148.7 |
| D | 12 | 235 | 3375682 | 22640.91 | 605 | 586 | 149.1 |
| D | 10 | 203 | 2651786 | 17784.85 | 605 | 586 | 149.1 |
| D | 1 | 47 | 104128 | 694.58 | 605 | 586 | 149.1 |
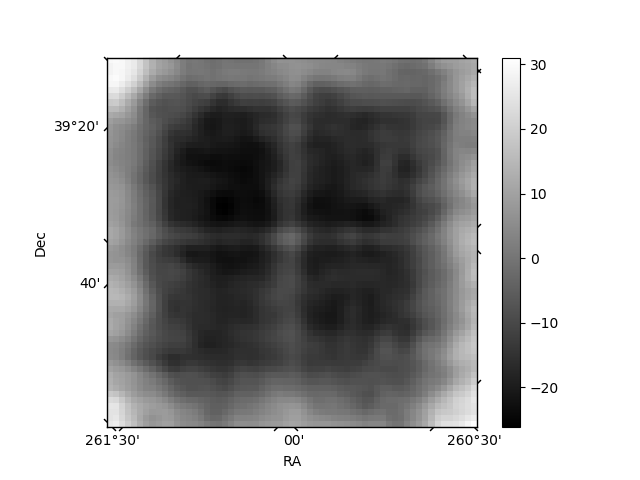
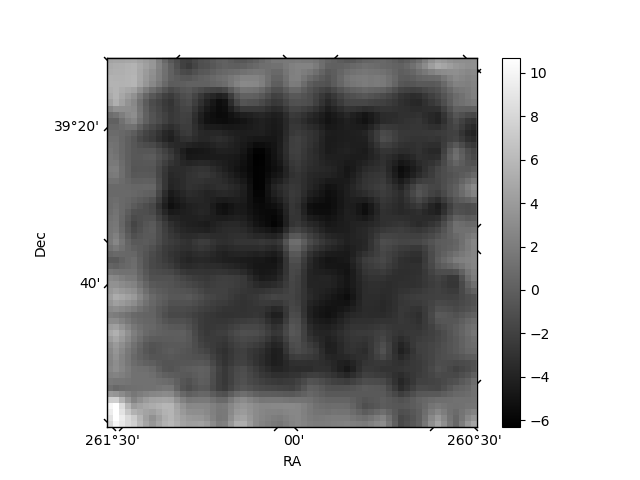
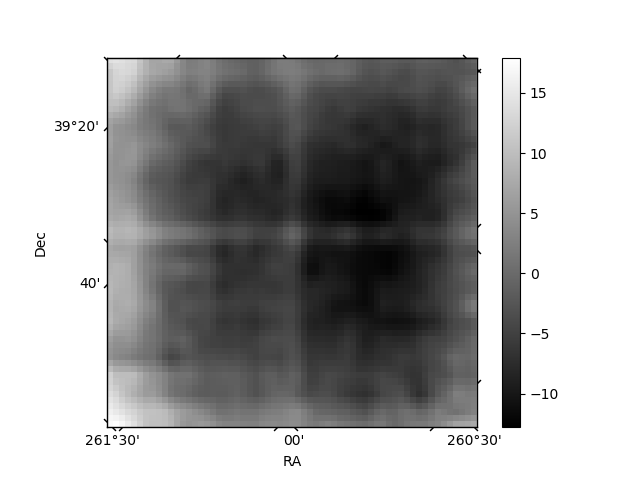
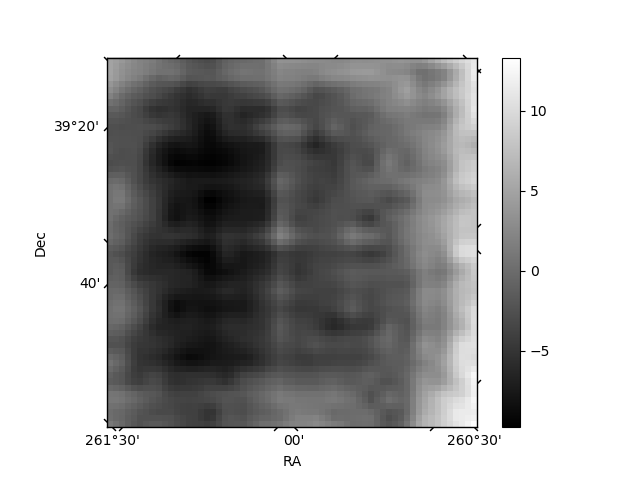
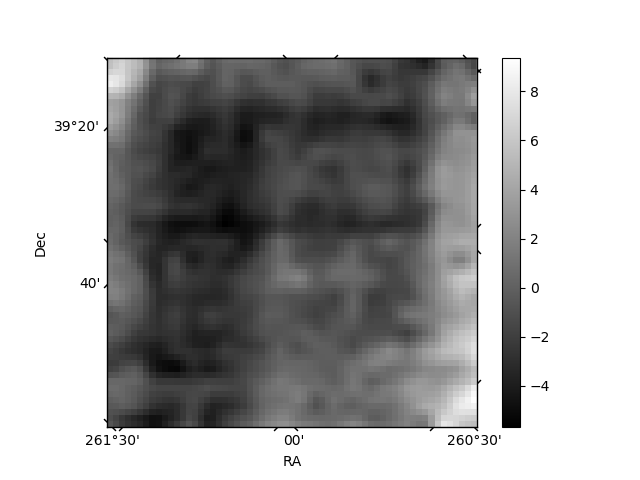
Histogram calculated using DETX and DETY for each event in the final _common_clean file
| Quadrant A | 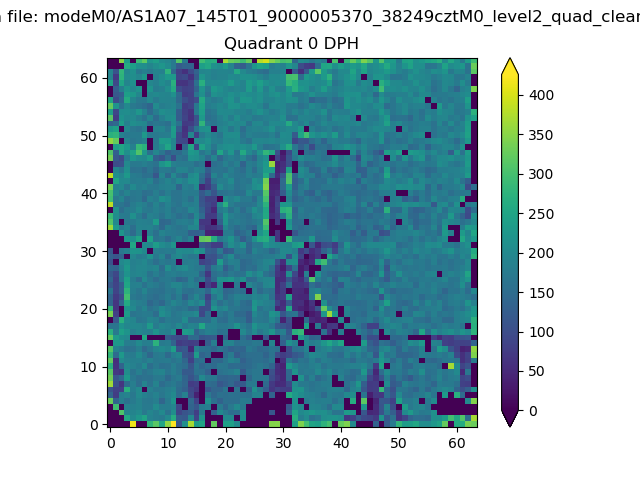 |
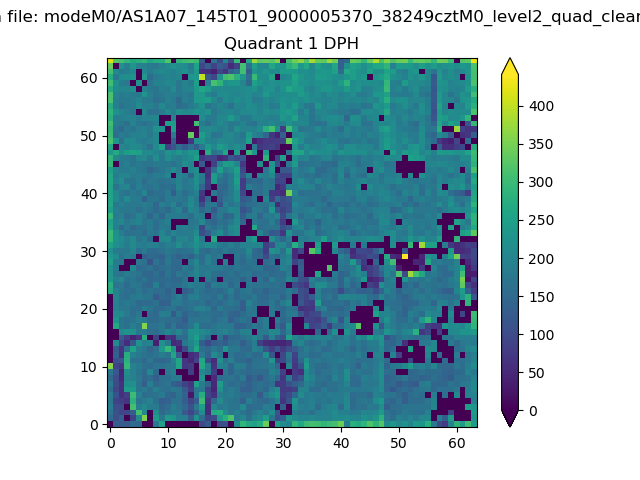 |
Quadrant B |
|---|---|---|---|
| Quadrant D | 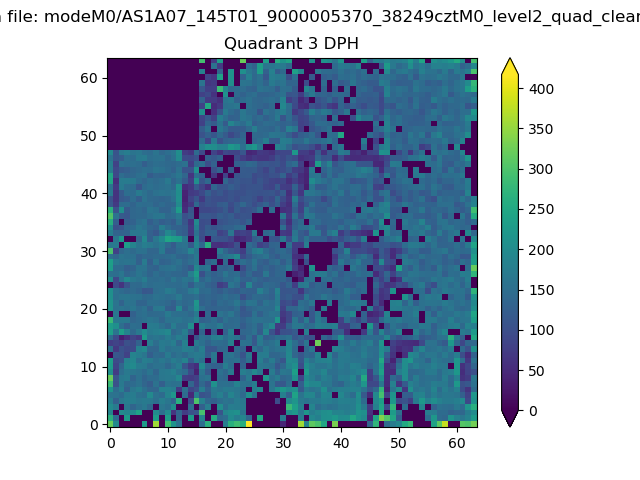 |
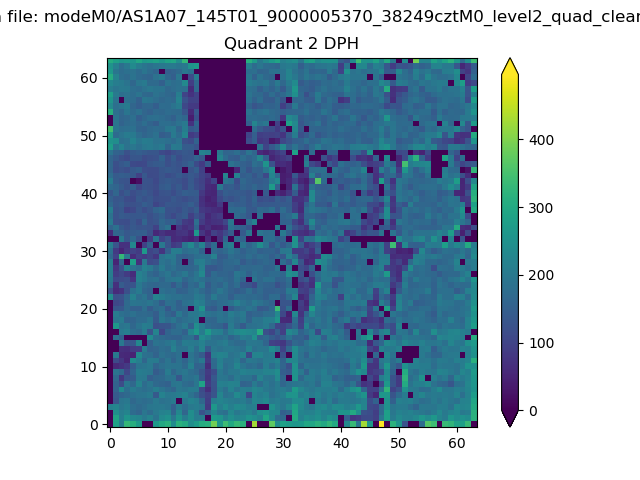 |
Quadrant C |
| Plot type | Count rate plots | Images |
|---|---|---|
| Comparison with Poisson distribution Blue bars denote a histogram of data divided into 1 sec bins. Red curve is a Poisson curve with rate = median count rate of data. |
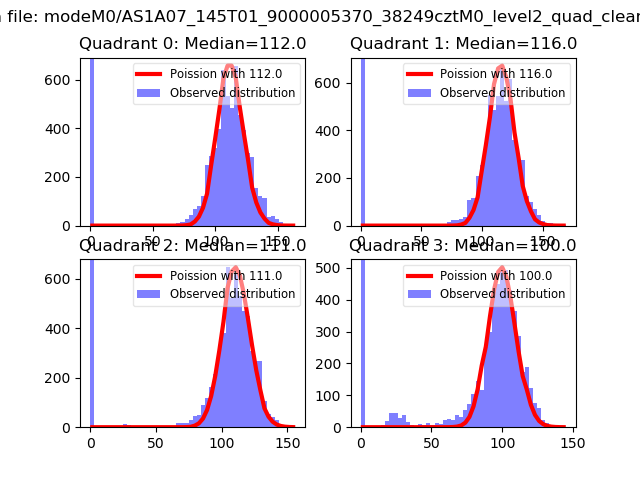 |
 |
| Quadrant-wise count rates Data is divided into 100 sec bins |
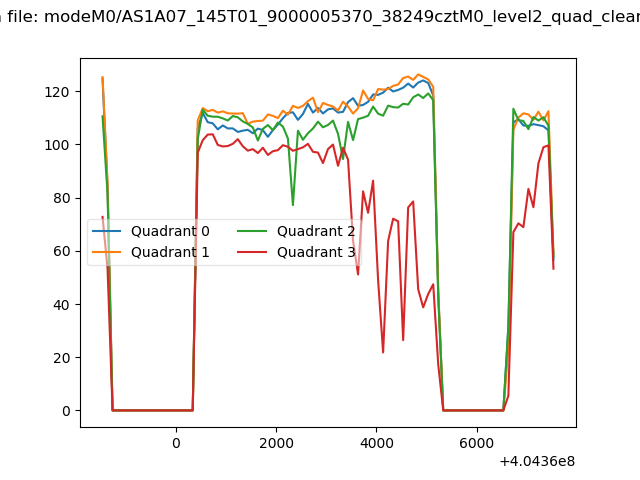 |
|
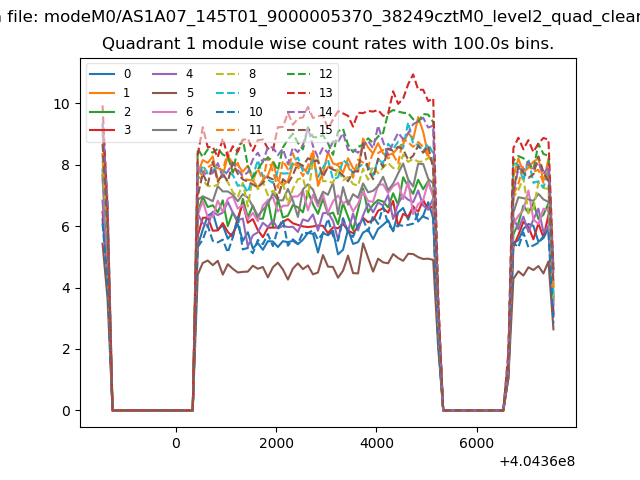
| Module-wise count rates for Quadrant A Data is divided into 100 sec bins |
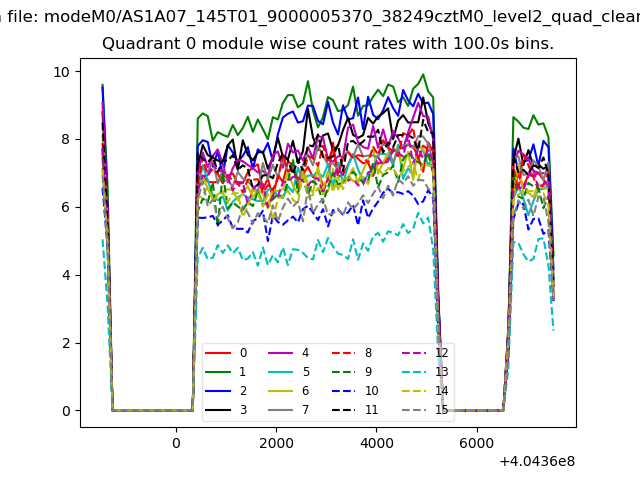 |
 |
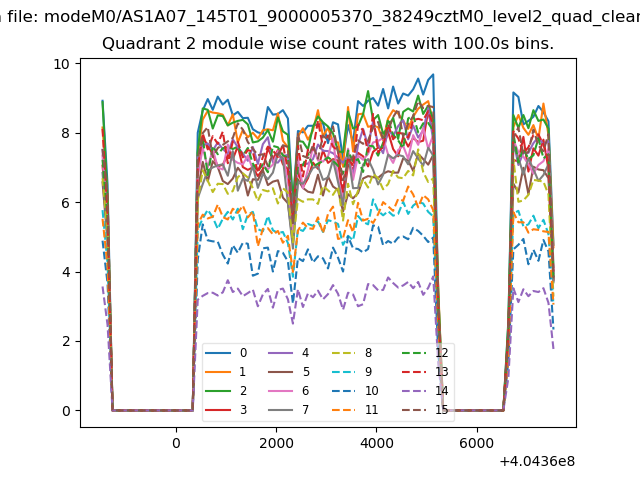
| Module-wise count rates for Quadrant B Data is divided into 100 sec bins |
 |
 |
| Module-wise count rates for Quadrant C Data is divided into 100 sec bins |
 |
 |
| Module-wise count rates for Quadrant D Data is divided into 100 sec bins |
 |
 |
| Parameter | Plot |
|---|---|
| CZT HV Monitor | 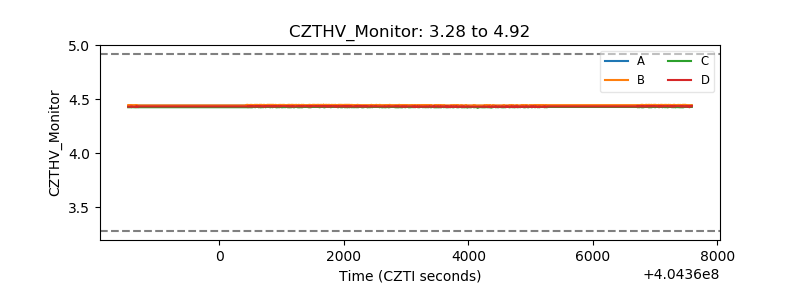 |
| D_VDD | 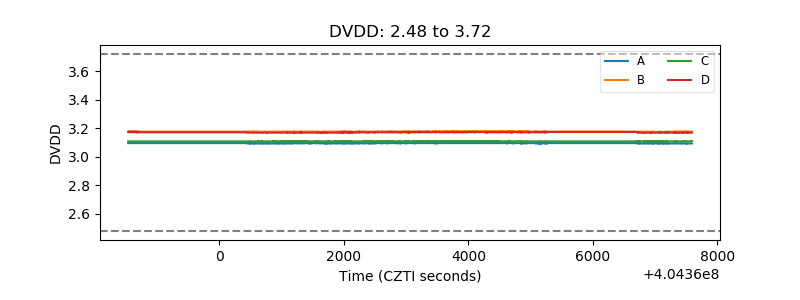 |
| Temperature 1 | 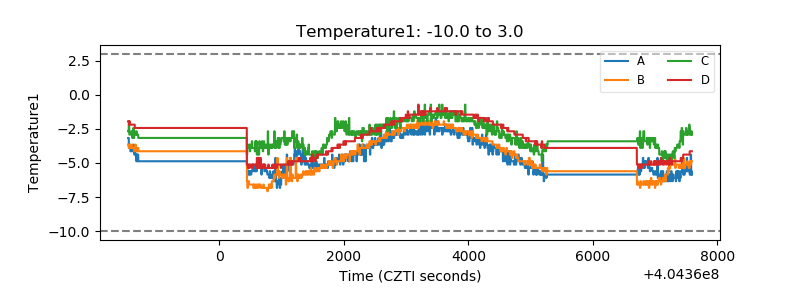 |
| Veto HV Monitor | 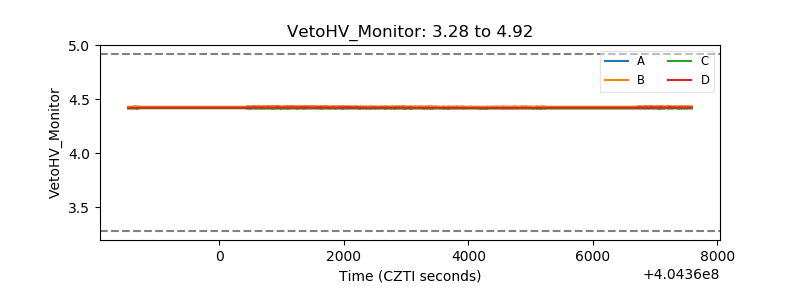 |
| Veto LLD | 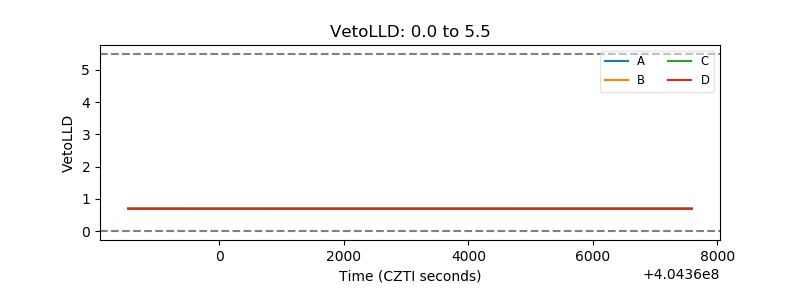 |
| Alpha Counter | 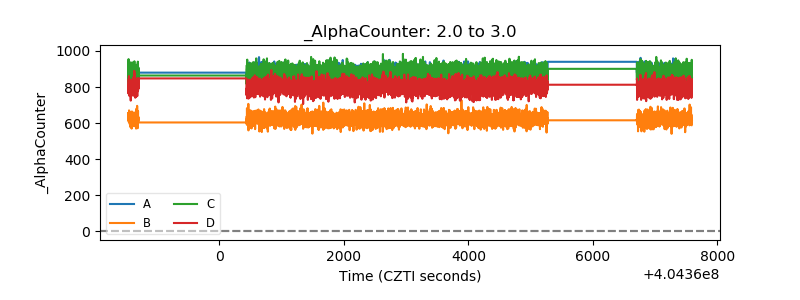 |
| _CPM_Rate | 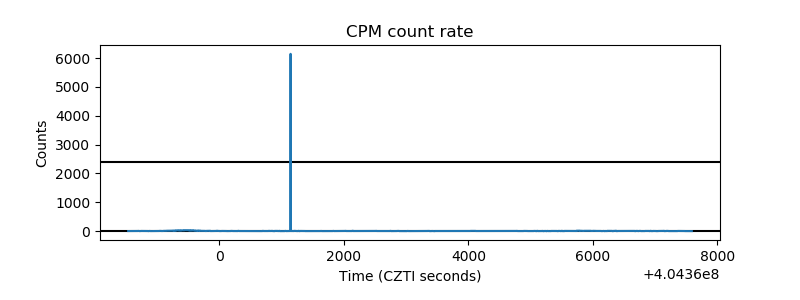 |
| CZT Counter | 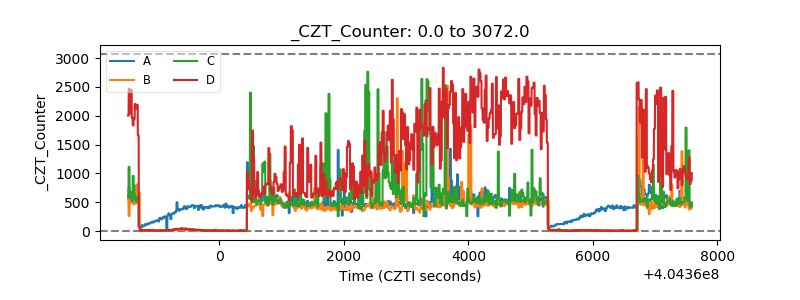 |
| +2.5 Volts monitor | 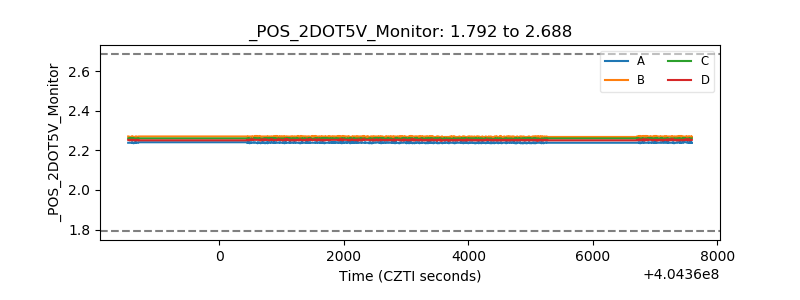 |
| +5 Volts monitor | 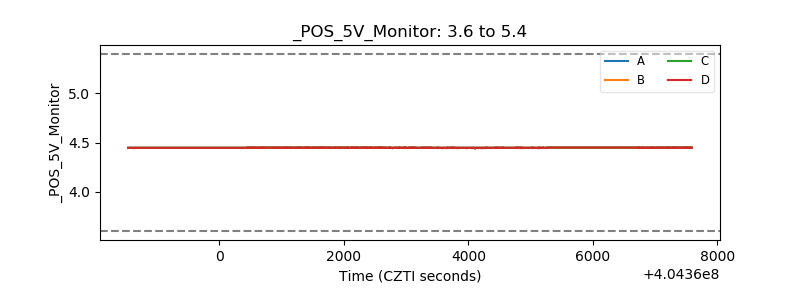 |
| _ROLL_ROT | 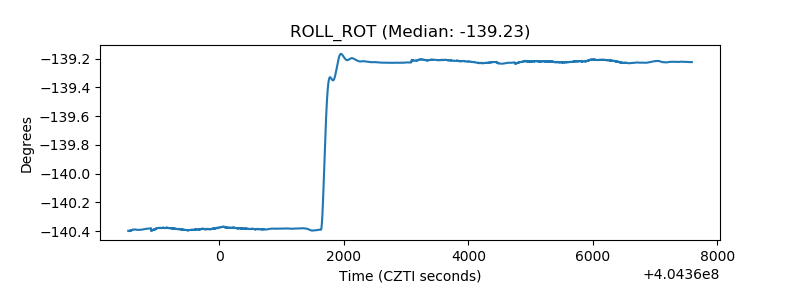 |
| _Roll_DEC | 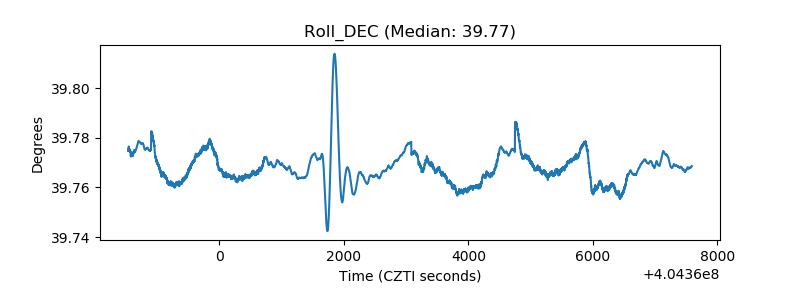 |
| _Roll_RA | 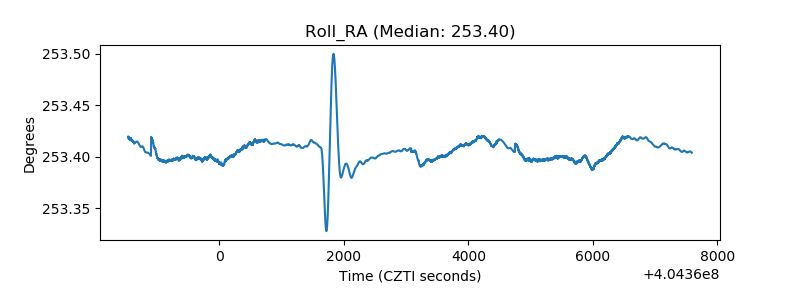 |
| Veto Counter | 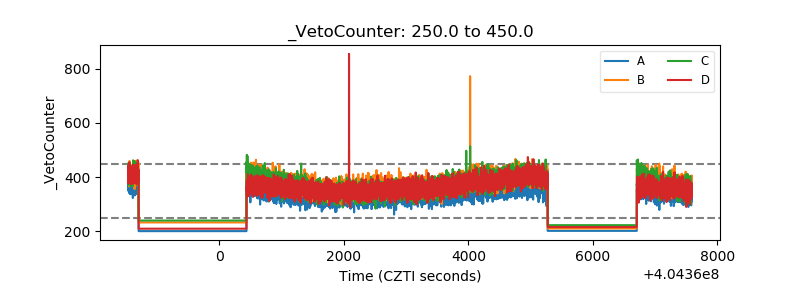 |