| Param | Original file | Final file |
|---|---|---|
| Filename | modeM0/AS1A07_145T01_9000005370_38250cztM0_level2.fits | modeM0/AS1A07_145T01_9000005370_38250cztM0_level2_quad_clean.evt |
| Size (bytes) | 520,364,160 | 94,800,960 |
| Size | 496.3 MB | 90.4 MB |
| Events in quadrant A | 3,739,742 | 665,595 |
| Events in quadrant B | 2,943,092 | 680,933 |
| Events in quadrant C | 3,068,060 | 651,585 |
| Events in quadrant D | 9,049,222 | 455,958 |
| Mode M9 | |||
|---|---|---|---|
| Quadrant | BADHDUFLAG | Total packets | Discarded packets |
| A | 0 | 16 | 0 |
| B | 0 | 16 | 0 |
| C | 0 | 16 | 0 |
| D | 0 | 17 | 0 |
| Mode SS | |||
|---|---|---|---|
| Quadrant | BADHDUFLAG | Total packets | Discarded packets |
| A | 0 | 122 | 0 |
| B | 0 | 122 | 0 |
| C | 0 | 122 | 0 |
| D | 0 | 122 | 0 |
| Mode M0 | |||
|---|---|---|---|
| Quadrant | BADHDUFLAG | Total packets | Discarded packets |
| A | 0 | 14885 | 3 |
| B | 0 | 12738 | 2 |
| C | 0 | 12793 | 2 |
| D | 0 | 31138 | 2 |
| Quadrant | Total seconds | Saturated seconds | Saturation percentage |
|---|---|---|---|
| A | 5952 | 55 | 0.924059% |
| B | 5952 | 48 | 0.806452% |
| C | 5952 | 44 | 0.739247% |
| D | 5952 | 1728 | 29.032258% |
Noise dominated data is calculated using 1-second bins in cleaned event files. If a bin has >2000 counts, and if more than 50% of those come from <1% of pixels, then it is considered to be noise-dominated and hence unusable.
| Quadrant | # 1 sec bins | Bins with >0 counts | Bins with >2000 counts | High rate bins dominated by noise | Noise dominated (total time) | Noise dominated (detector-on time) | Marked lightcurve |
|---|---|---|---|---|---|---|---|
| A | 7236 | 5953 | 57 | 57 | 0.79% | 0.96% | 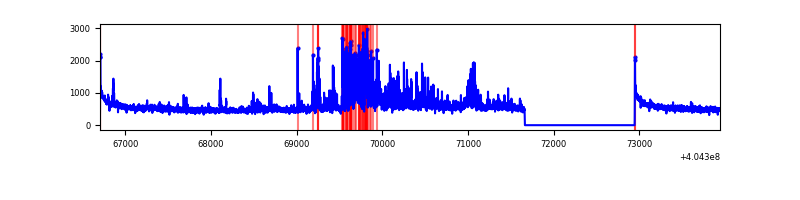 |
| B | 7236 | 5953 | 14 | 14 | 0.19% | 0.24% | 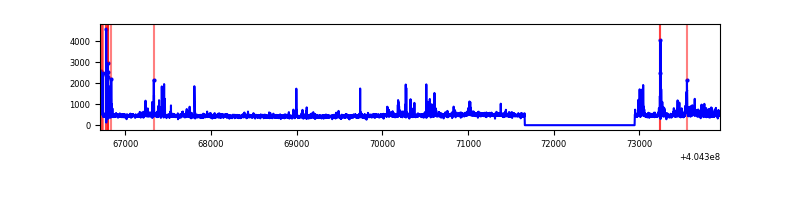 |
| C | 7236 | 5953 | 27 | 27 | 0.37% | 0.45% | 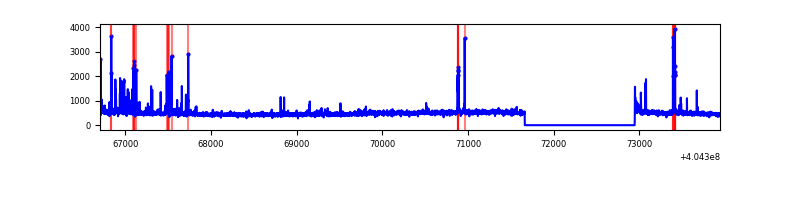 |
| D | 7236 | 5953 | 1831 | 1831 | 25.30% | 30.76% | 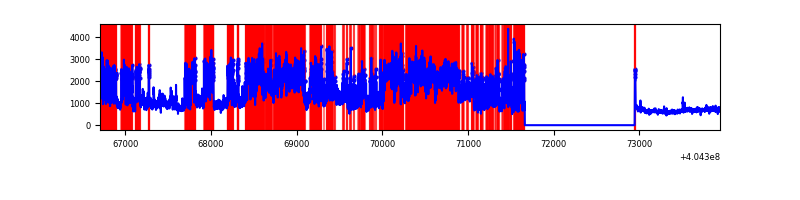 |
Top three noisy pixels from each quadrant. If the there are fewer than three noisy pixels in the level2.evt file, extra rows are filled as -1
| Pixel properties | Quadrant properties | ||||||
|---|---|---|---|---|---|---|---|
| Quadrant | DetID | PixID | Counts | Sigma | Mean | Median | Sigma |
| A | 12 | 16 | 551008 | 4084.2 | 663 | 649 | 134.8 |
| A | 10 | 83 | 398857 | 2955.09 | 663 | 649 | 134.8 |
| A | 12 | 189 | 99988 | 737.19 | 663 | 649 | 134.8 |
| B | 5 | 172 | 252663 | 1970.24 | 659 | 642 | 127.9 |
| B | 5 | 184 | 41521 | 319.58 | 659 | 642 | 127.9 |
| B | 0 | 230 | 21571 | 163.62 | 659 | 642 | 127.9 |
| C | 15 | 214 | 250245 | 1639.61 | 645 | 650 | 152.2 |
| C | 14 | 254 | 174603 | 1142.71 | 645 | 650 | 152.2 |
| C | 9 | 236 | 80571 | 525.01 | 645 | 650 | 152.2 |
| D | 12 | 235 | 3312957 | 22702.84 | 595 | 578 | 145.9 |
| D | 10 | 203 | 2915026 | 19975.45 | 595 | 578 | 145.9 |
| D | 2 | 250 | 199663 | 1364.52 | 595 | 578 | 145.9 |
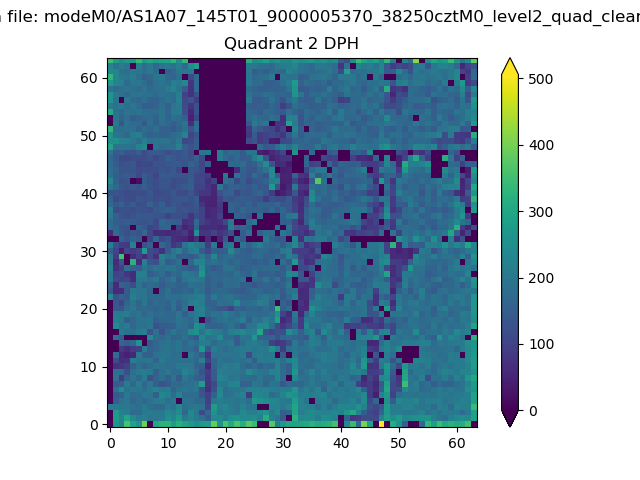
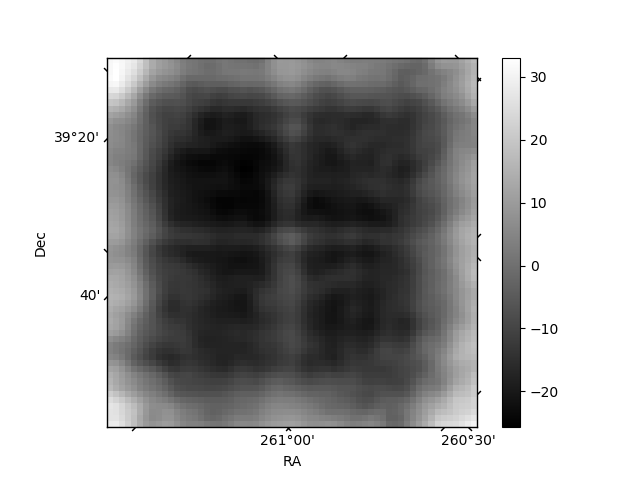
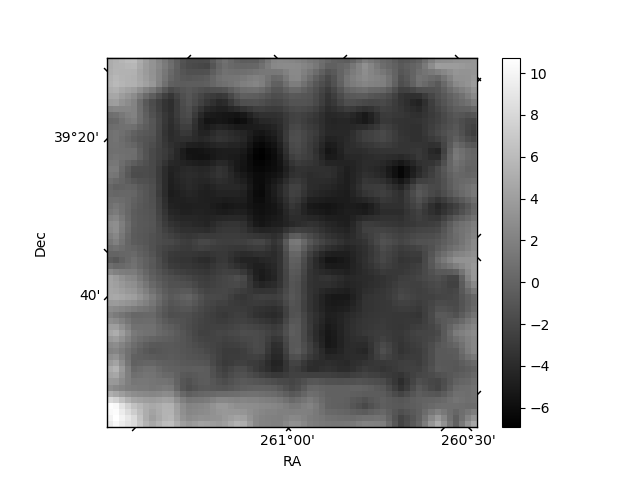
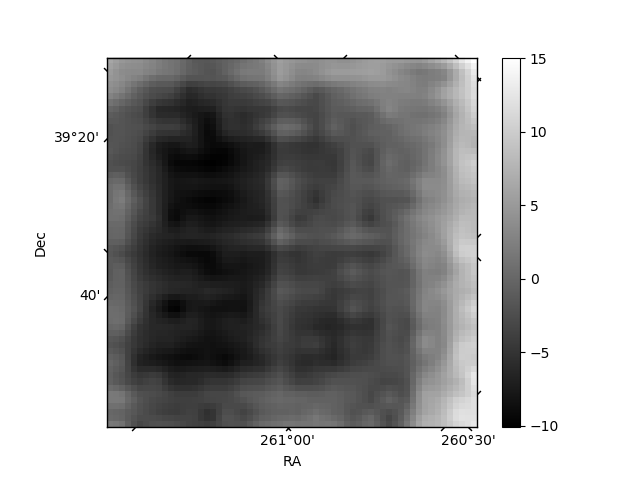
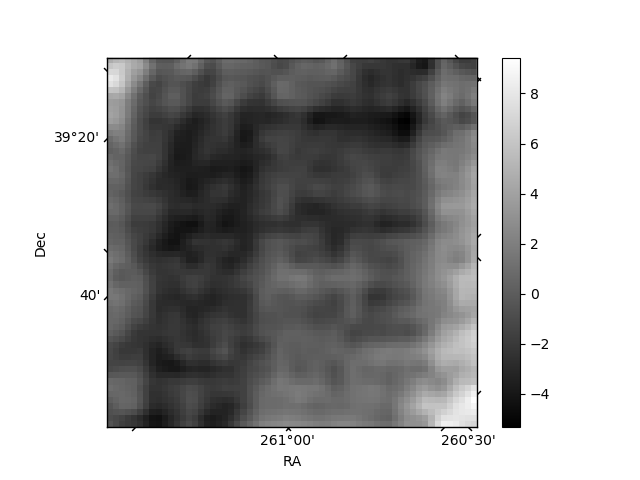
Histogram calculated using DETX and DETY for each event in the final _common_clean file
| Quadrant A | 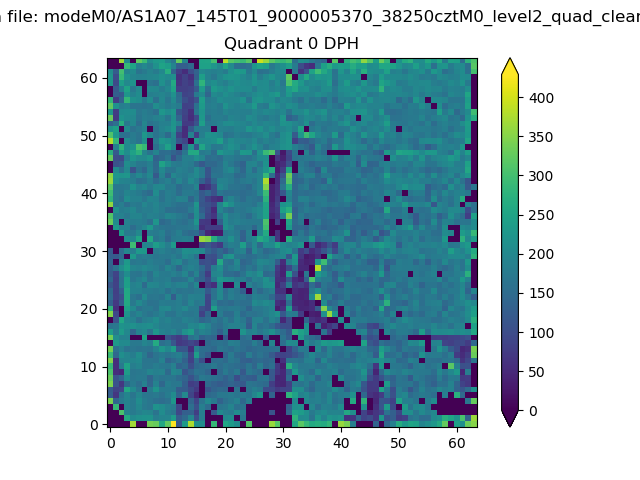 |
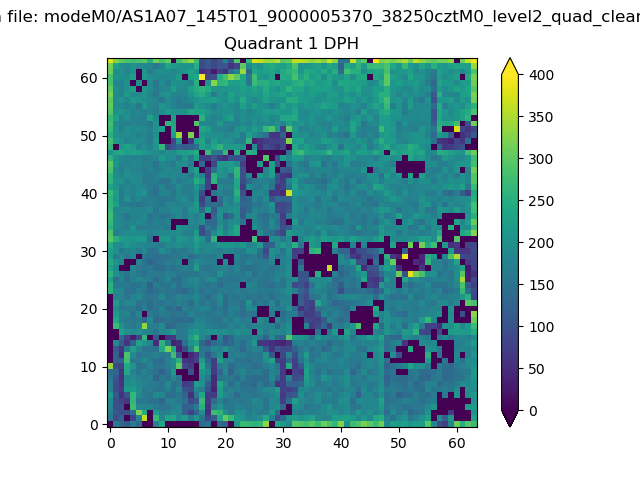 |
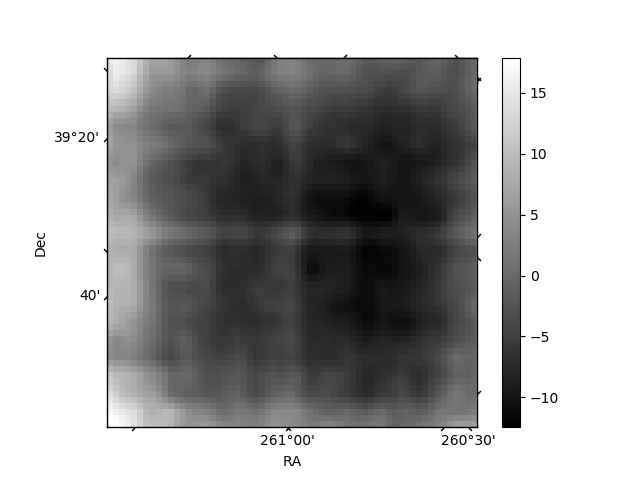
Quadrant B |
|---|---|---|---|
| Quadrant D | 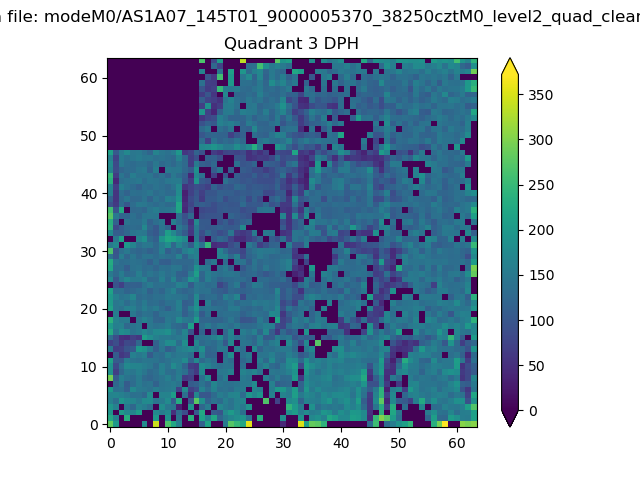 |
 |
Quadrant C |
| Plot type | Count rate plots | Images |
|---|---|---|
| Comparison with Poisson distribution Blue bars denote a histogram of data divided into 1 sec bins. Red curve is a Poisson curve with rate = median count rate of data. |
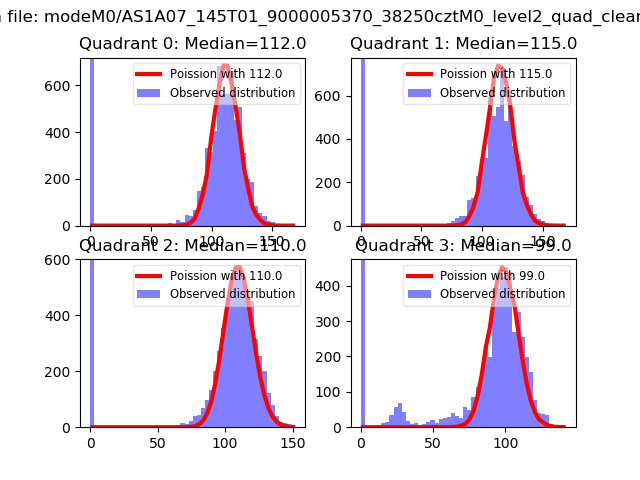 |
 |
| Quadrant-wise count rates Data is divided into 100 sec bins |
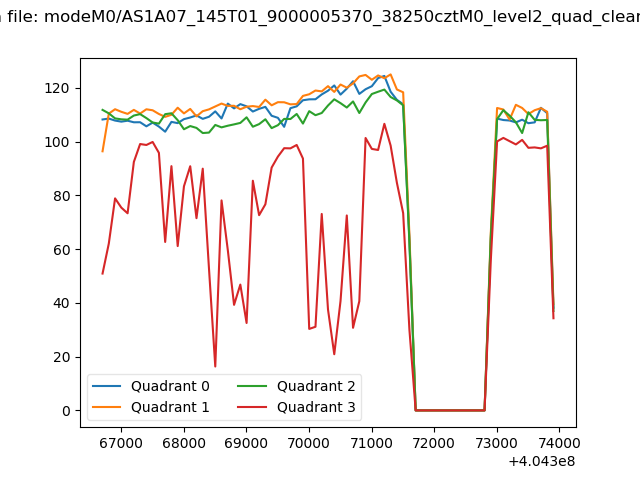 |
|
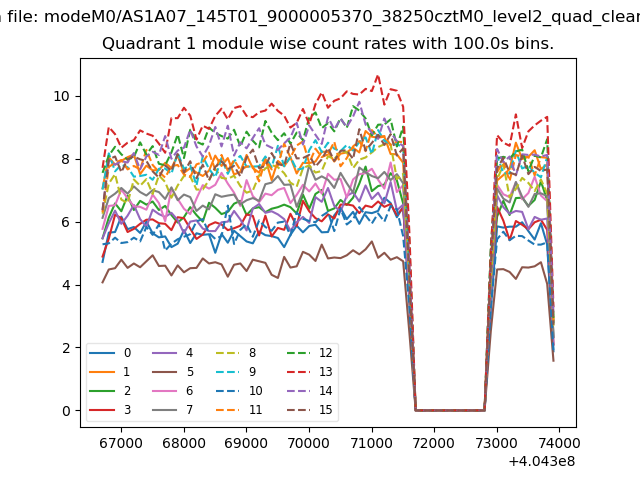
| Module-wise count rates for Quadrant A Data is divided into 100 sec bins |
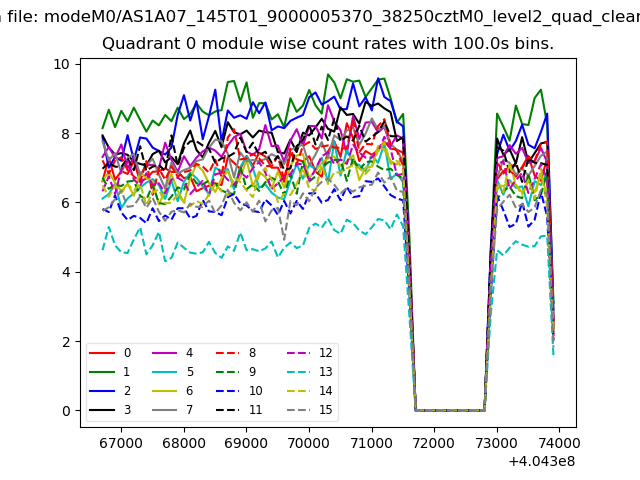 |
 |
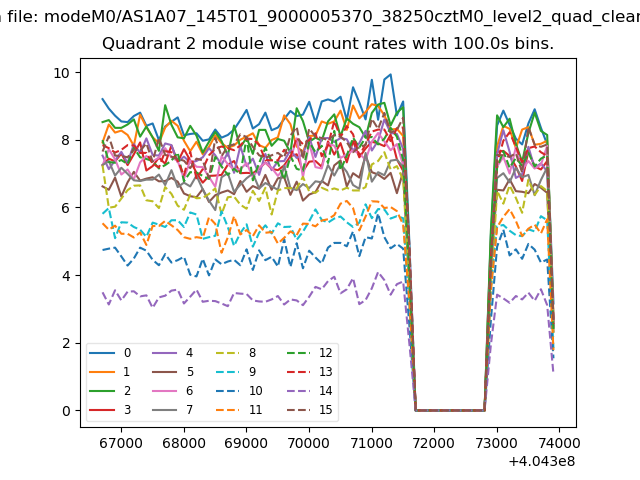
| Module-wise count rates for Quadrant B Data is divided into 100 sec bins |
 |
 |
| Module-wise count rates for Quadrant C Data is divided into 100 sec bins |
 |
 |
| Module-wise count rates for Quadrant D Data is divided into 100 sec bins |
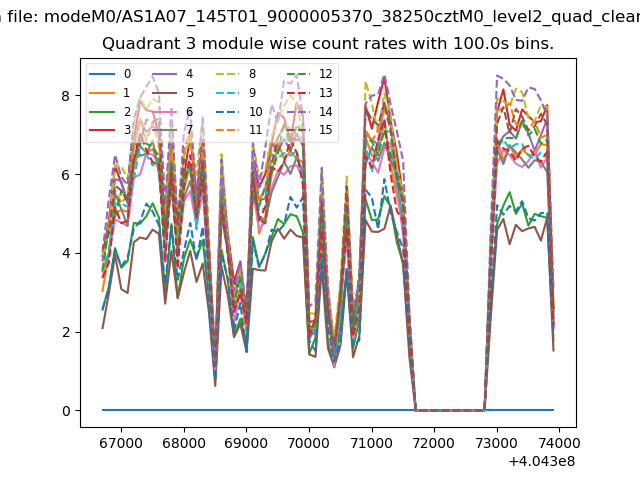 |
 |
| Parameter | Plot |
|---|---|
| CZT HV Monitor | 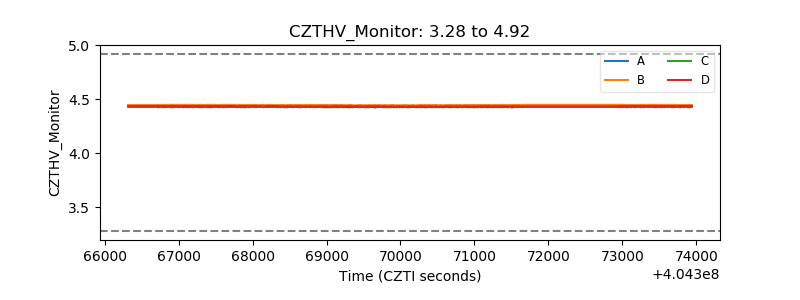 |
| D_VDD | 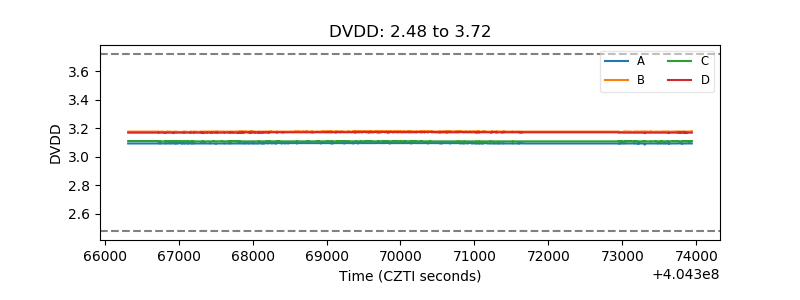 |
| Temperature 1 | 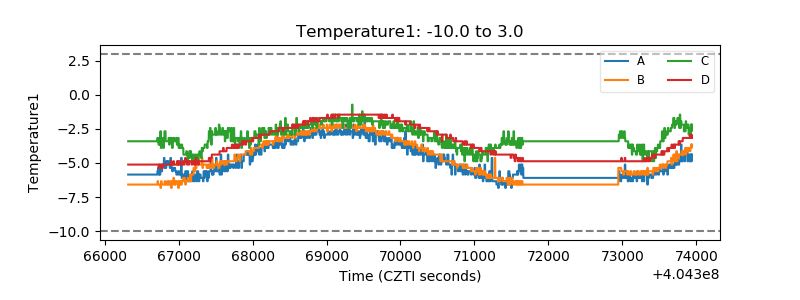 |
| Veto HV Monitor | 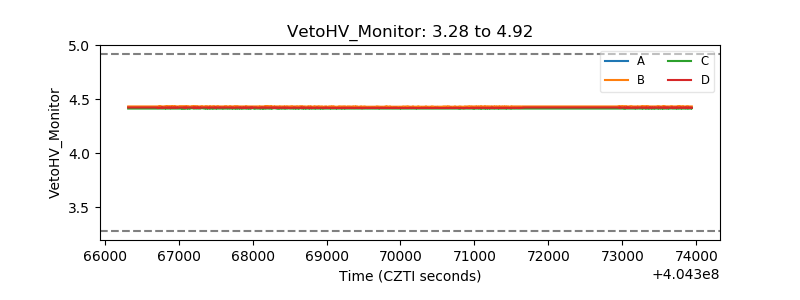 |
| Veto LLD | 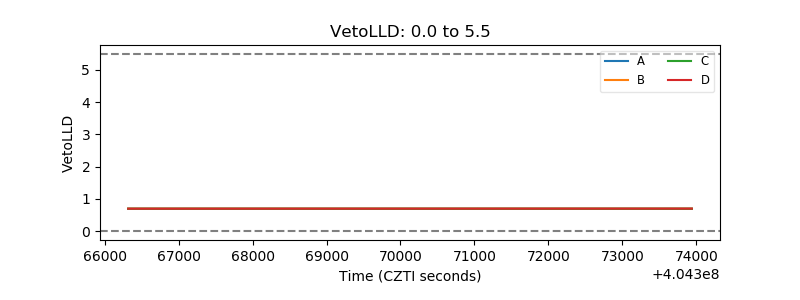 |
| Alpha Counter | 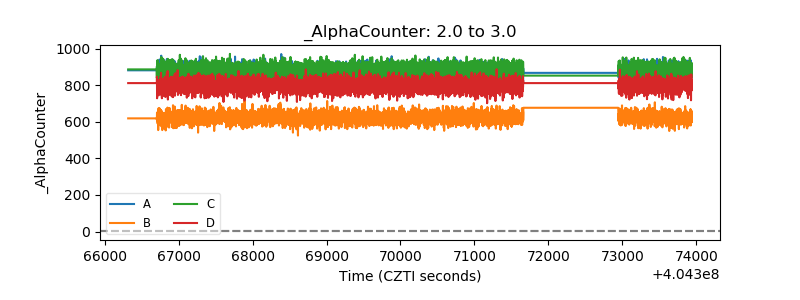 |
| _CPM_Rate | 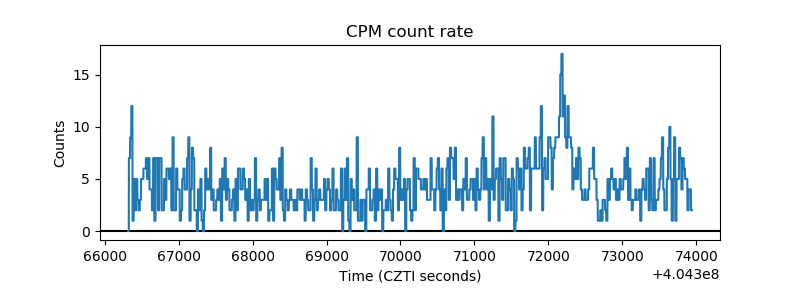 |
| CZT Counter | 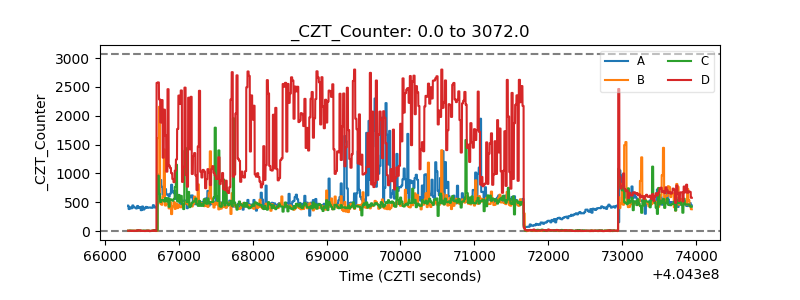 |
| +2.5 Volts monitor | 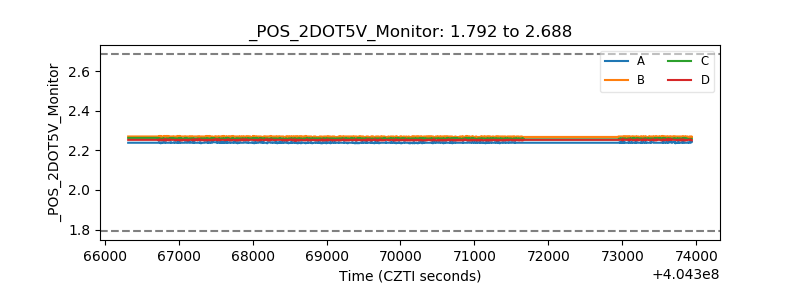 |
| +5 Volts monitor | 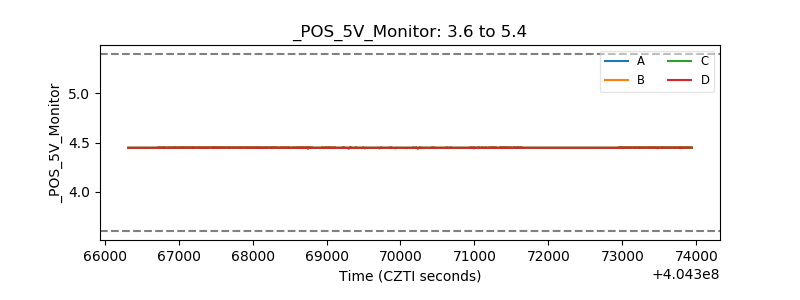 |
| _ROLL_ROT | 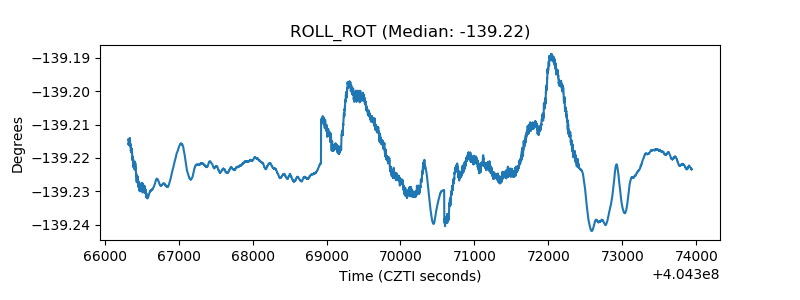 |
| _Roll_DEC | 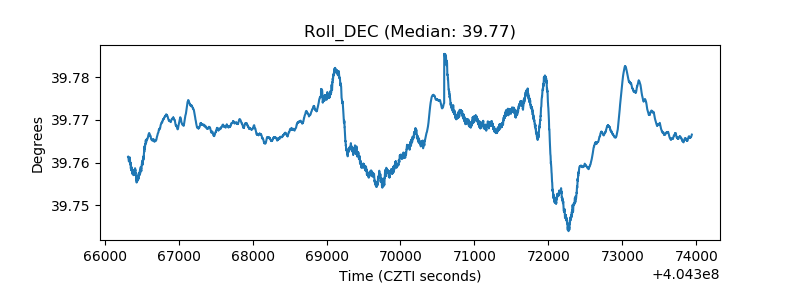 |
| _Roll_RA | 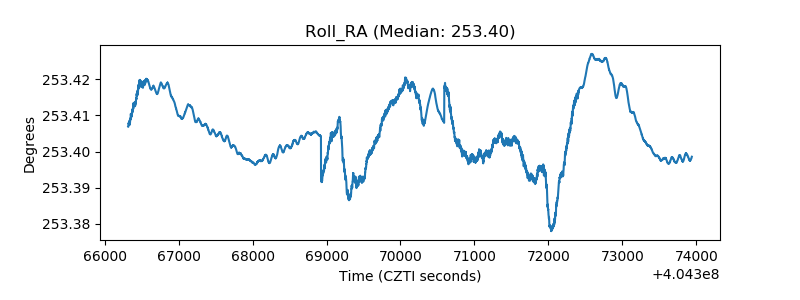 |
| Veto Counter | 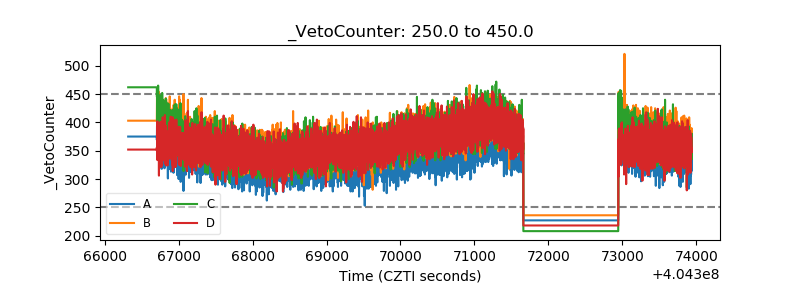 |