| Param | Original file | Final file |
|---|---|---|
| Filename | modeM0/AS1A07_145T01_9000005370_38253cztM0_level2.fits | modeM0/AS1A07_145T01_9000005370_38253cztM0_level2_quad_clean.evt |
| Size (bytes) | 1,202,725,440 | 257,169,600 |
| Size | 1.1 GB | 245.3 MB |
| Events in quadrant A | 8,782,501 | 1,747,066 |
| Events in quadrant B | 7,468,027 | 1,784,187 |
| Events in quadrant C | 8,002,051 | 1,688,604 |
| Events in quadrant D | 19,062,545 | 1,488,784 |
| Mode M9 | |||
|---|---|---|---|
| Quadrant | BADHDUFLAG | Total packets | Discarded packets |
| A | 0 | 42 | 0 |
| B | 0 | 42 | 0 |
| C | 0 | 42 | 0 |
| D | 0 | 42 | 0 |
| Mode SS | |||
|---|---|---|---|
| Quadrant | BADHDUFLAG | Total packets | Discarded packets |
| A | 0 | 318 | 0 |
| B | 0 | 318 | 0 |
| C | 0 | 318 | 0 |
| D | 0 | 318 | 0 |
| Mode M0 | |||
|---|---|---|---|
| Quadrant | BADHDUFLAG | Total packets | Discarded packets |
| A | 0 | 35727 | 5 |
| B | 0 | 32871 | 4 |
| C | 0 | 33566 | 4 |
| D | 0 | 67613 | 4 |
| Quadrant | Total seconds | Saturated seconds | Saturation percentage |
|---|---|---|---|
| A | 15623 | 36 | 0.230429% |
| B | 15623 | 101 | 0.646483% |
| C | 15623 | 62 | 0.396851% |
| D | 15623 | 1140 | 7.296934% |
Noise dominated data is calculated using 1-second bins in cleaned event files. If a bin has >2000 counts, and if more than 50% of those come from <1% of pixels, then it is considered to be noise-dominated and hence unusable.
| Quadrant | # 1 sec bins | Bins with >0 counts | Bins with >2000 counts | High rate bins dominated by noise | Noise dominated (total time) | Noise dominated (detector-on time) | Marked lightcurve |
|---|---|---|---|---|---|---|---|
| A | 19802 | 15626 | 15 | 15 | 0.08% | 0.10% | 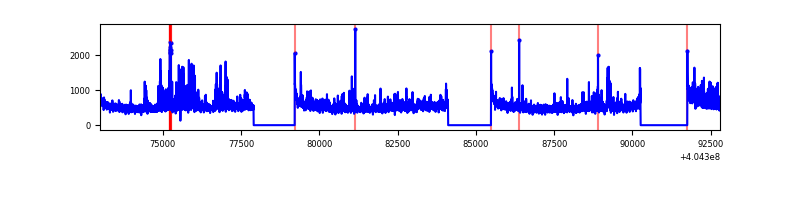 |
| B | 19802 | 15625 | 50 | 50 | 0.25% | 0.32% | 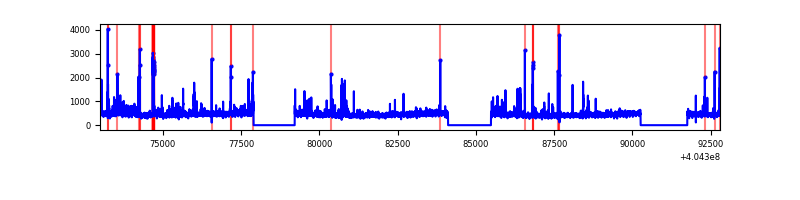 |
| C | 19802 | 15625 | 34 | 34 | 0.17% | 0.22% | 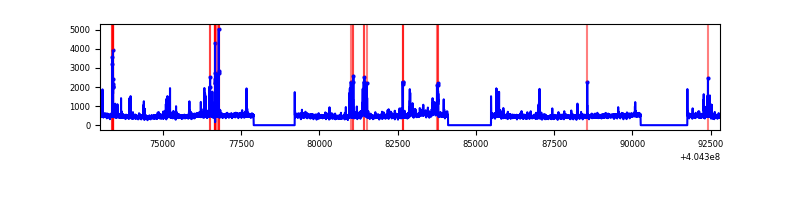 |
| D | 19802 | 15625 | 1222 | 1222 | 6.17% | 7.82% | 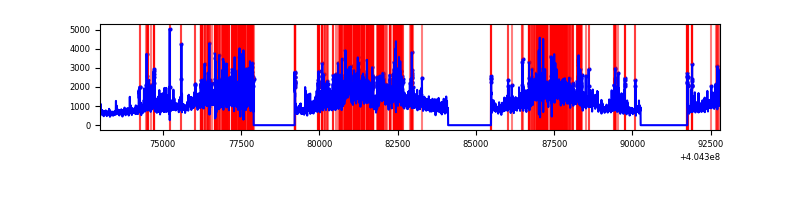 |
Top three noisy pixels from each quadrant. If the there are fewer than three noisy pixels in the level2.evt file, extra rows are filled as -1
| Pixel properties | Quadrant properties | ||||||
|---|---|---|---|---|---|---|---|
| Quadrant | DetID | PixID | Counts | Sigma | Mean | Median | Sigma |
| A | 10 | 83 | 960067 | 2741.93 | 1733 | 1699 | 349.5 |
| A | 12 | 16 | 756494 | 2159.5 | 1733 | 1699 | 349.5 |
| A | 12 | 189 | 183198 | 519.27 | 1733 | 1699 | 349.5 |
| B | 5 | 172 | 374679 | 1139.09 | 1720 | 1673 | 327.5 |
| B | 15 | 35 | 91448 | 274.16 | 1720 | 1673 | 327.5 |
| B | 5 | 184 | 82302 | 246.23 | 1720 | 1673 | 327.5 |
| C | 15 | 214 | 649534 | 1648.9 | 1688 | 1697 | 392.9 |
| C | 14 | 254 | 501319 | 1271.66 | 1688 | 1697 | 392.9 |
| C | 9 | 236 | 112423 | 281.82 | 1688 | 1697 | 392.9 |
| D | 10 | 203 | 5917930 | 14755.06 | 1652 | 1603 | 401.0 |
| D | 12 | 235 | 4555199 | 11356.47 | 1652 | 1603 | 401.0 |
| D | 2 | 250 | 776240 | 1931.91 | 1652 | 1603 | 401.0 |
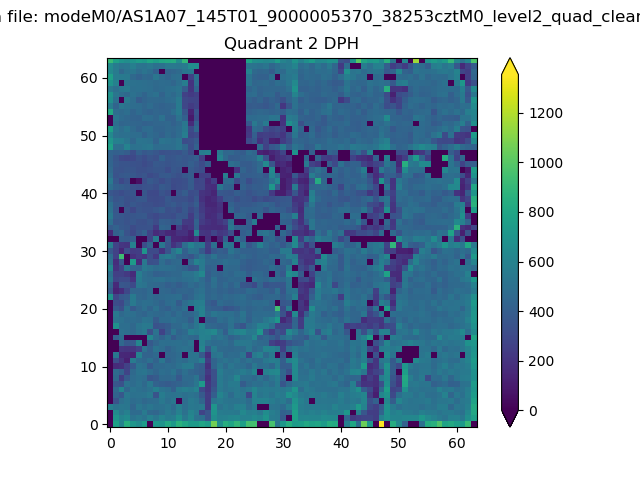
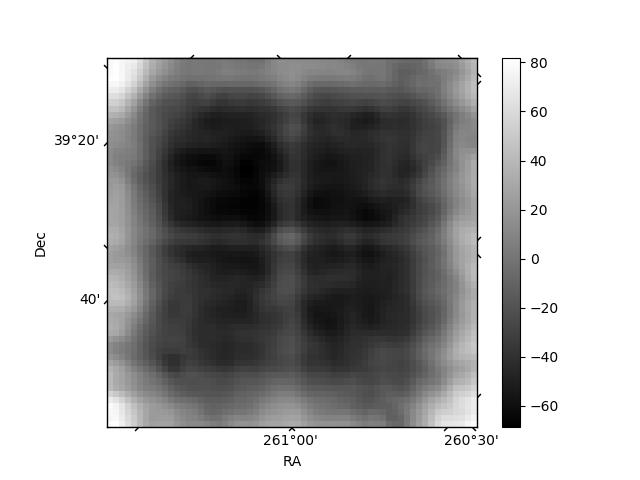
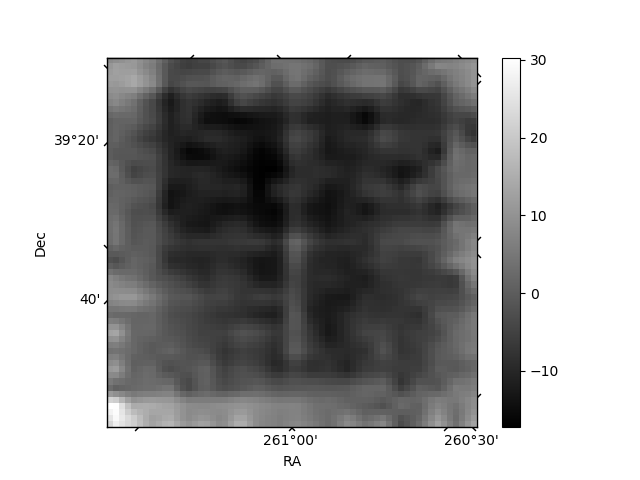
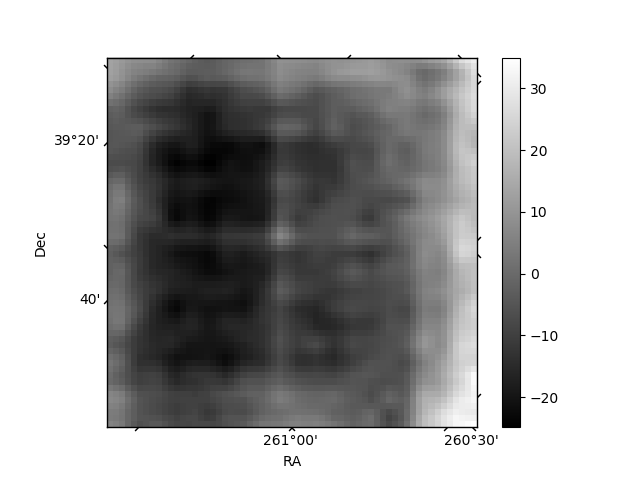
Histogram calculated using DETX and DETY for each event in the final _common_clean file
| Quadrant A | 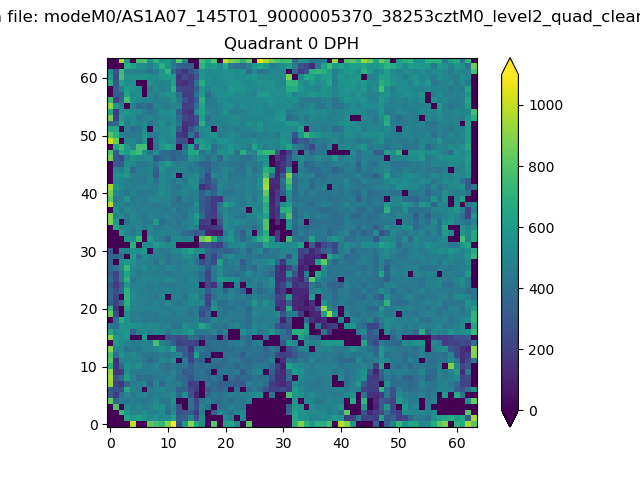 |
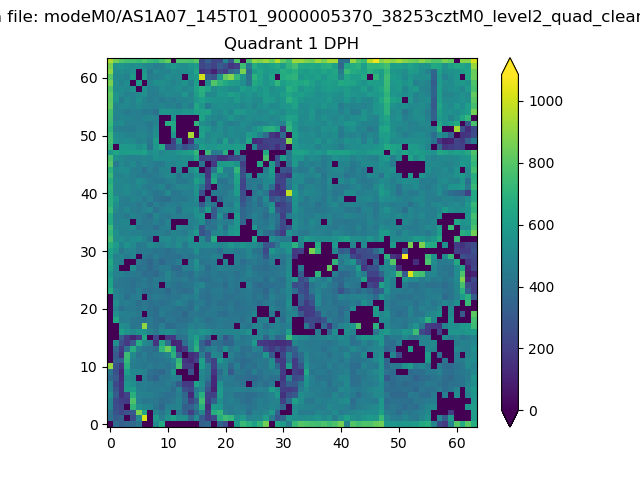 |
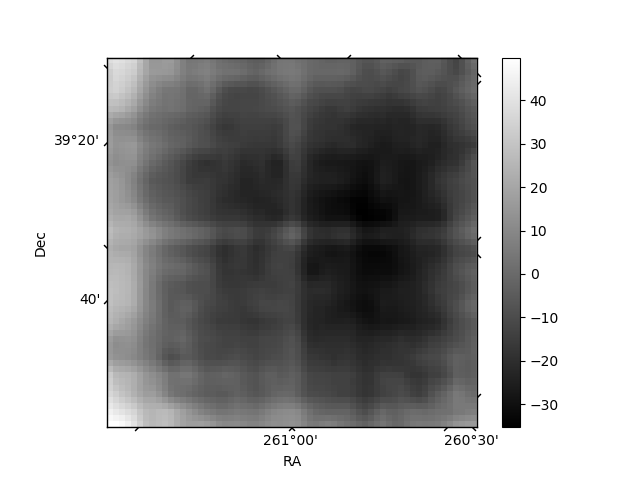
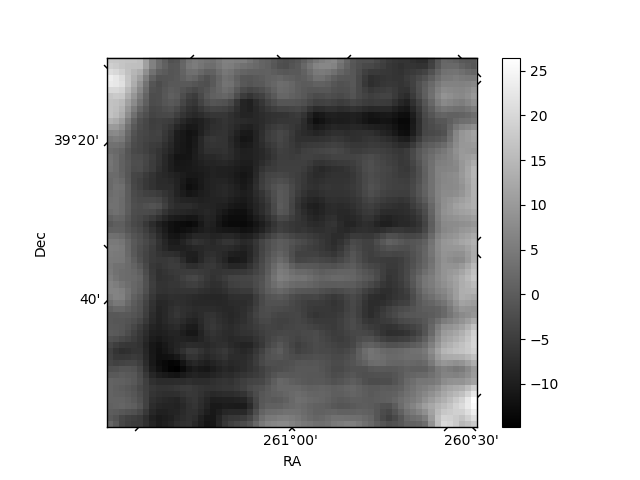
Quadrant B |
|---|---|---|---|
| Quadrant D | 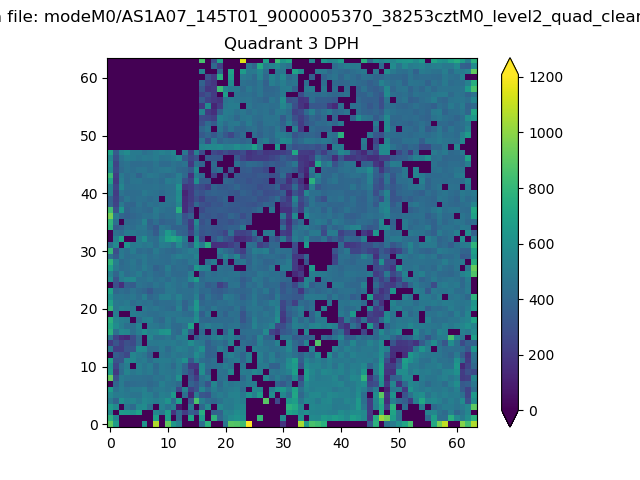 |
 |
Quadrant C |
| Plot type | Count rate plots | Images |
|---|---|---|
| Comparison with Poisson distribution Blue bars denote a histogram of data divided into 1 sec bins. Red curve is a Poisson curve with rate = median count rate of data. |
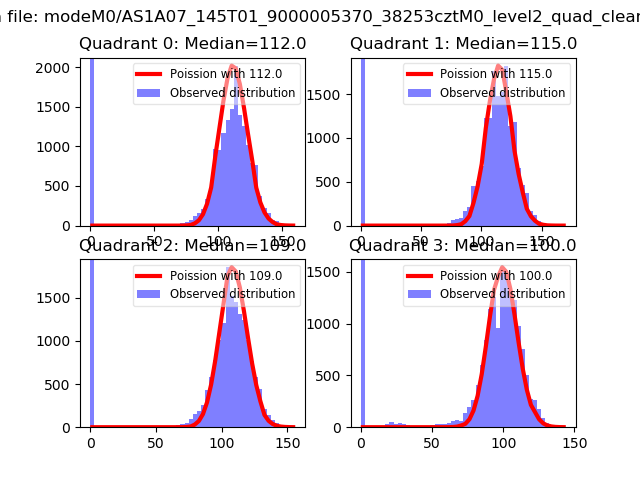 |
 |
| Quadrant-wise count rates Data is divided into 100 sec bins |
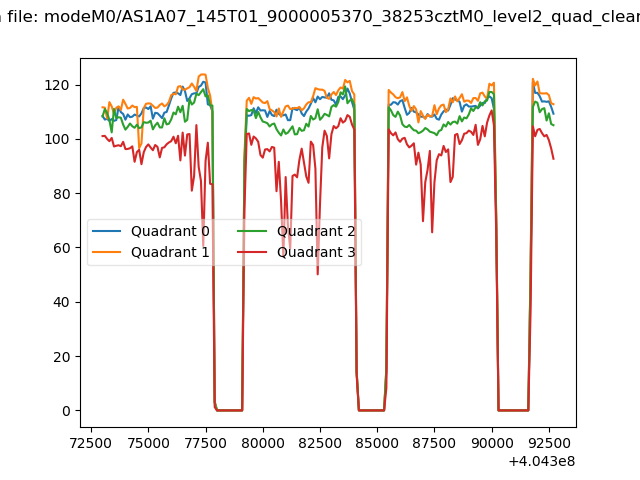 |
|
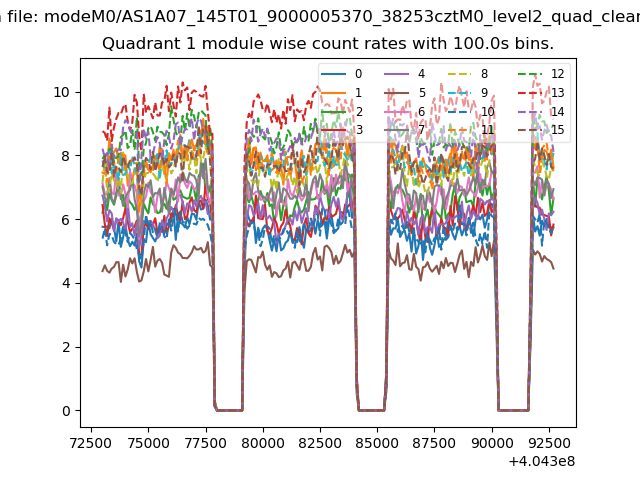
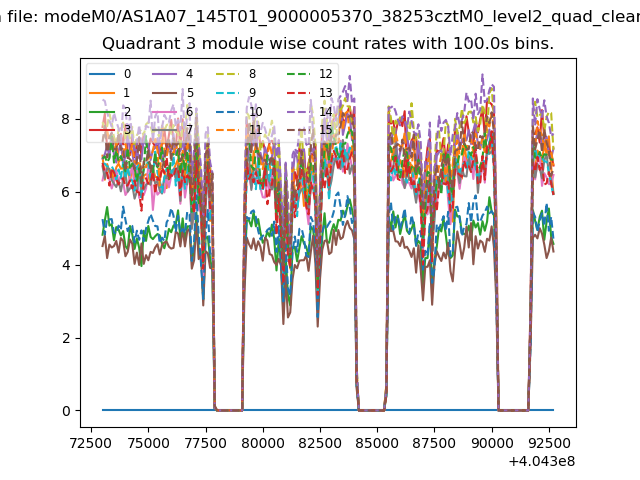
| Module-wise count rates for Quadrant A Data is divided into 100 sec bins |
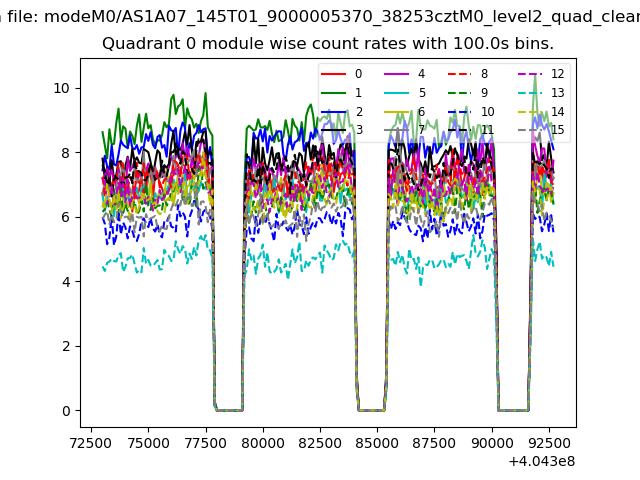 |
 |
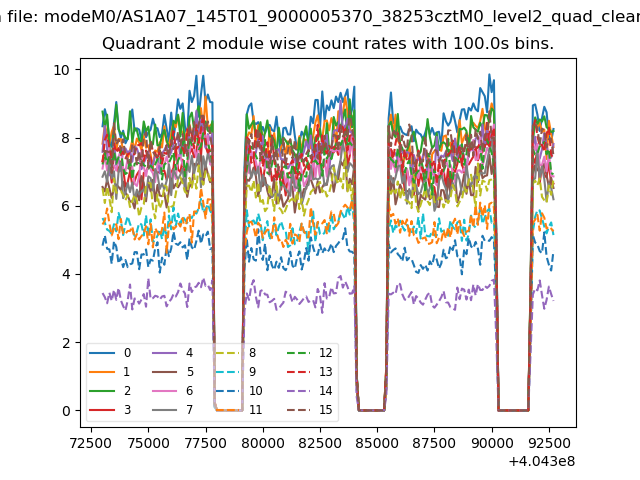
| Module-wise count rates for Quadrant B Data is divided into 100 sec bins |
 |
 |
| Module-wise count rates for Quadrant C Data is divided into 100 sec bins |
 |
 |
| Module-wise count rates for Quadrant D Data is divided into 100 sec bins |
 |
 |
| Parameter | Plot |
|---|---|
| CZT HV Monitor | 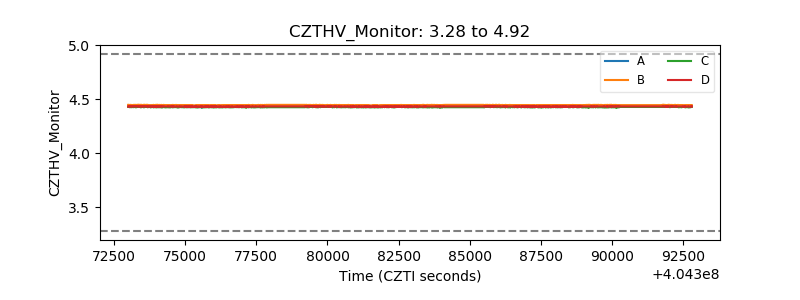 |
| D_VDD | 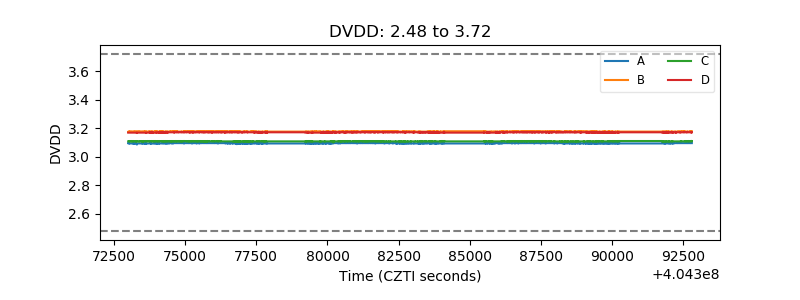 |
| Temperature 1 | 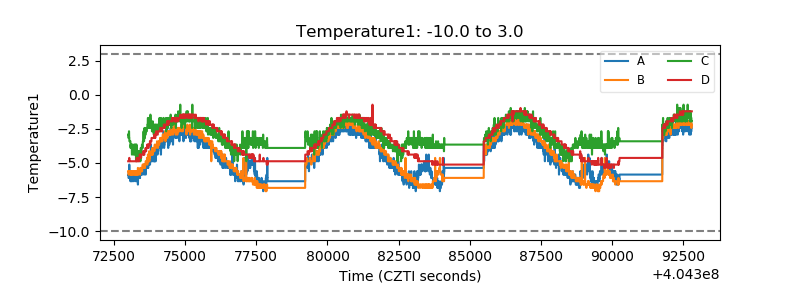 |
| Veto HV Monitor | 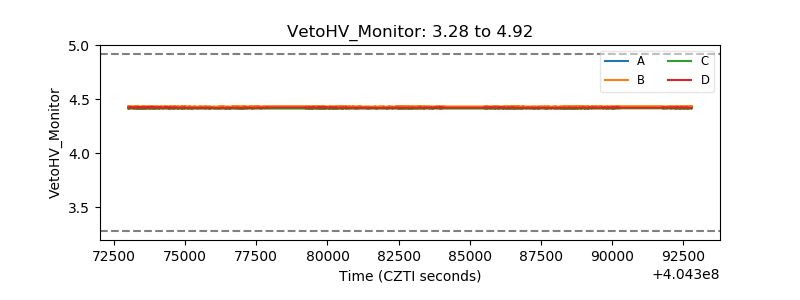 |
| Veto LLD | 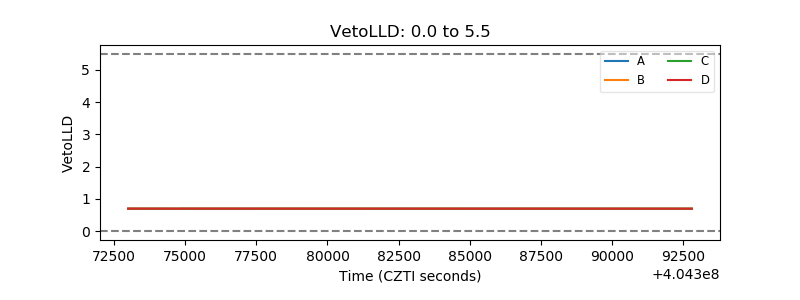 |
| Alpha Counter |  |
| _CPM_Rate | 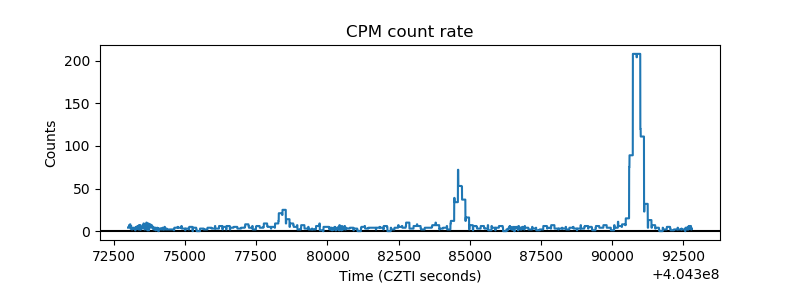 |
| CZT Counter | 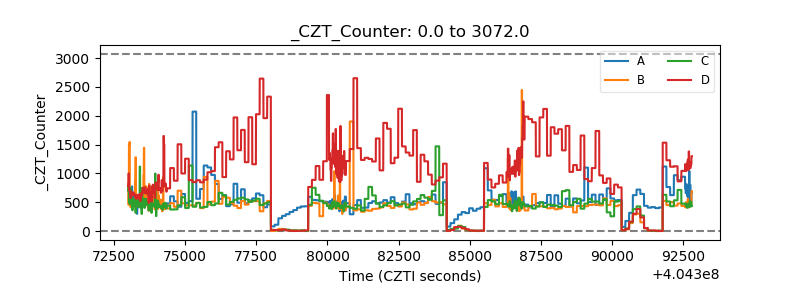 |
| +2.5 Volts monitor | 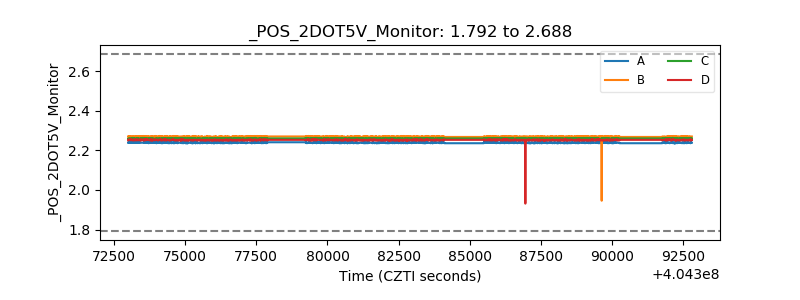 |
| +5 Volts monitor | 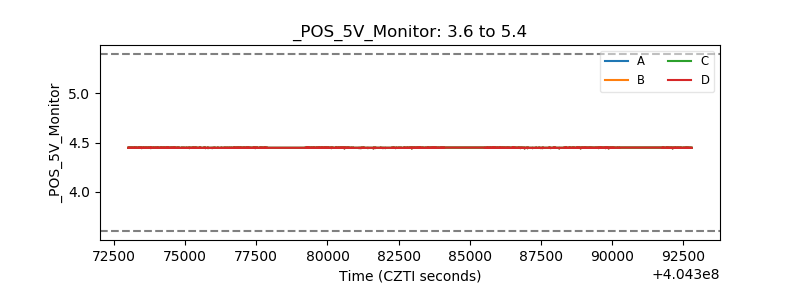 |
| _ROLL_ROT | 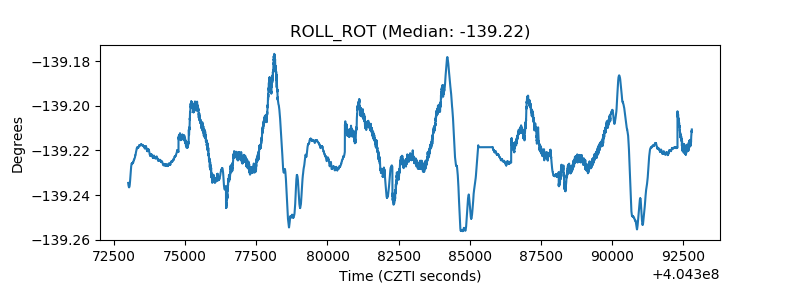 |
| _Roll_DEC | 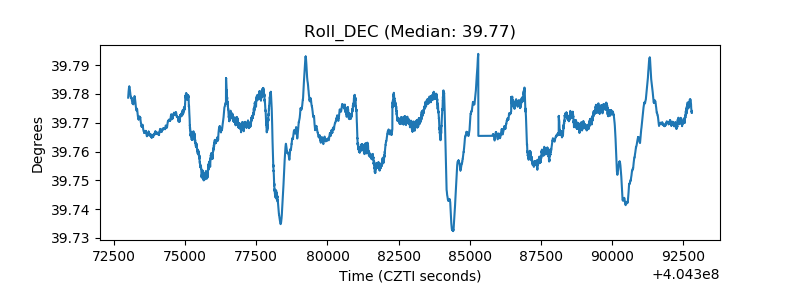 |
| _Roll_RA | 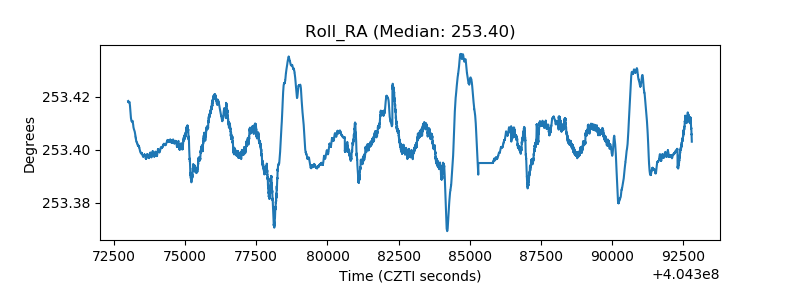 |
| Veto Counter | 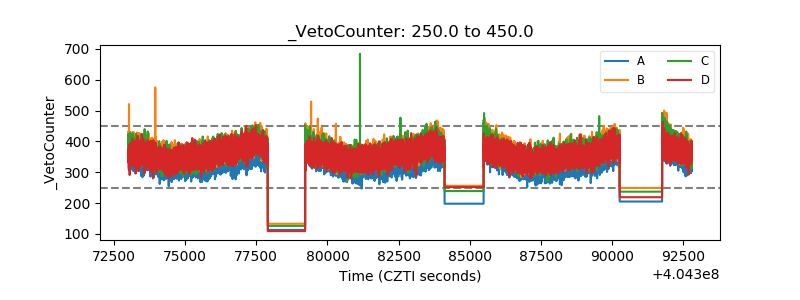 |