| Param | Original file | Final file |
|---|---|---|
| Filename | modeM0/AS1A07_145T01_9000005370_38254cztM0_level2.fits | modeM0/AS1A07_145T01_9000005370_38254cztM0_level2_quad_clean.evt |
| Size (bytes) | 493,188,480 | 91,117,440 |
| Size | 470.3 MB | 86.9 MB |
| Events in quadrant A | 3,652,361 | 621,558 |
| Events in quadrant B | 3,592,350 | 627,917 |
| Events in quadrant C | 2,782,757 | 612,438 |
| Events in quadrant D | 7,795,070 | 505,859 |
| Mode M9 | |||
|---|---|---|---|
| Quadrant | BADHDUFLAG | Total packets | Discarded packets |
| A | 0 | 21 | 0 |
| B | 0 | 21 | 0 |
| C | 0 | 21 | 0 |
| D | 0 | 22 | 0 |
| Mode SS | |||
|---|---|---|---|
| Quadrant | BADHDUFLAG | Total packets | Discarded packets |
| A | 0 | 112 | 0 |
| B | 0 | 112 | 0 |
| C | 0 | 112 | 0 |
| D | 0 | 112 | 0 |
| Mode M0 | |||
|---|---|---|---|
| Quadrant | BADHDUFLAG | Total packets | Discarded packets |
| A | 0 | 14473 | 3 |
| B | 0 | 14657 | 2 |
| C | 0 | 11779 | 2 |
| D | 0 | 27119 | 2 |
| Quadrant | Total seconds | Saturated seconds | Saturation percentage |
|---|---|---|---|
| A | 5595 | 134 | 2.394996% |
| B | 5595 | 218 | 3.896336% |
| C | 5595 | 12 | 0.214477% |
| D | 5595 | 849 | 15.174263% |
Noise dominated data is calculated using 1-second bins in cleaned event files. If a bin has >2000 counts, and if more than 50% of those come from <1% of pixels, then it is considered to be noise-dominated and hence unusable.
| Quadrant | # 1 sec bins | Bins with >0 counts | Bins with >2000 counts | High rate bins dominated by noise | Noise dominated (total time) | Noise dominated (detector-on time) | Marked lightcurve |
|---|---|---|---|---|---|---|---|
| A | 7208 | 5596 | 81 | 81 | 1.12% | 1.45% | 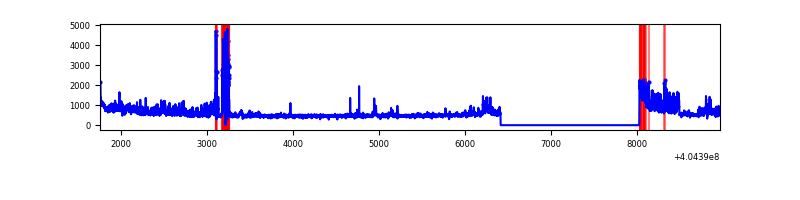 |
| B | 7208 | 5596 | 136 | 136 | 1.89% | 2.43% | 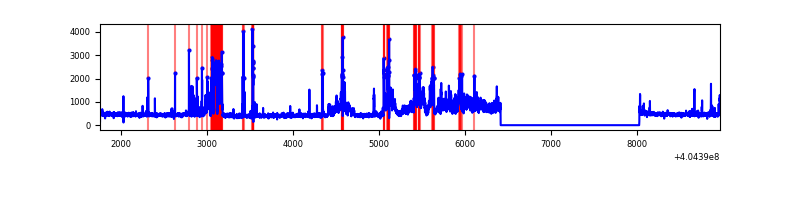 |
| C | 7208 | 5596 | 4 | 4 | 0.06% | 0.07% | 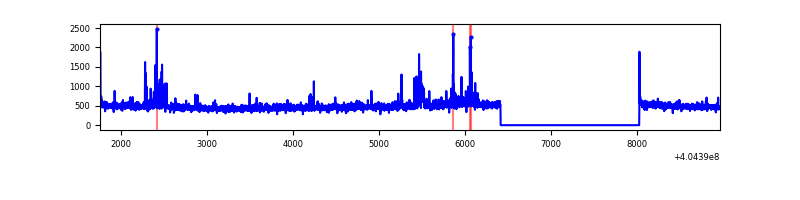 |
| D | 7208 | 5596 | 956 | 956 | 13.26% | 17.08% | 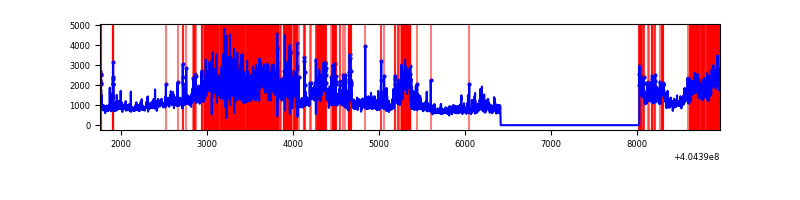 |
Top three noisy pixels from each quadrant. If the there are fewer than three noisy pixels in the level2.evt file, extra rows are filled as -1
| Pixel properties | Quadrant properties | ||||||
|---|---|---|---|---|---|---|---|
| Quadrant | DetID | PixID | Counts | Sigma | Mean | Median | Sigma |
| A | 12 | 16 | 511777 | 4069.78 | 613 | 599 | 125.6 |
| A | 10 | 83 | 404361 | 3214.58 | 613 | 599 | 125.6 |
| A | 7 | 16 | 210913 | 1674.43 | 613 | 599 | 125.6 |
| B | 5 | 172 | 790496 | 6746.69 | 609 | 591 | 117.1 |
| B | 5 | 184 | 303677 | 2588.7 | 609 | 591 | 117.1 |
| B | 4 | 232 | 32517 | 272.68 | 609 | 591 | 117.1 |
| C | 15 | 214 | 235868 | 1660.87 | 604 | 608 | 141.6 |
| C | 9 | 236 | 86377 | 605.51 | 604 | 608 | 141.6 |
| C | 15 | 208 | 64112 | 448.32 | 604 | 608 | 141.6 |
| D | 10 | 203 | 2204581 | 15558.32 | 578 | 562 | 141.7 |
| D | 12 | 235 | 2132938 | 15052.59 | 578 | 562 | 141.7 |
| D | 13 | 138 | 378945 | 2671.03 | 578 | 562 | 141.7 |
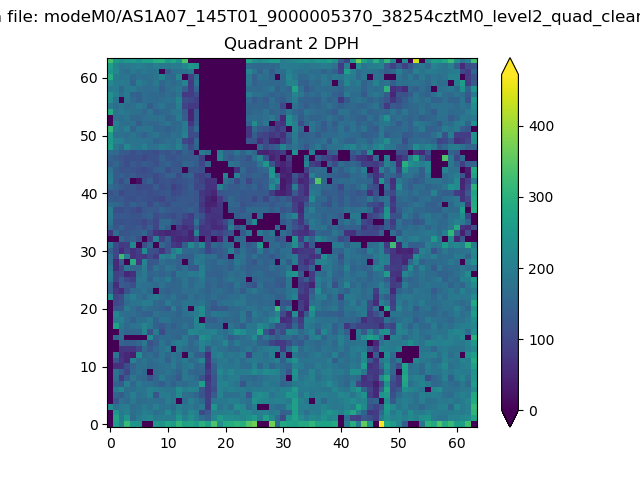
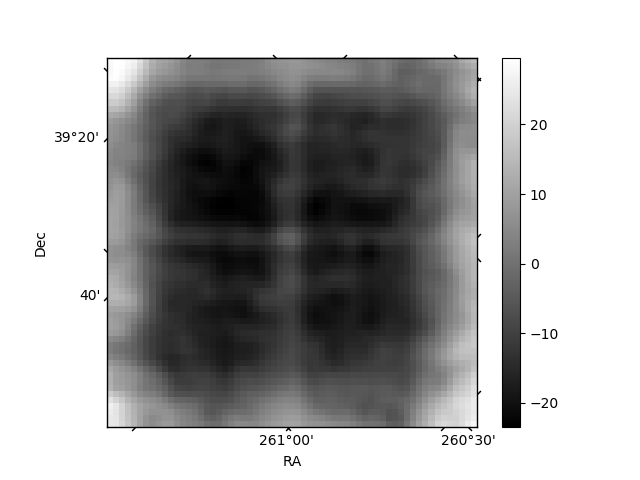
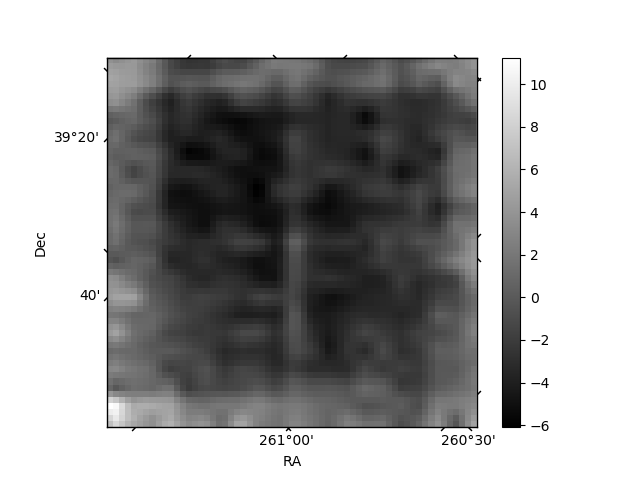
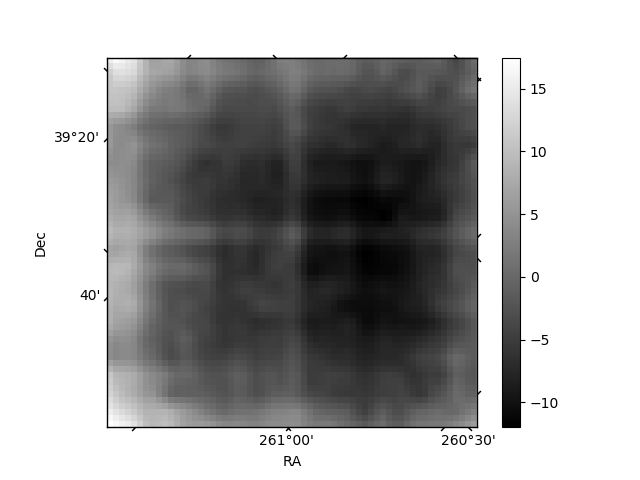
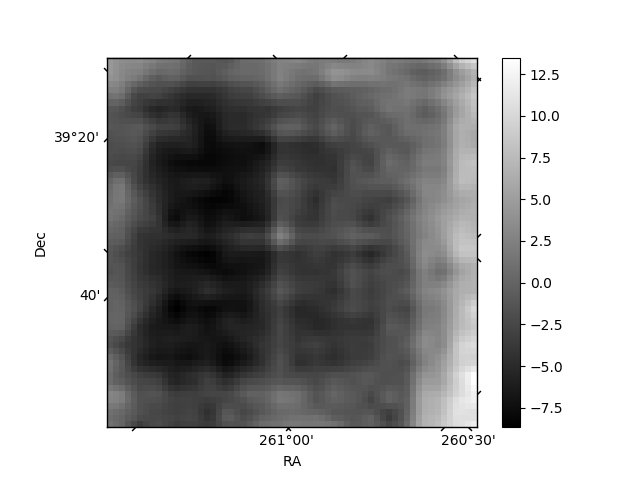
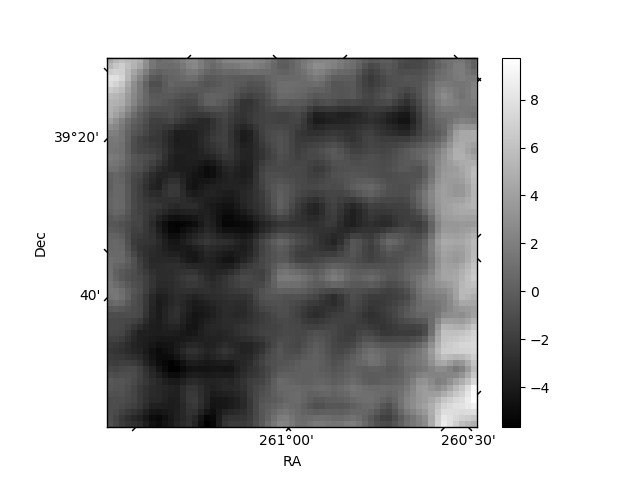
Histogram calculated using DETX and DETY for each event in the final _common_clean file
| Quadrant A | 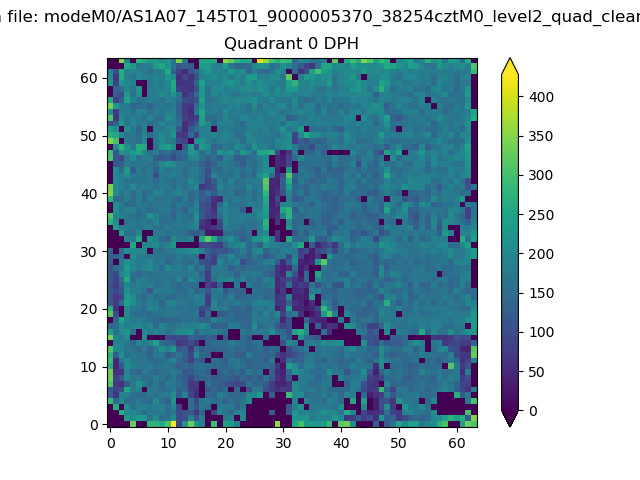 |
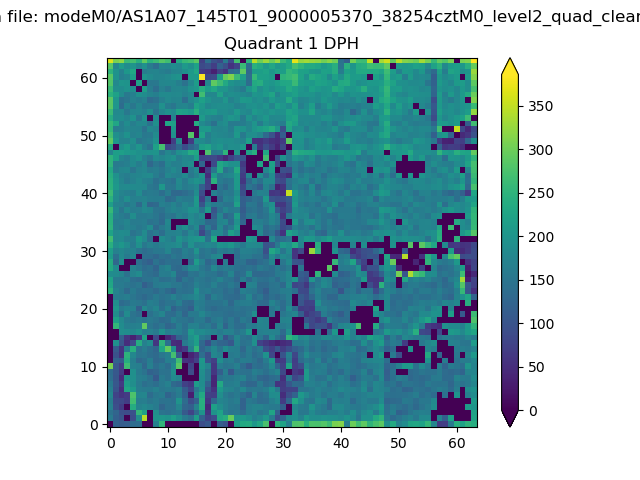 |
Quadrant B |
|---|---|---|---|
| Quadrant D | 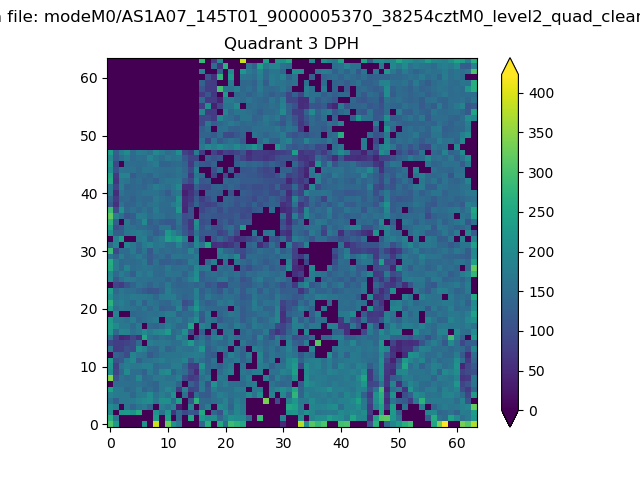 |
 |
Quadrant C |
| Plot type | Count rate plots | Images |
|---|---|---|
| Comparison with Poisson distribution Blue bars denote a histogram of data divided into 1 sec bins. Red curve is a Poisson curve with rate = median count rate of data. |
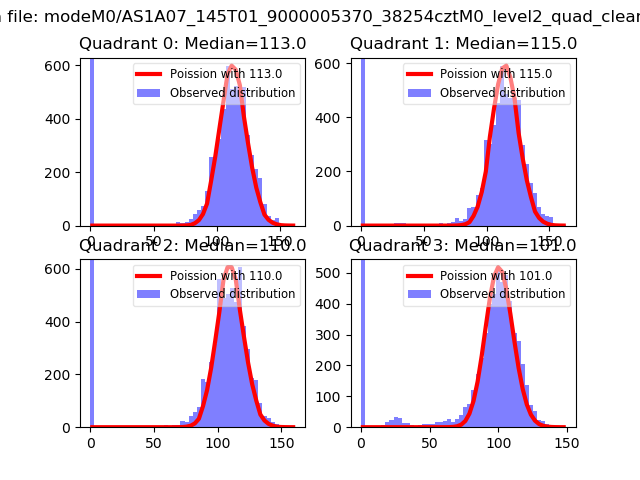 |
 |
| Quadrant-wise count rates Data is divided into 100 sec bins |
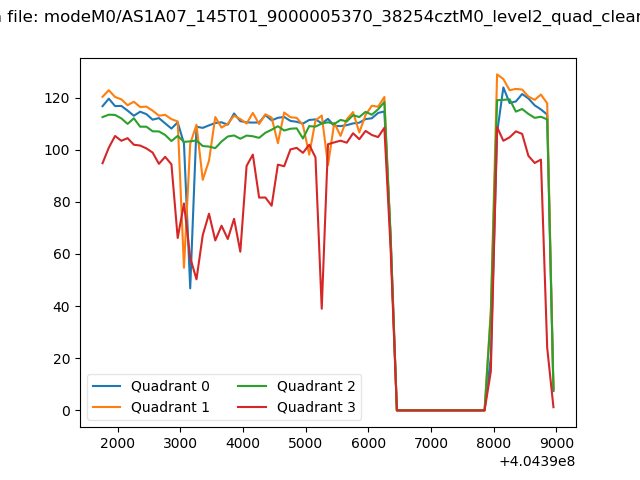 |
|
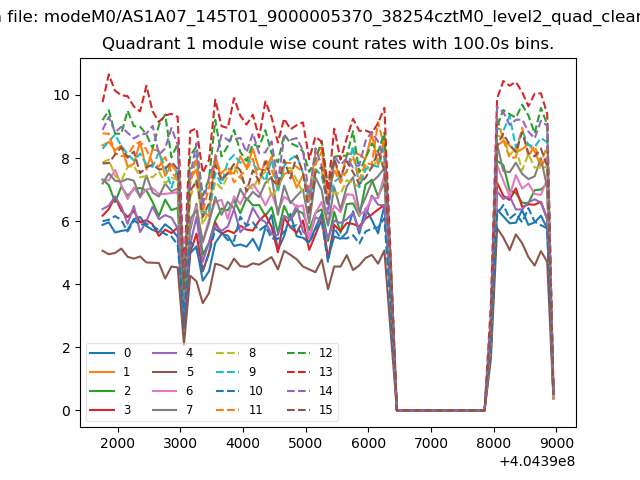
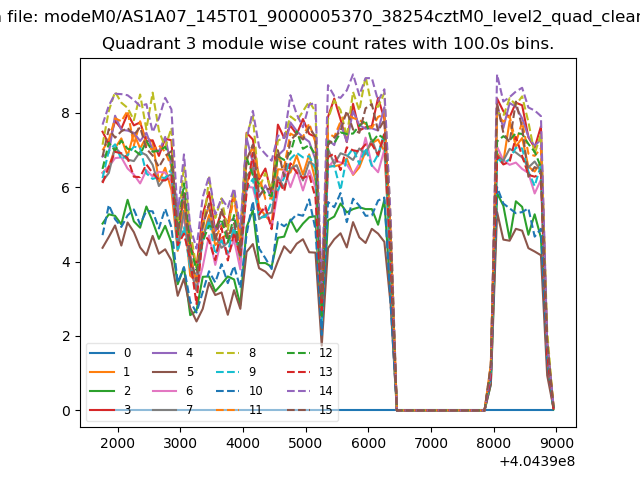
| Module-wise count rates for Quadrant A Data is divided into 100 sec bins |
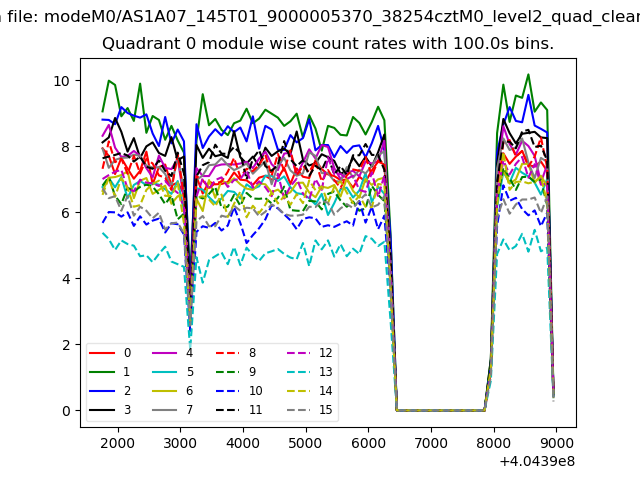 |
 |
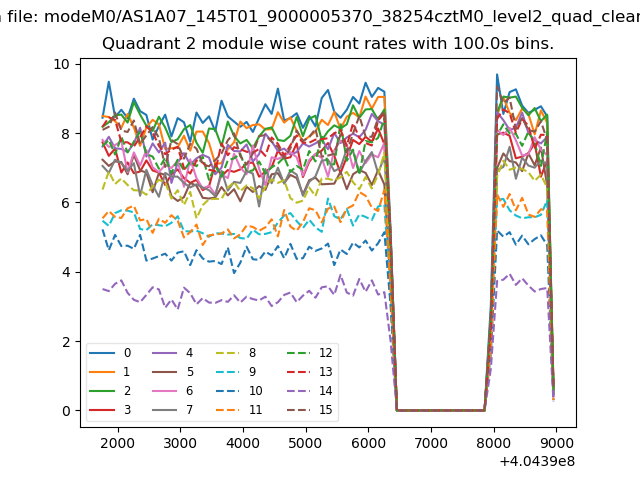
| Module-wise count rates for Quadrant B Data is divided into 100 sec bins |
 |
 |
| Module-wise count rates for Quadrant C Data is divided into 100 sec bins |
 |
 |
| Module-wise count rates for Quadrant D Data is divided into 100 sec bins |
 |
 |
| Parameter | Plot |
|---|---|
| CZT HV Monitor | 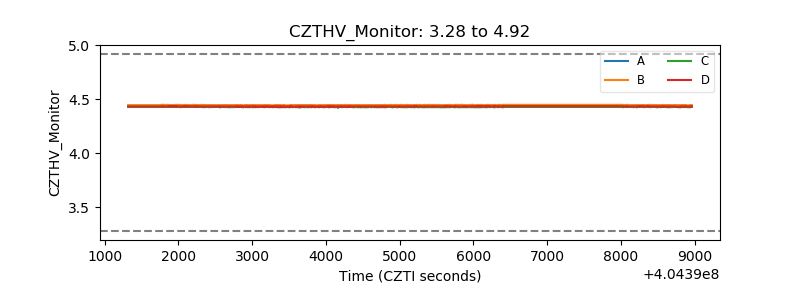 |
| D_VDD | 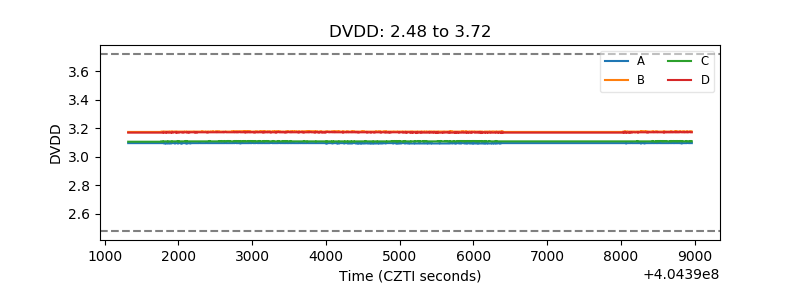 |
| Temperature 1 | 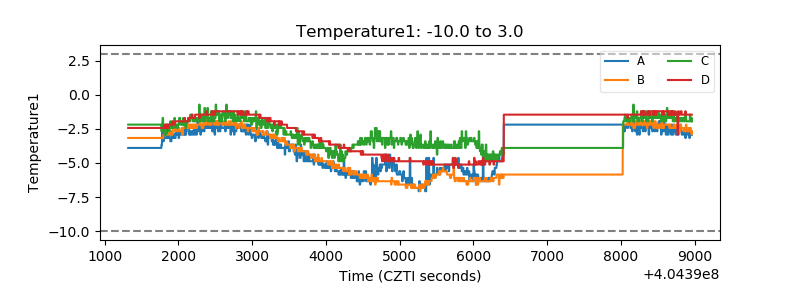 |
| Veto HV Monitor | 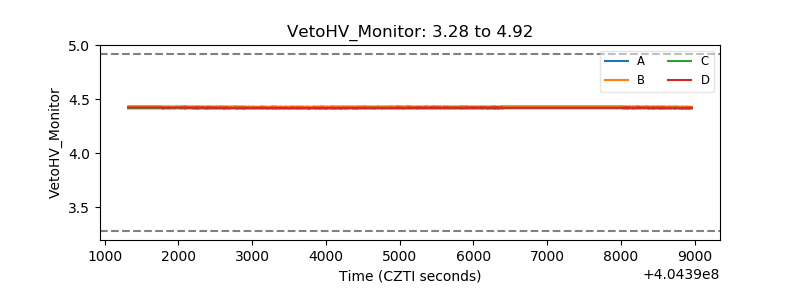 |
| Veto LLD | 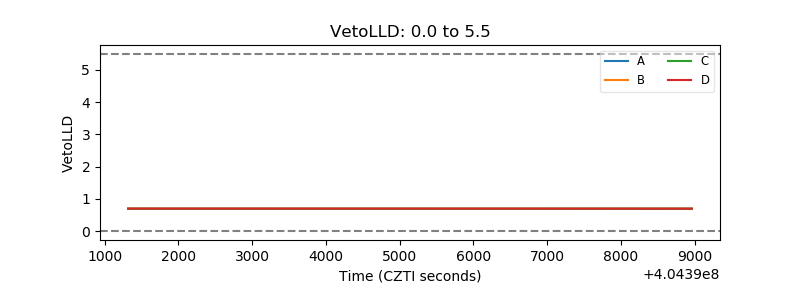 |
| Alpha Counter | 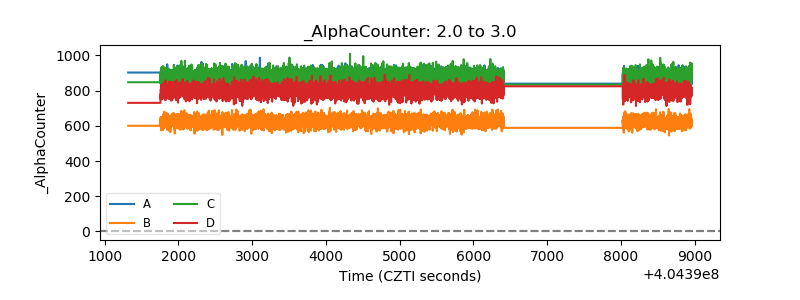 |
| _CPM_Rate | 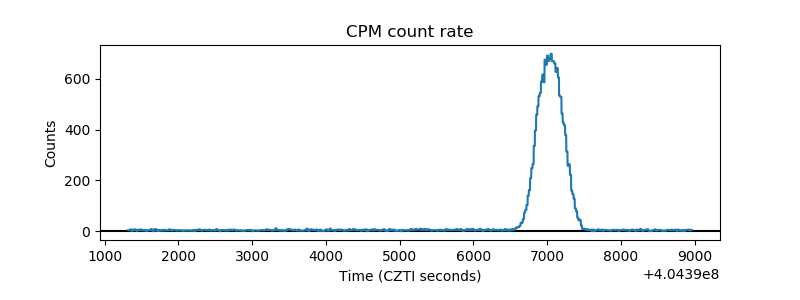 |
| CZT Counter | 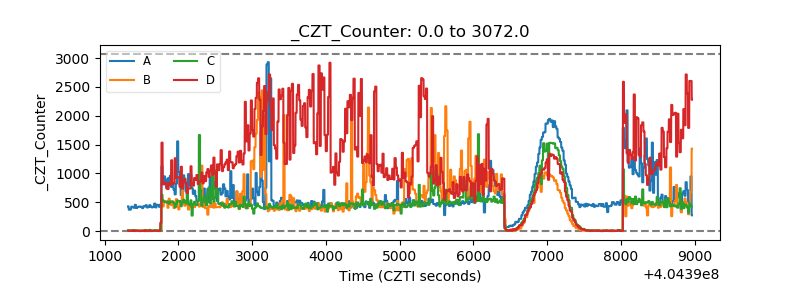 |
| +2.5 Volts monitor | 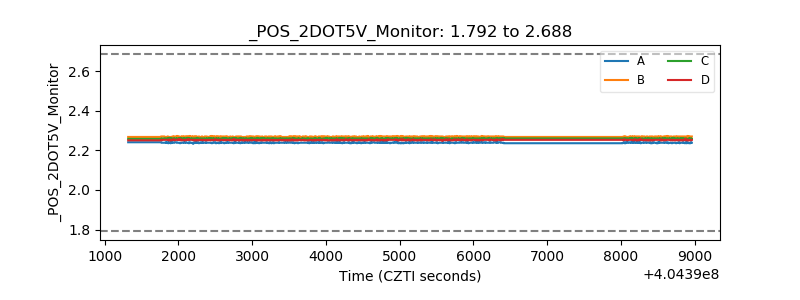 |
| +5 Volts monitor | 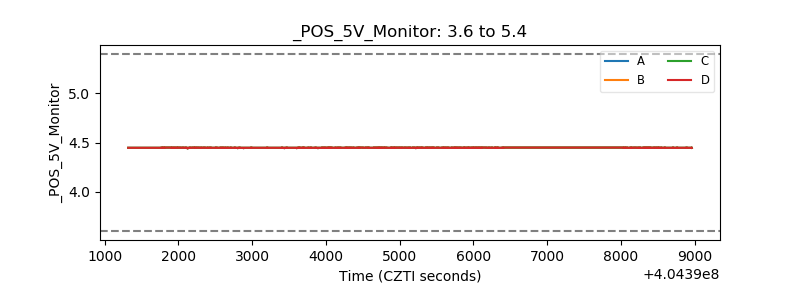 |
| _ROLL_ROT | 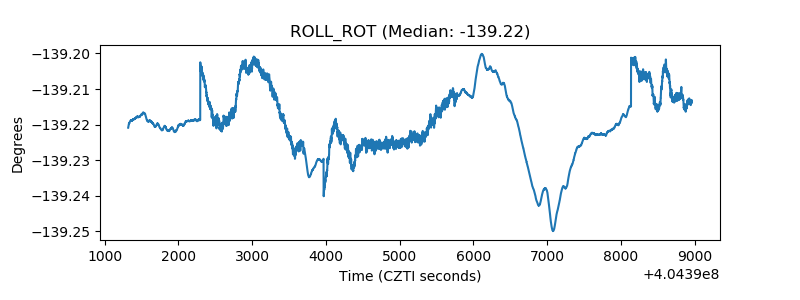 |
| _Roll_DEC | 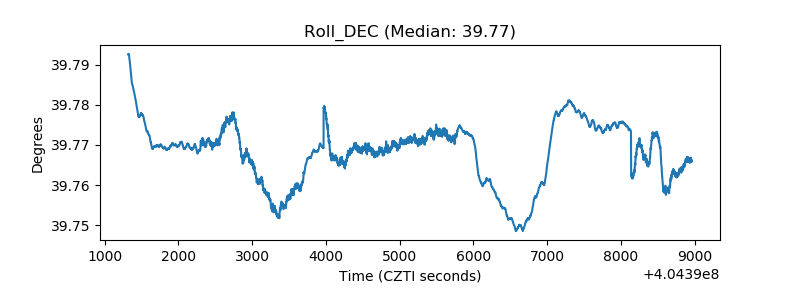 |
| _Roll_RA | 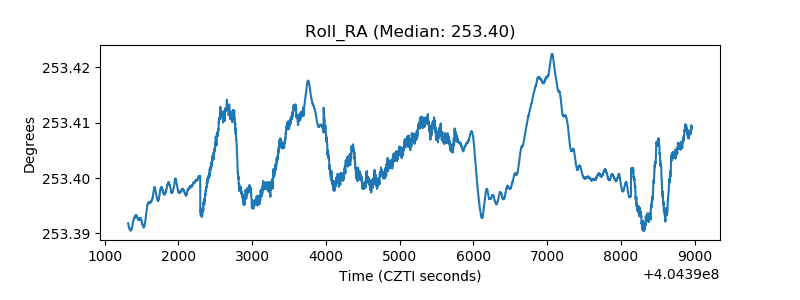 |
| Veto Counter | 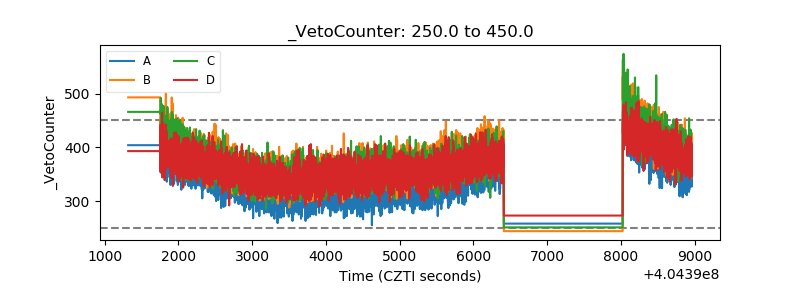 |