| Param | Original file | Final file |
|---|---|---|
| Filename | modeM0/AS1A07_145T01_9000005370_38256cztM0_level2.fits | modeM0/AS1A07_145T01_9000005370_38256cztM0_level2_quad_clean.evt |
| Size (bytes) | 437,601,600 | 89,631,360 |
| Size | 417.3 MB | 85.5 MB |
| Events in quadrant A | 3,358,759 | 617,300 |
| Events in quadrant B | 2,473,483 | 636,791 |
| Events in quadrant C | 2,810,347 | 605,881 |
| Events in quadrant D | 7,140,707 | 479,298 |
| Mode M9 | |||
|---|---|---|---|
| Quadrant | BADHDUFLAG | Total packets | Discarded packets |
| A | 0 | 17 | 0 |
| B | 0 | 17 | 0 |
| C | 0 | 17 | 0 |
| D | 0 | 18 | 0 |
| Mode SS | |||
|---|---|---|---|
| Quadrant | BADHDUFLAG | Total packets | Discarded packets |
| A | 0 | 110 | 0 |
| B | 0 | 110 | 0 |
| C | 0 | 110 | 0 |
| D | 0 | 110 | 0 |
| Mode M0 | |||
|---|---|---|---|
| Quadrant | BADHDUFLAG | Total packets | Discarded packets |
| A | 0 | 13334 | 3 |
| B | 0 | 10974 | 2 |
| C | 0 | 11692 | 2 |
| D | 0 | 25174 | 2 |
| Quadrant | Total seconds | Saturated seconds | Saturation percentage |
|---|---|---|---|
| A | 5347 | 68 | 1.271741% |
| B | 5347 | 13 | 0.243127% |
| C | 5347 | 20 | 0.374042% |
| D | 5347 | 946 | 17.692164% |
Noise dominated data is calculated using 1-second bins in cleaned event files. If a bin has >2000 counts, and if more than 50% of those come from <1% of pixels, then it is considered to be noise-dominated and hence unusable.
| Quadrant | # 1 sec bins | Bins with >0 counts | Bins with >2000 counts | High rate bins dominated by noise | Noise dominated (total time) | Noise dominated (detector-on time) | Marked lightcurve |
|---|---|---|---|---|---|---|---|
| A | 7110 | 5348 | 27 | 27 | 0.38% | 0.50% | 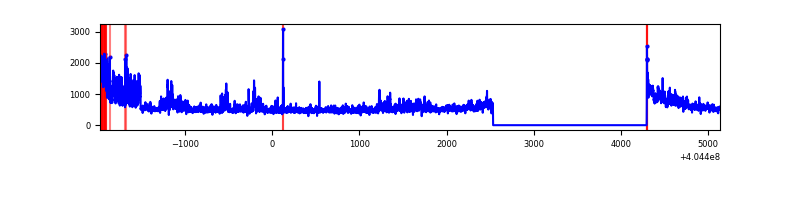 |
| B | 7110 | 5348 | 4 | 4 | 0.06% | 0.07% | 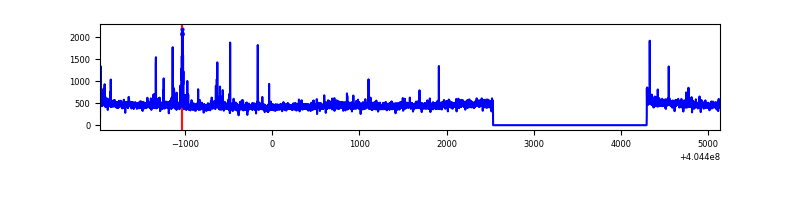 |
| C | 7110 | 5348 | 13 | 13 | 0.18% | 0.24% | 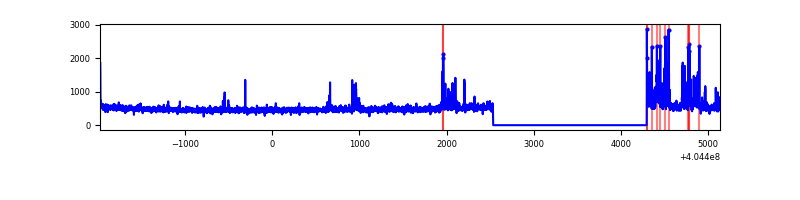 |
| D | 7110 | 5348 | 996 | 996 | 14.01% | 18.62% | 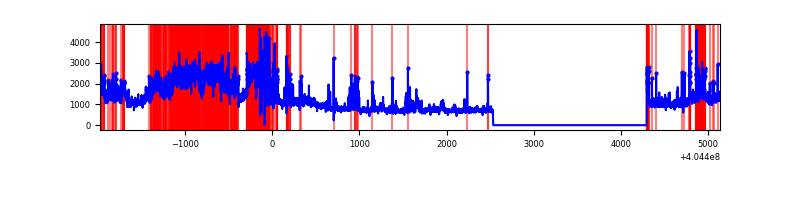 |
Top three noisy pixels from each quadrant. If the there are fewer than three noisy pixels in the level2.evt file, extra rows are filled as -1
| Pixel properties | Quadrant properties | ||||||
|---|---|---|---|---|---|---|---|
| Quadrant | DetID | PixID | Counts | Sigma | Mean | Median | Sigma |
| A | 12 | 16 | 465972 | 3899.53 | 597 | 585 | 119.3 |
| A | 10 | 83 | 394298 | 3298.96 | 597 | 585 | 119.3 |
| A | 12 | 189 | 88809 | 739.24 | 597 | 585 | 119.3 |
| B | 15 | 85 | 38614 | 330.14 | 596 | 582 | 115.2 |
| B | 5 | 172 | 38266 | 327.12 | 596 | 582 | 115.2 |
| B | 0 | 229 | 28283 | 240.46 | 596 | 582 | 115.2 |
| C | 15 | 214 | 225081 | 1633.66 | 587 | 592 | 137.4 |
| C | 9 | 236 | 221856 | 1610.19 | 587 | 592 | 137.4 |
| C | 14 | 254 | 21139 | 149.53 | 587 | 592 | 137.4 |
| D | 10 | 203 | 2129490 | 15630.77 | 558 | 543 | 136.2 |
| D | 12 | 235 | 2009052 | 14746.51 | 558 | 543 | 136.2 |
| D | 13 | 249 | 591268 | 4337.11 | 558 | 543 | 136.2 |
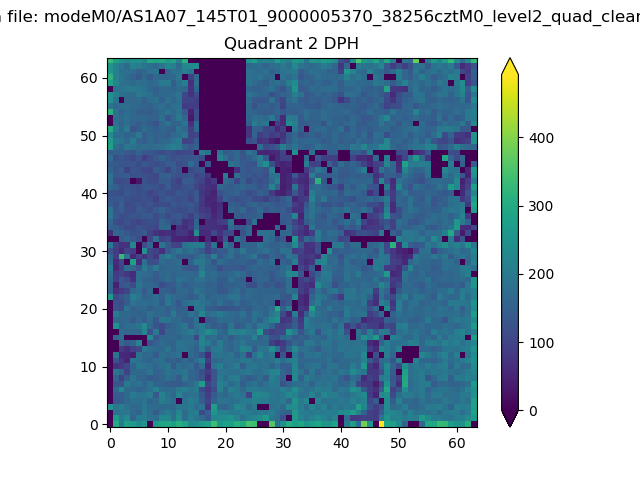
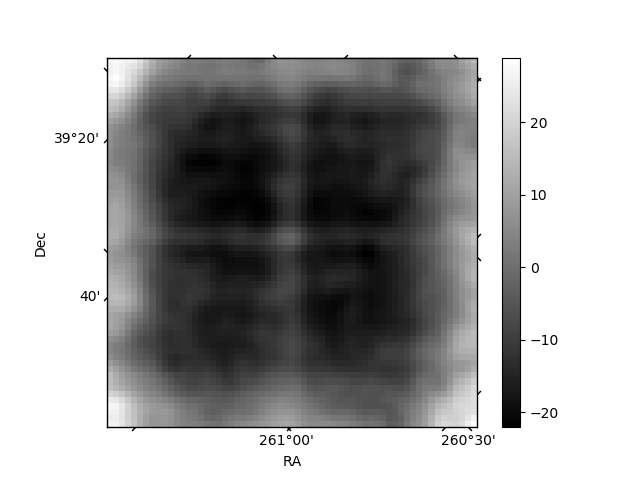
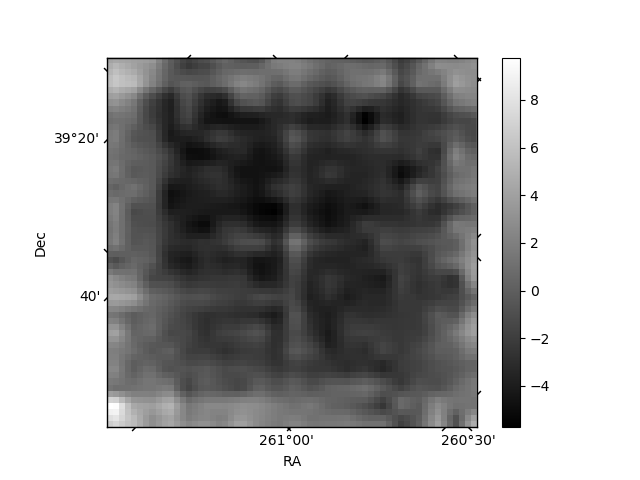
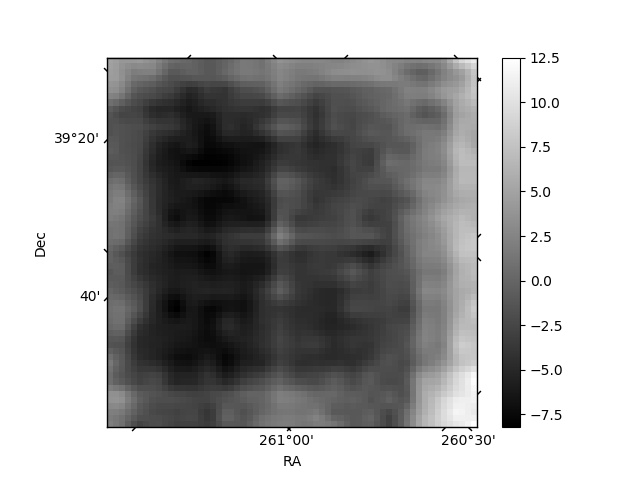
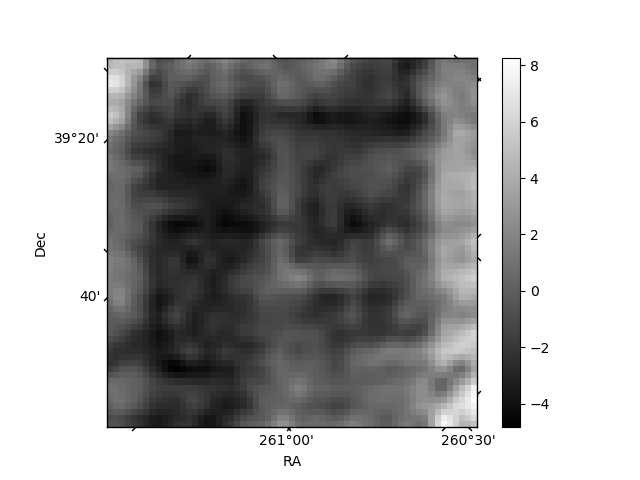
Histogram calculated using DETX and DETY for each event in the final _common_clean file
| Quadrant A | 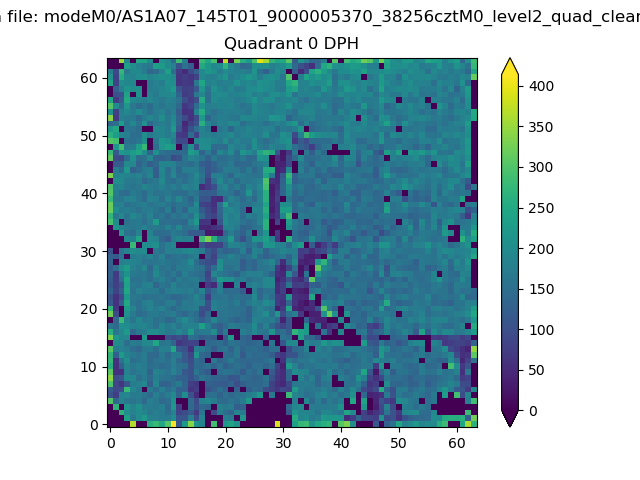 |
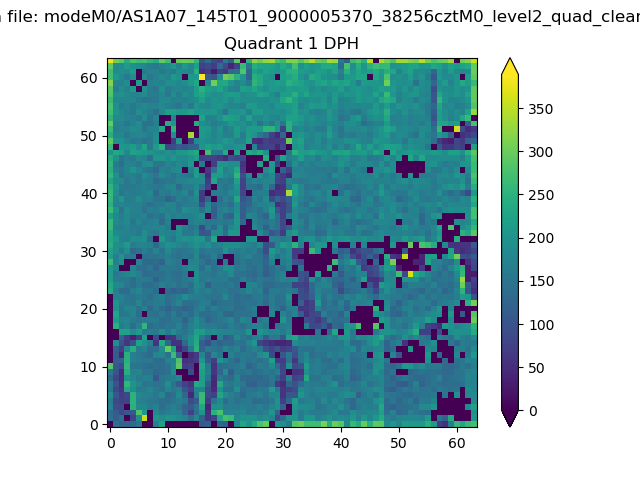 |
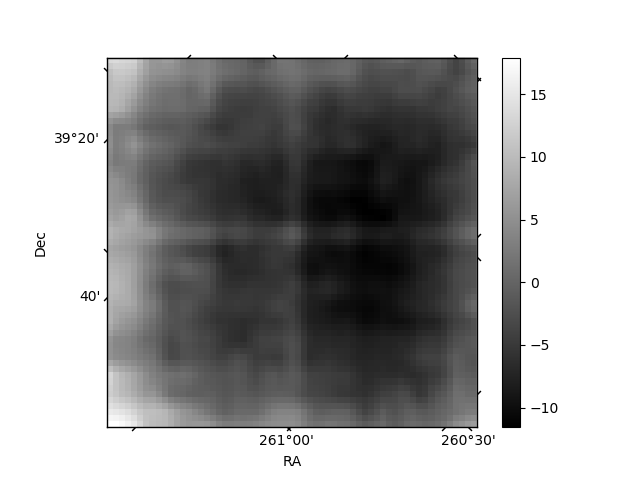
Quadrant B |
|---|---|---|---|
| Quadrant D | 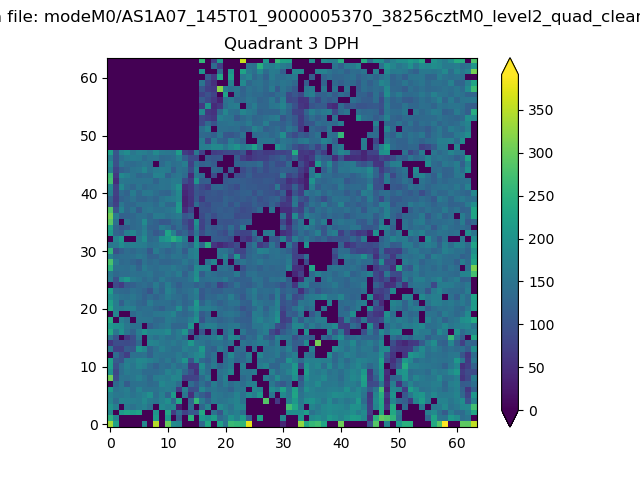 |
 |
Quadrant C |
| Plot type | Count rate plots | Images |
|---|---|---|
| Comparison with Poisson distribution Blue bars denote a histogram of data divided into 1 sec bins. Red curve is a Poisson curve with rate = median count rate of data. |
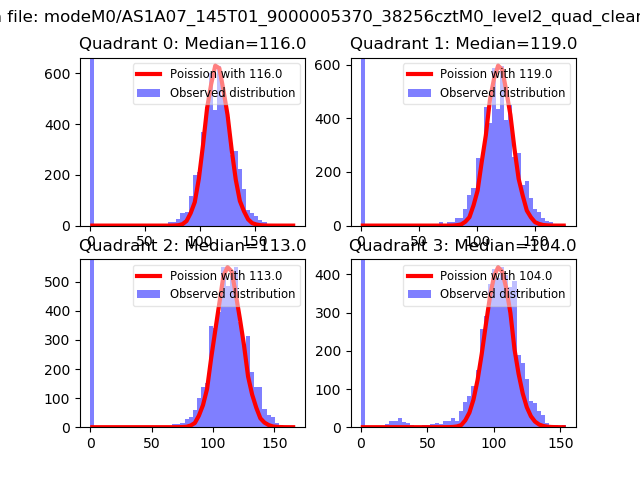 |
 |
| Quadrant-wise count rates Data is divided into 100 sec bins |
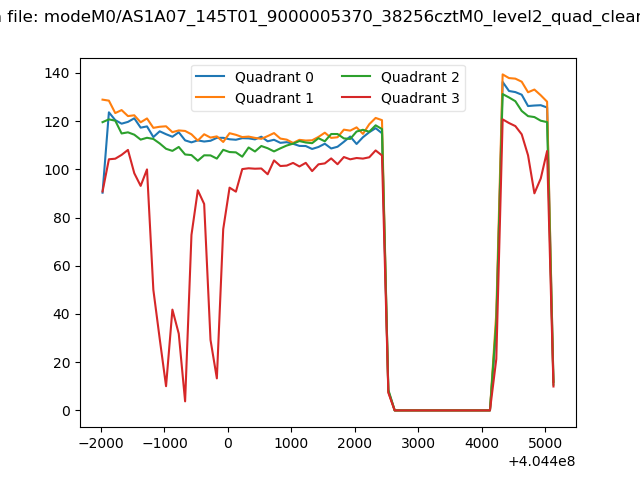 |
|
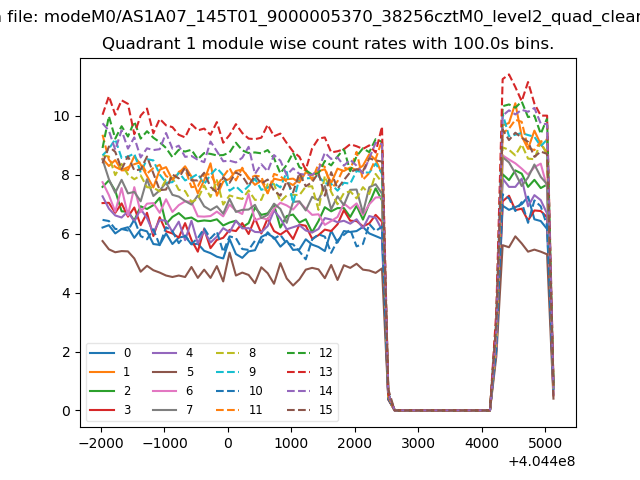
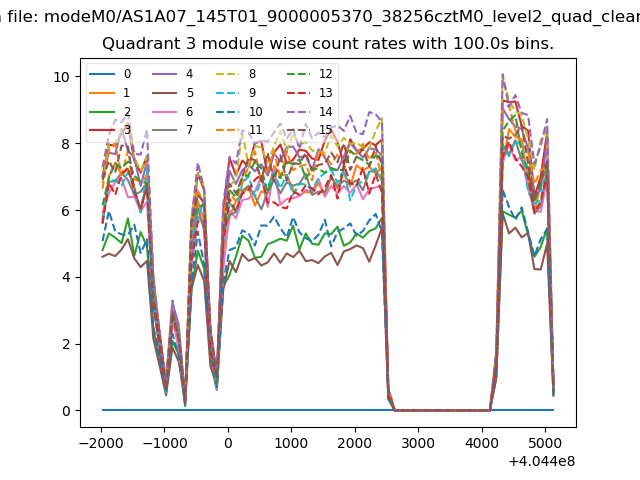
| Module-wise count rates for Quadrant A Data is divided into 100 sec bins |
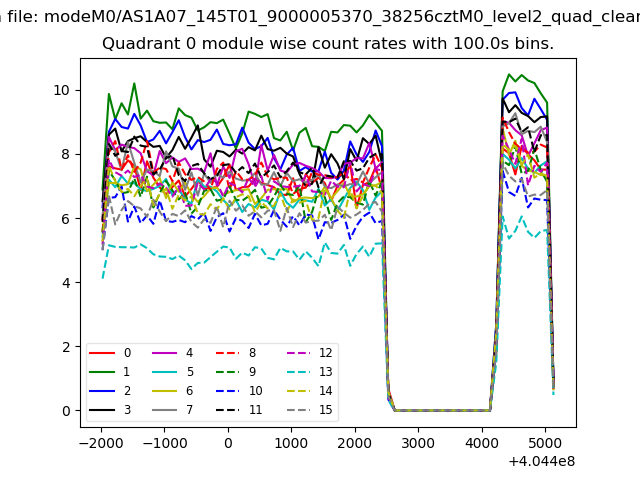 |
 |
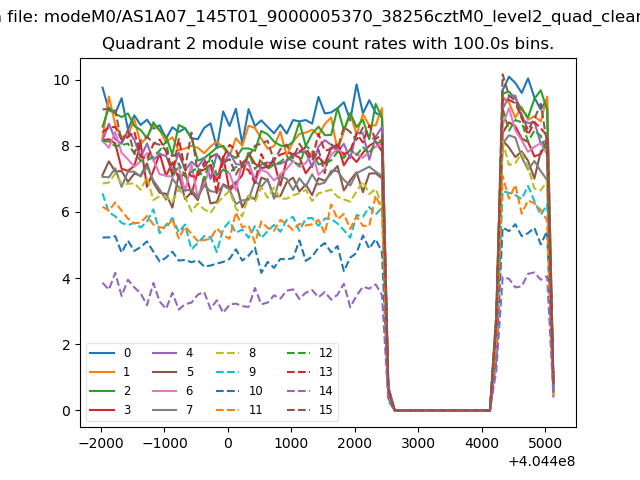
| Module-wise count rates for Quadrant B Data is divided into 100 sec bins |
 |
 |
| Module-wise count rates for Quadrant C Data is divided into 100 sec bins |
 |
 |
| Module-wise count rates for Quadrant D Data is divided into 100 sec bins |
 |
 |
| Parameter | Plot |
|---|---|
| CZT HV Monitor | 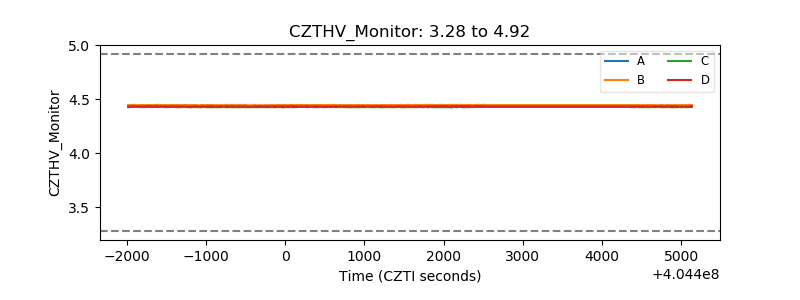 |
| D_VDD | 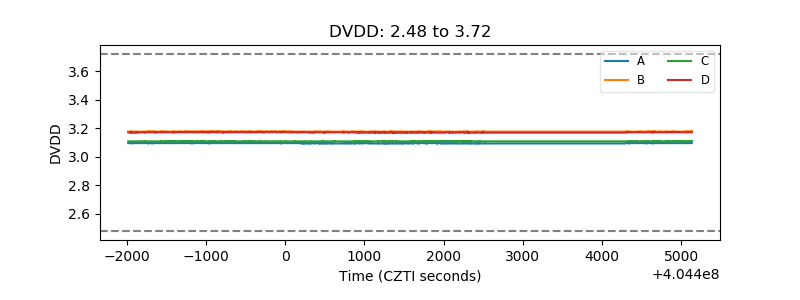 |
| Temperature 1 | 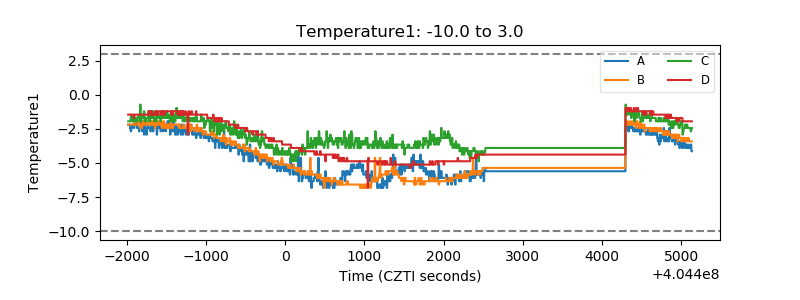 |
| Veto HV Monitor | 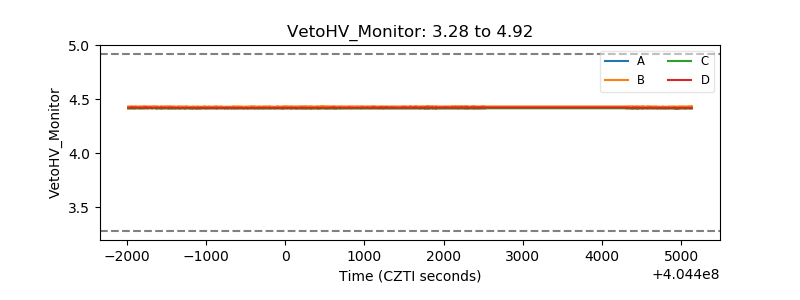 |
| Veto LLD | 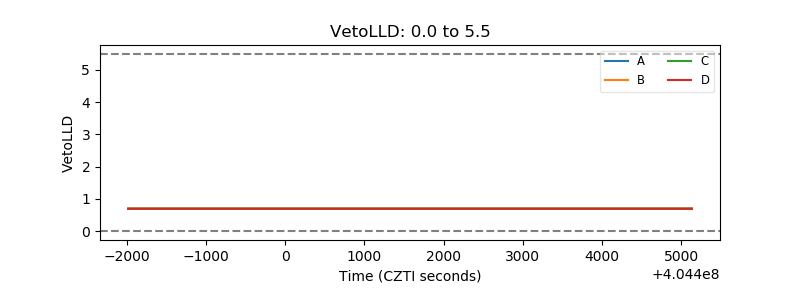 |
| Alpha Counter | 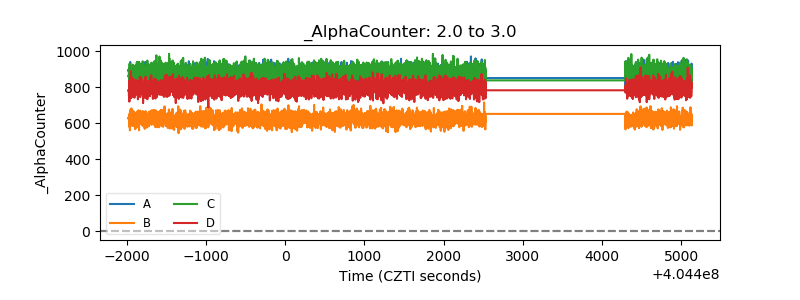 |
| _CPM_Rate | 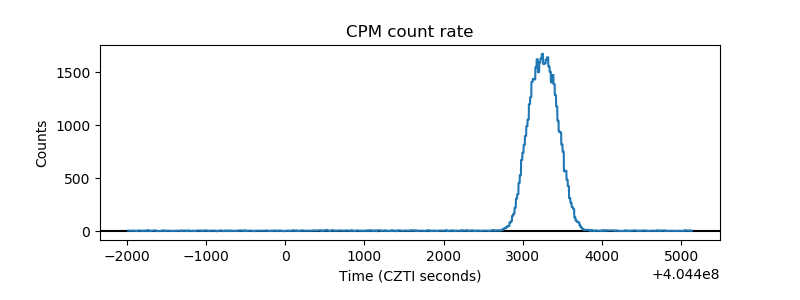 |
| CZT Counter | 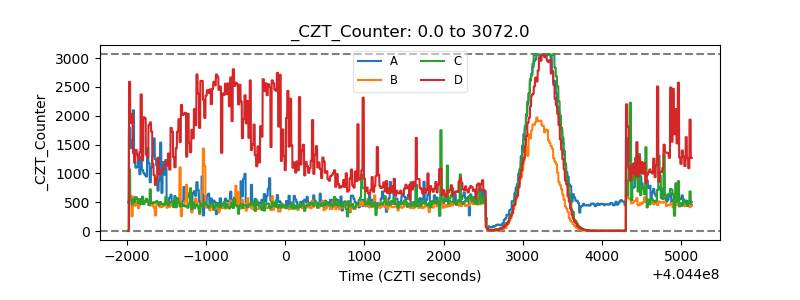 |
| +2.5 Volts monitor | 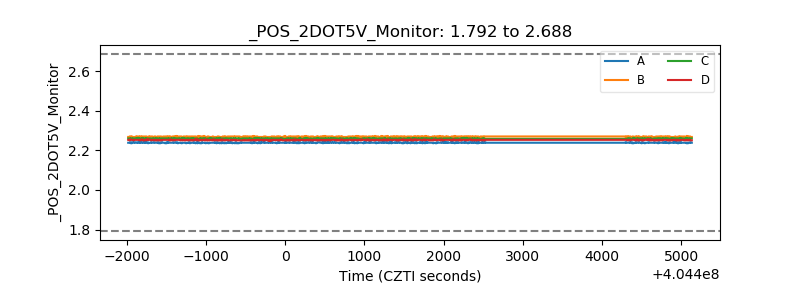 |
| +5 Volts monitor | 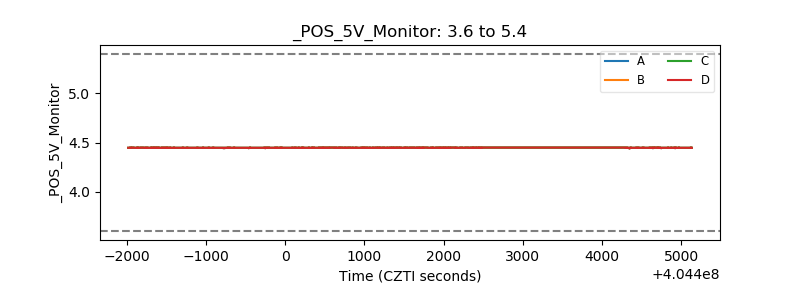 |
| _ROLL_ROT | 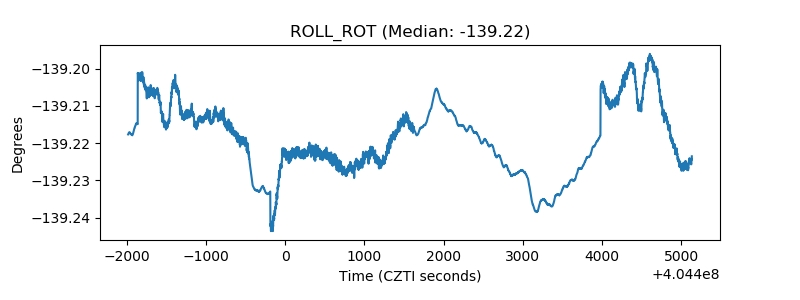 |
| _Roll_DEC | 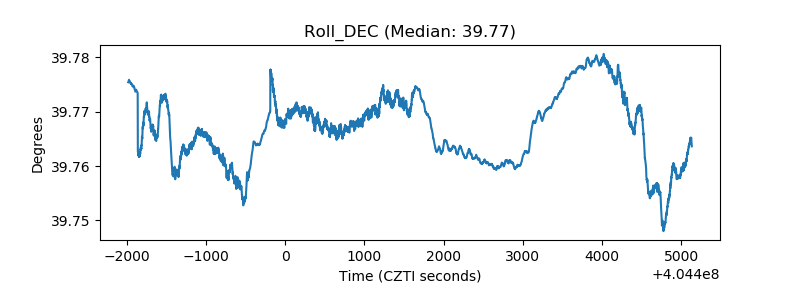 |
| _Roll_RA | 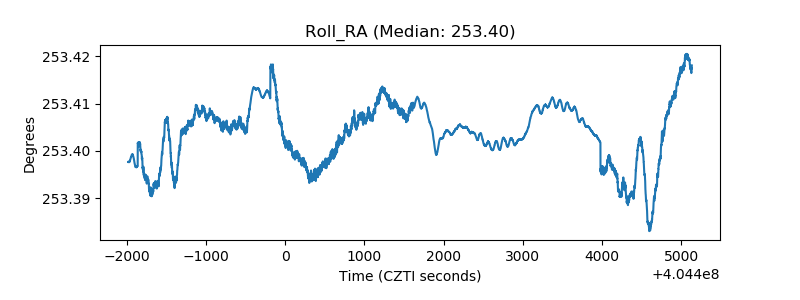 |
| Veto Counter | 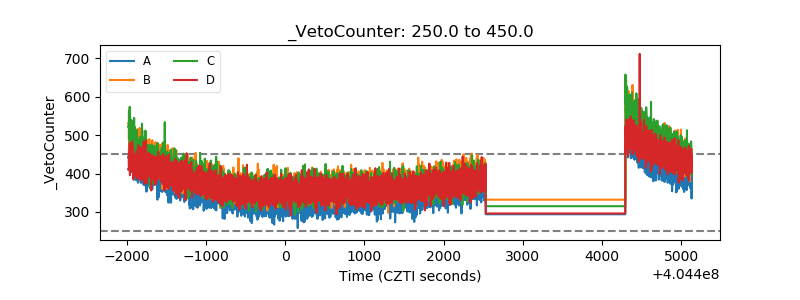 |