| Param | Original file | Final file |
|---|---|---|
| Filename | modeM0/AS1A07_145T01_9000005370_38258cztM0_level2.fits | modeM0/AS1A07_145T01_9000005370_38258cztM0_level2_quad_clean.evt |
| Size (bytes) | 398,064,960 | 93,225,600 |
| Size | 379.6 MB | 88.9 MB |
| Events in quadrant A | 2,846,788 | 635,818 |
| Events in quadrant B | 3,080,315 | 626,753 |
| Events in quadrant C | 2,711,789 | 632,859 |
| Events in quadrant D | 5,704,608 | 574,196 |
| Mode M9 | |||
|---|---|---|---|
| Quadrant | BADHDUFLAG | Total packets | Discarded packets |
| A | 0 | 27 | 0 |
| B | 0 | 27 | 0 |
| C | 0 | 27 | 0 |
| D | 0 | 28 | 0 |
| Mode SS | |||
|---|---|---|---|
| Quadrant | BADHDUFLAG | Total packets | Discarded packets |
| A | 0 | 102 | 0 |
| B | 0 | 102 | 0 |
| C | 0 | 102 | 0 |
| D | 0 | 102 | 0 |
| Mode M0 | |||
|---|---|---|---|
| Quadrant | BADHDUFLAG | Total packets | Discarded packets |
| A | 0 | 11537 | 3 |
| B | 0 | 12347 | 2 |
| C | 0 | 10969 | 2 |
| D | 0 | 20623 | 2 |
| Quadrant | Total seconds | Saturated seconds | Saturation percentage |
|---|---|---|---|
| A | 5044 | 14 | 0.277557% |
| B | 5044 | 285 | 5.650278% |
| C | 5044 | 22 | 0.436162% |
| D | 5044 | 144 | 2.854877% |
Noise dominated data is calculated using 1-second bins in cleaned event files. If a bin has >2000 counts, and if more than 50% of those come from <1% of pixels, then it is considered to be noise-dominated and hence unusable.
| Quadrant | # 1 sec bins | Bins with >0 counts | Bins with >2000 counts | High rate bins dominated by noise | Noise dominated (total time) | Noise dominated (detector-on time) | Marked lightcurve |
|---|---|---|---|---|---|---|---|
| A | 7046 | 5045 | 8 | 8 | 0.11% | 0.16% | 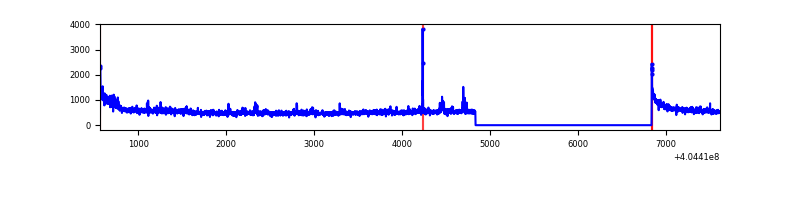 |
| B | 7046 | 5045 | 207 | 207 | 2.94% | 4.10% | 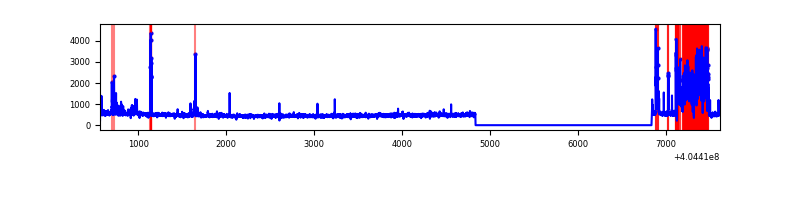 |
| C | 7046 | 5045 | 13 | 13 | 0.18% | 0.26% | 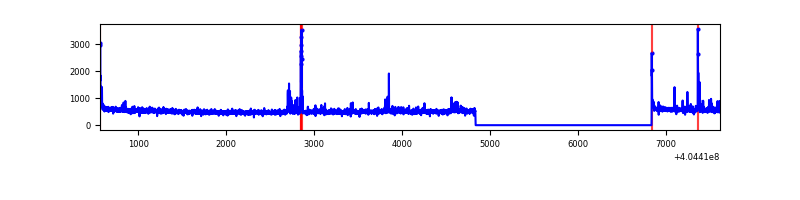 |
| D | 7046 | 5045 | 170 | 170 | 2.41% | 3.37% | 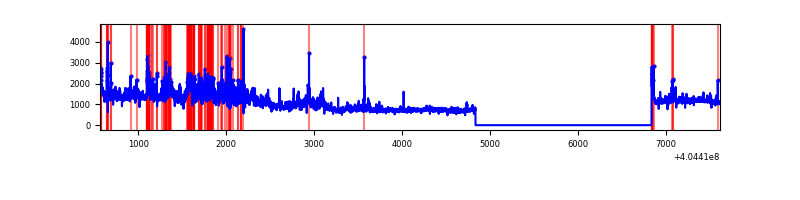 |
Top three noisy pixels from each quadrant. If the there are fewer than three noisy pixels in the level2.evt file, extra rows are filled as -1
| Pixel properties | Quadrant properties | ||||||
|---|---|---|---|---|---|---|---|
| Quadrant | DetID | PixID | Counts | Sigma | Mean | Median | Sigma |
| A | 10 | 83 | 374477 | 3116.56 | 592 | 582 | 120.0 |
| A | 12 | 16 | 94699 | 784.5 | 592 | 582 | 120.0 |
| A | 12 | 189 | 38218 | 313.71 | 592 | 582 | 120.0 |
| B | 4 | 81 | 577393 | 5229.69 | 584 | 567 | 110.3 |
| B | 5 | 172 | 108296 | 976.71 | 584 | 567 | 110.3 |
| B | 0 | 229 | 52759 | 473.19 | 584 | 567 | 110.3 |
| C | 15 | 214 | 213432 | 1557.6 | 592 | 599 | 136.6 |
| C | 14 | 254 | 96994 | 705.46 | 592 | 599 | 136.6 |
| C | 15 | 208 | 43668 | 315.2 | 592 | 599 | 136.6 |
| D | 10 | 203 | 2003096 | 14220.87 | 582 | 567 | 140.8 |
| D | 12 | 235 | 1220214 | 8661.27 | 582 | 567 | 140.8 |
| D | 12 | 233 | 66093 | 465.33 | 582 | 567 | 140.8 |
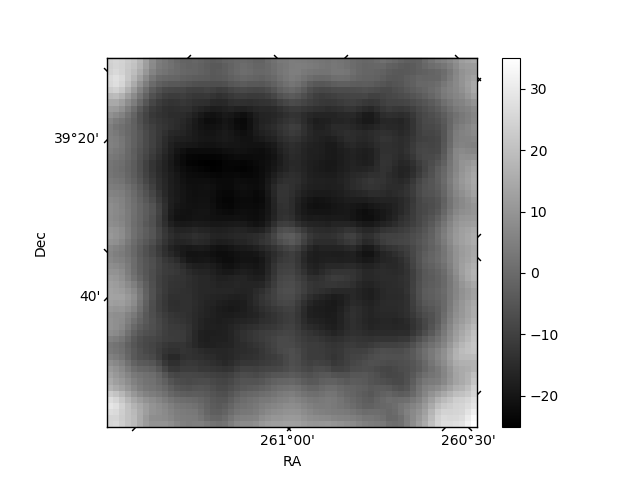
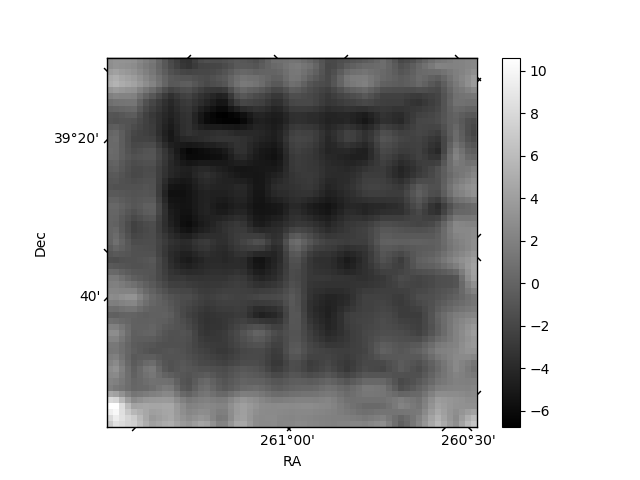
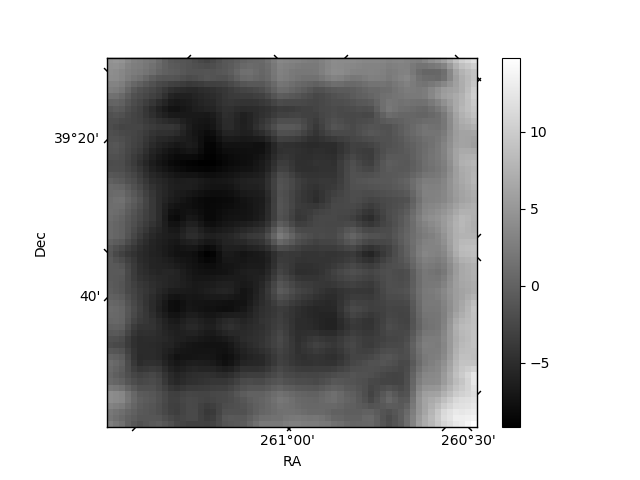
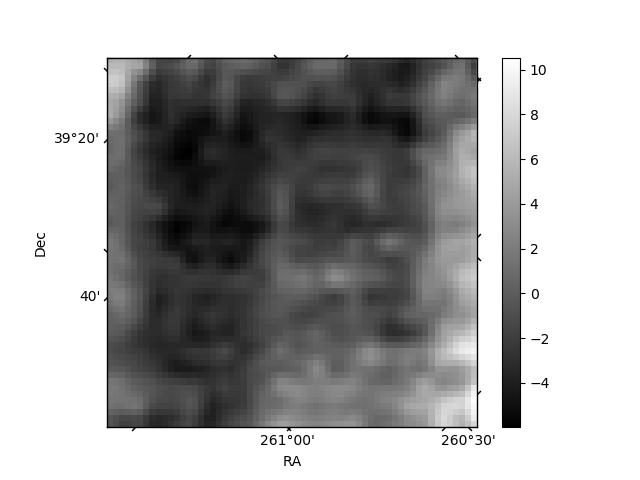
Histogram calculated using DETX and DETY for each event in the final _common_clean file
| Quadrant A | 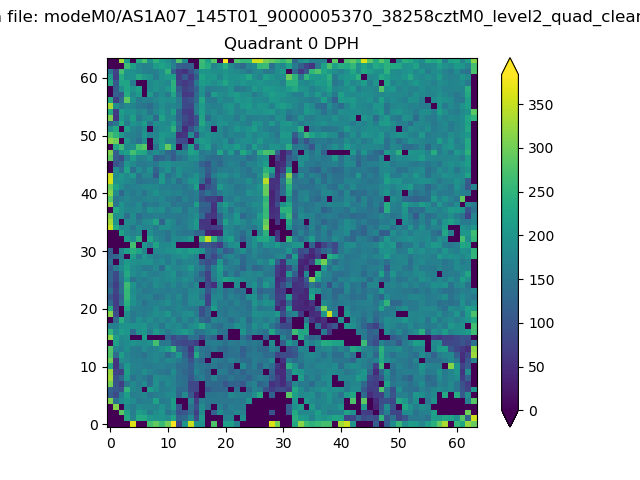 |
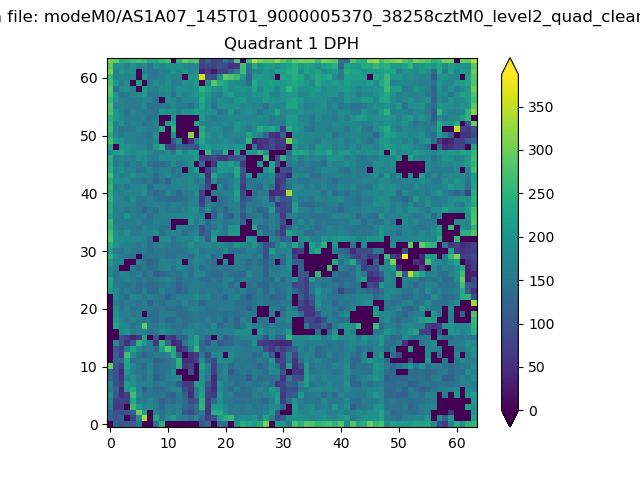 |
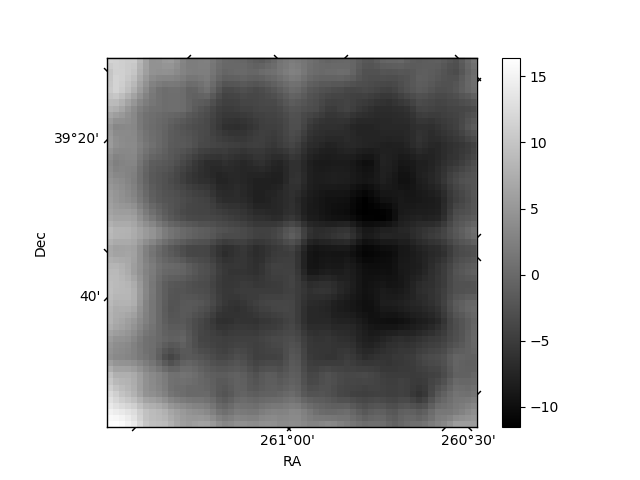
Quadrant B |
|---|---|---|---|
| Quadrant D | 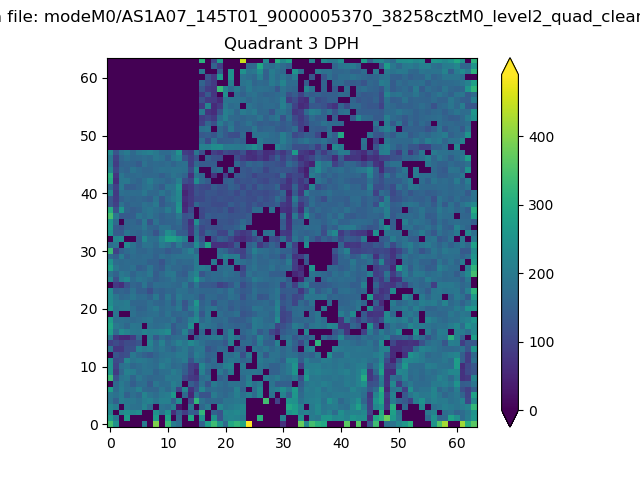 |
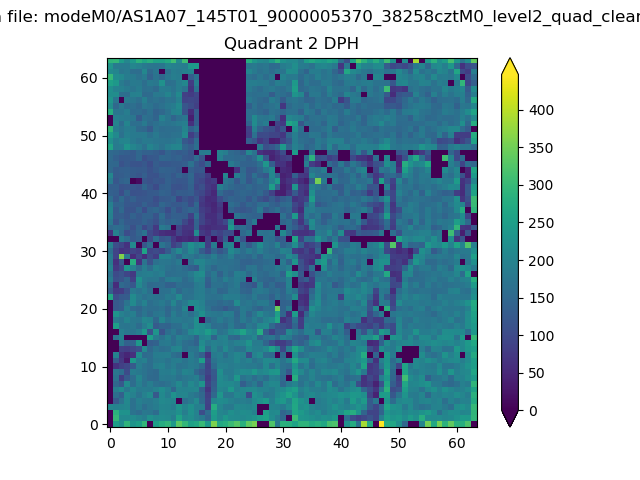 |
Quadrant C |
| Plot type | Count rate plots | Images |
|---|---|---|
| Comparison with Poisson distribution Blue bars denote a histogram of data divided into 1 sec bins. Red curve is a Poisson curve with rate = median count rate of data. |
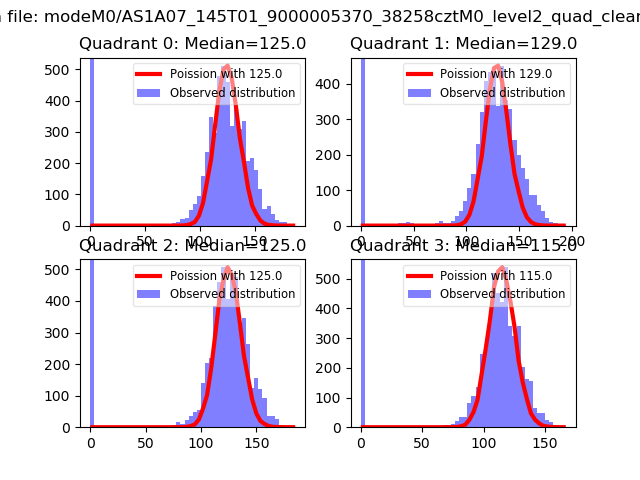 |
 |
| Quadrant-wise count rates Data is divided into 100 sec bins |
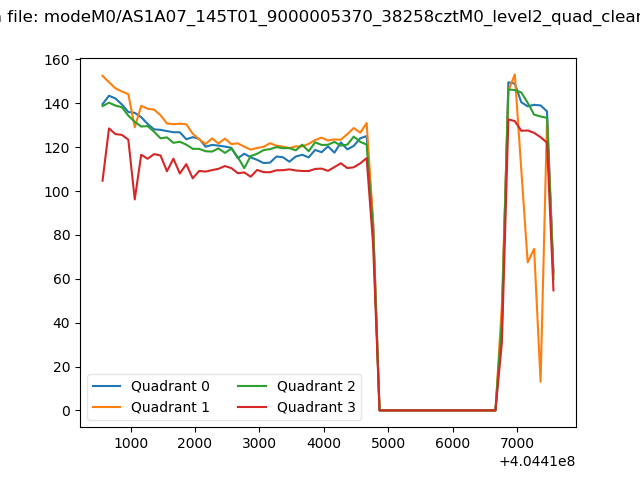 |
|
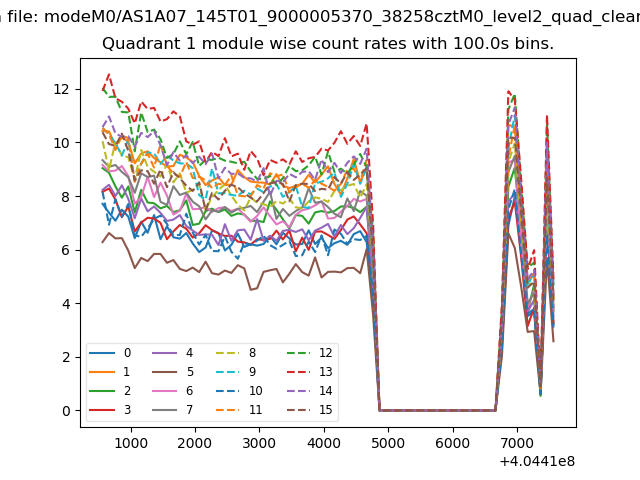
| Module-wise count rates for Quadrant A Data is divided into 100 sec bins |
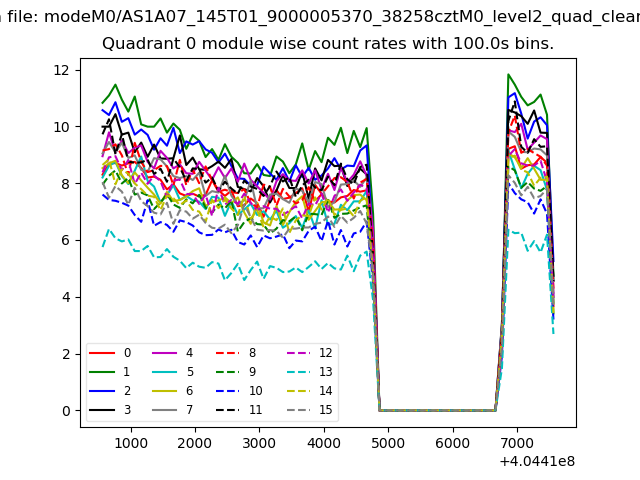 |
 |
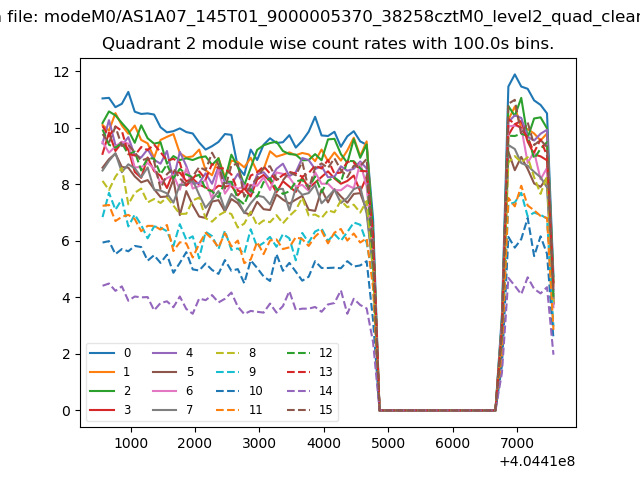
| Module-wise count rates for Quadrant B Data is divided into 100 sec bins |
 |
 |
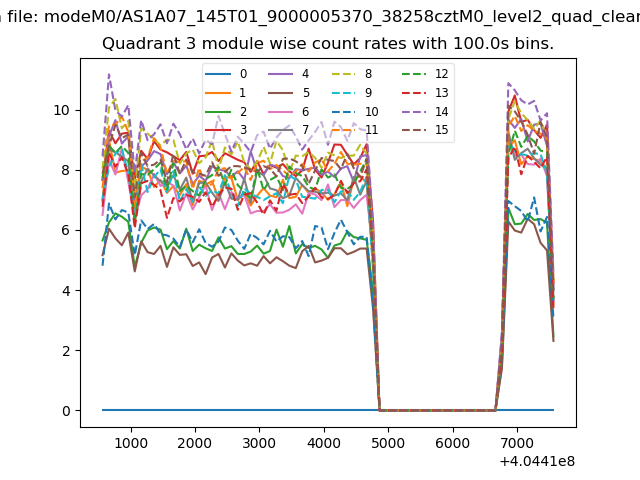
| Module-wise count rates for Quadrant C Data is divided into 100 sec bins |
 |
 |
| Module-wise count rates for Quadrant D Data is divided into 100 sec bins |
 |
 |
| Parameter | Plot |
|---|---|
| CZT HV Monitor | 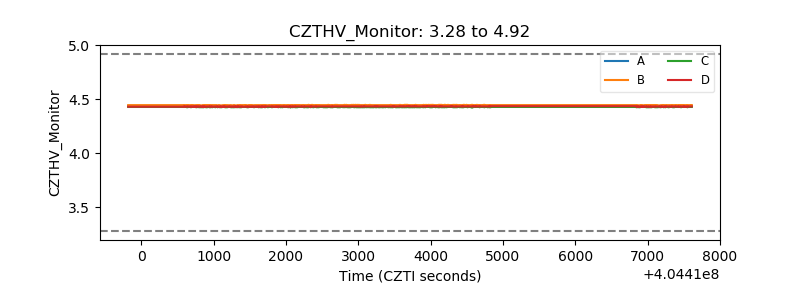 |
| D_VDD | 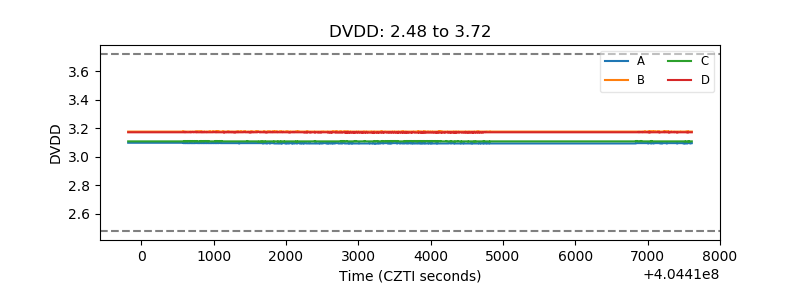 |
| Temperature 1 | 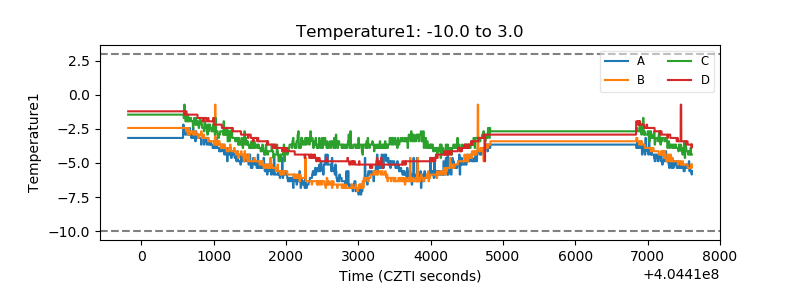 |
| Veto HV Monitor | 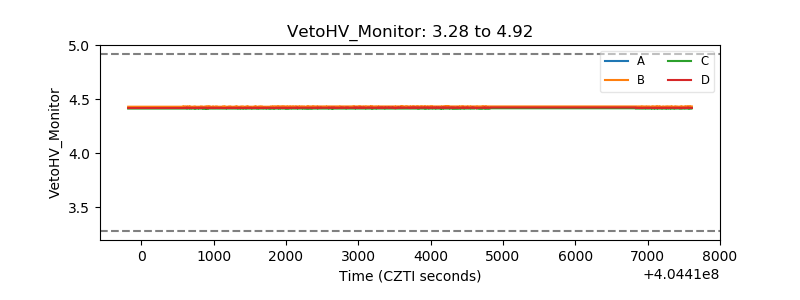 |
| Veto LLD | 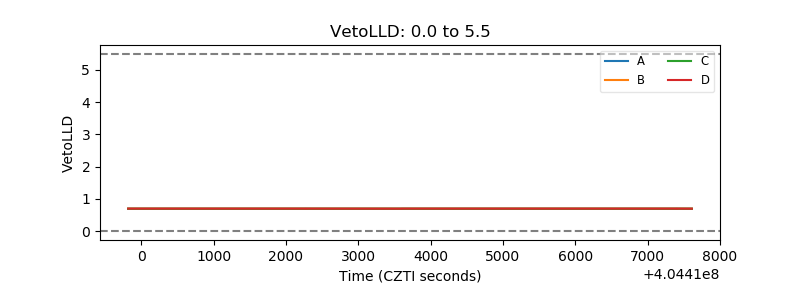 |
| Alpha Counter | 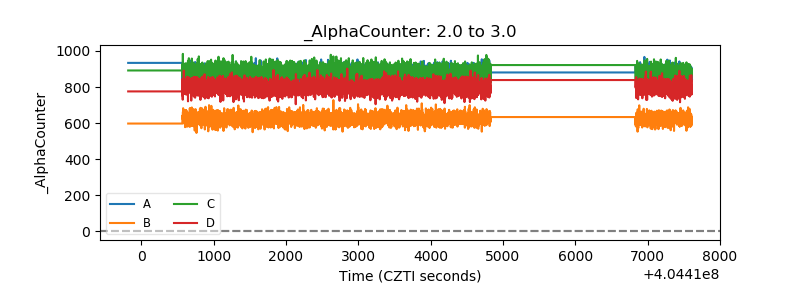 |
| _CPM_Rate | 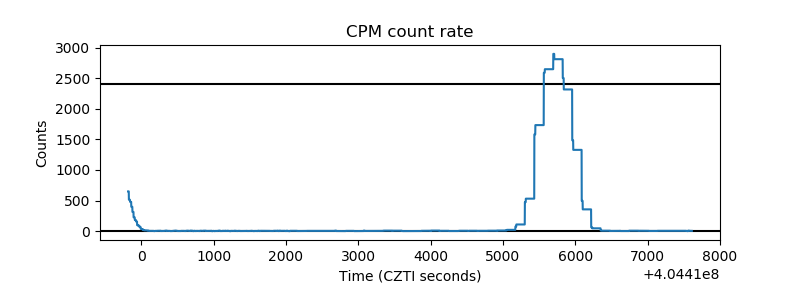 |
| CZT Counter | 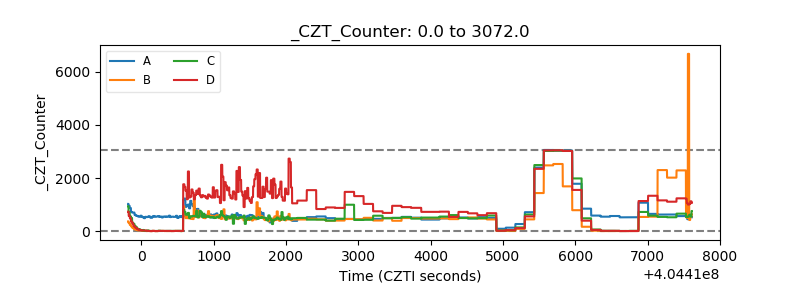 |
| +2.5 Volts monitor | 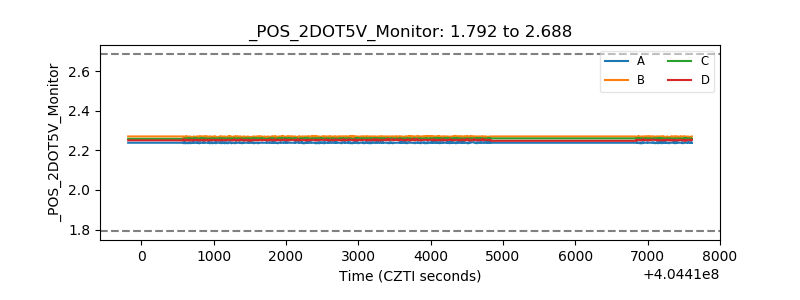 |
| +5 Volts monitor | 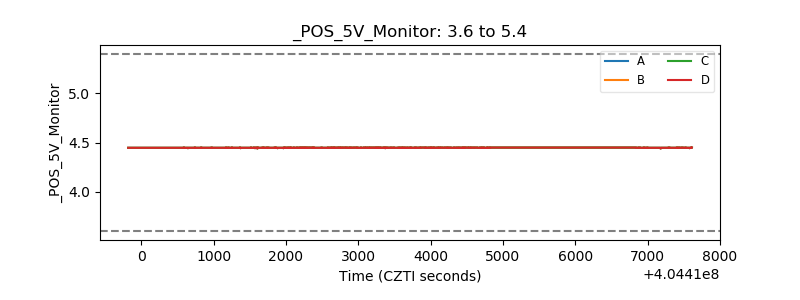 |
| _ROLL_ROT | 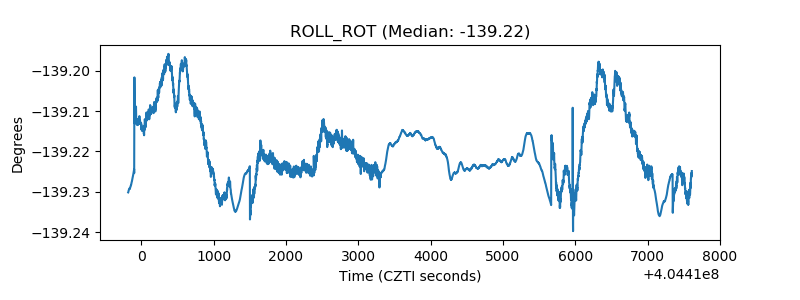 |
| _Roll_DEC | 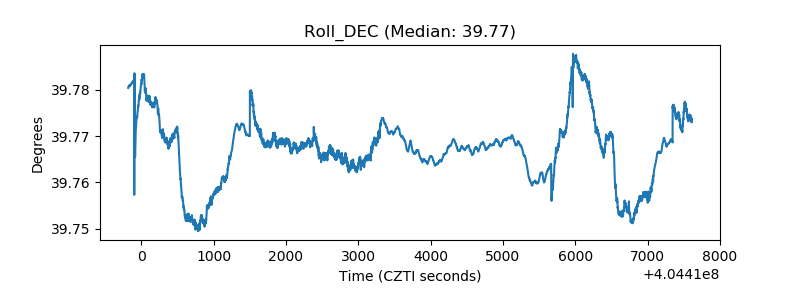 |
| _Roll_RA | 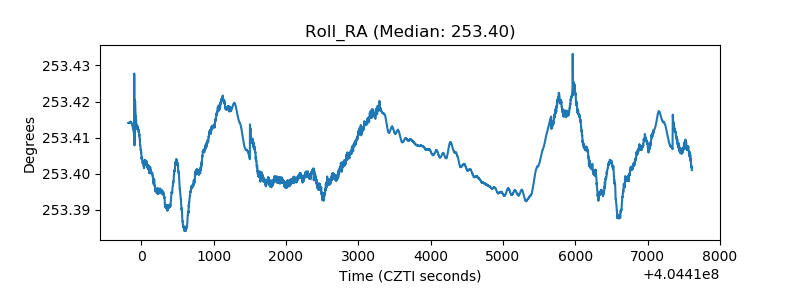 |
| Veto Counter | 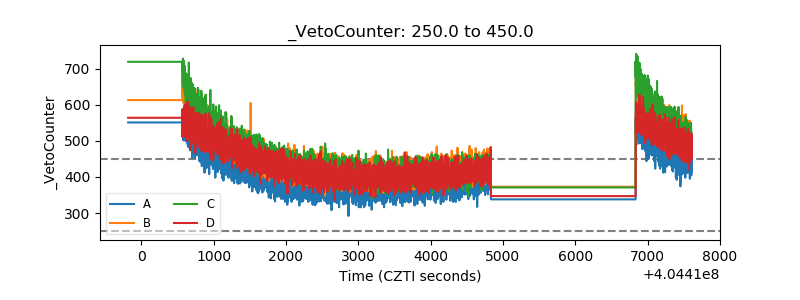 |