| Param | Original file | Final file |
|---|---|---|
| Filename | modeM0/AS1A07_145T01_9000005370_38259cztM0_level2.fits | modeM0/AS1A07_145T01_9000005370_38259cztM0_level2_quad_clean.evt |
| Size (bytes) | 378,233,280 | 90,858,240 |
| Size | 360.7 MB | 86.6 MB |
| Events in quadrant A | 2,892,743 | 622,510 |
| Events in quadrant B | 3,149,608 | 611,620 |
| Events in quadrant C | 2,892,364 | 619,426 |
| Events in quadrant D | 4,687,701 | 556,507 |
| Mode M9 | |||
|---|---|---|---|
| Quadrant | BADHDUFLAG | Total packets | Discarded packets |
| A | 0 | 31 | 0 |
| B | 0 | 31 | 0 |
| C | 0 | 31 | 0 |
| D | 0 | 32 | 0 |
| Mode SS | |||
|---|---|---|---|
| Quadrant | BADHDUFLAG | Total packets | Discarded packets |
| A | 0 | 98 | 0 |
| B | 0 | 98 | 0 |
| C | 0 | 98 | 0 |
| D | 0 | 98 | 0 |
| Mode M0 | |||
|---|---|---|---|
| Quadrant | BADHDUFLAG | Total packets | Discarded packets |
| A | 0 | 11658 | 3 |
| B | 0 | 12327 | 2 |
| C | 0 | 11424 | 2 |
| D | 0 | 17610 | 2 |
| Quadrant | Total seconds | Saturated seconds | Saturation percentage |
|---|---|---|---|
| A | 4870 | 12 | 0.246407% |
| B | 4870 | 307 | 6.303901% |
| C | 4870 | 61 | 1.252567% |
| D | 4870 | 165 | 3.388090% |
Noise dominated data is calculated using 1-second bins in cleaned event files. If a bin has >2000 counts, and if more than 50% of those come from <1% of pixels, then it is considered to be noise-dominated and hence unusable.
| Quadrant | # 1 sec bins | Bins with >0 counts | Bins with >2000 counts | High rate bins dominated by noise | Noise dominated (total time) | Noise dominated (detector-on time) | Marked lightcurve |
|---|---|---|---|---|---|---|---|
| A | 6962 | 4871 | 10 | 10 | 0.14% | 0.21% | 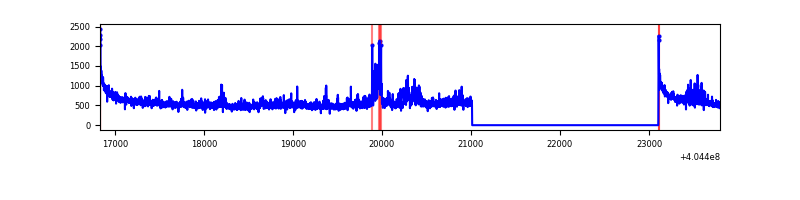 |
| B | 6962 | 4871 | 227 | 227 | 3.26% | 4.66% | 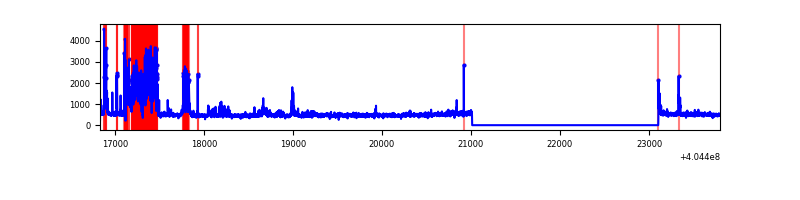 |
| C | 6962 | 4871 | 43 | 43 | 0.62% | 0.88% | 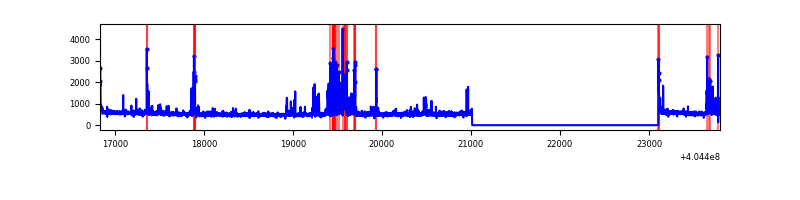 |
| D | 6962 | 4871 | 143 | 143 | 2.05% | 2.94% | 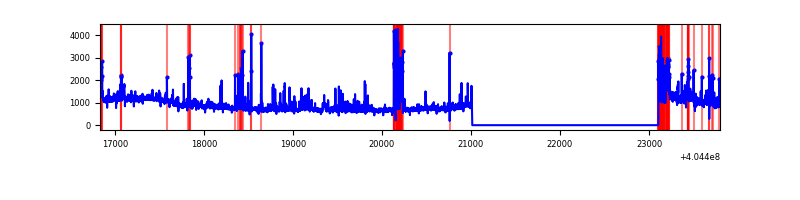 |
Top three noisy pixels from each quadrant. If the there are fewer than three noisy pixels in the level2.evt file, extra rows are filled as -1
| Pixel properties | Quadrant properties | ||||||
|---|---|---|---|---|---|---|---|
| Quadrant | DetID | PixID | Counts | Sigma | Mean | Median | Sigma |
| A | 10 | 83 | 354076 | 3048.64 | 575 | 563 | 116.0 |
| A | 12 | 16 | 222260 | 1911.88 | 575 | 563 | 116.0 |
| A | 12 | 189 | 42347 | 360.34 | 575 | 563 | 116.0 |
| B | 4 | 81 | 680853 | 6319.55 | 568 | 555 | 107.6 |
| B | 5 | 172 | 116959 | 1081.32 | 568 | 555 | 107.6 |
| B | 0 | 199 | 83421 | 769.77 | 568 | 555 | 107.6 |
| C | 9 | 236 | 237428 | 1786.36 | 576 | 583 | 132.6 |
| C | 15 | 214 | 207316 | 1559.25 | 576 | 583 | 132.6 |
| C | 14 | 254 | 67531 | 504.94 | 576 | 583 | 132.6 |
| D | 10 | 203 | 1691741 | 12299.43 | 562 | 549 | 137.5 |
| D | 12 | 235 | 314656 | 2284.39 | 562 | 549 | 137.5 |
| D | 2 | 250 | 135176 | 979.09 | 562 | 549 | 137.5 |
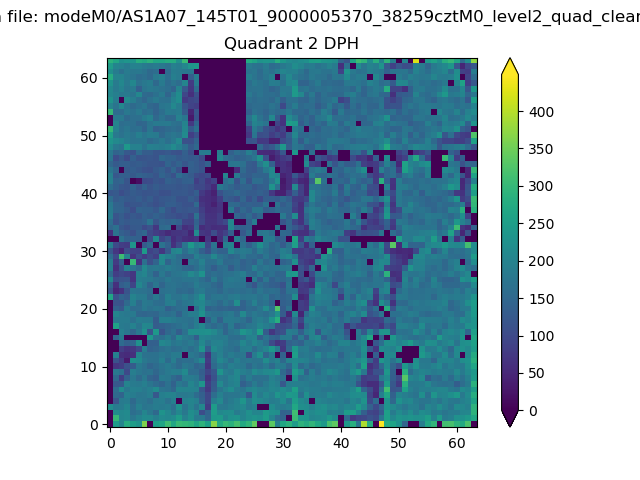
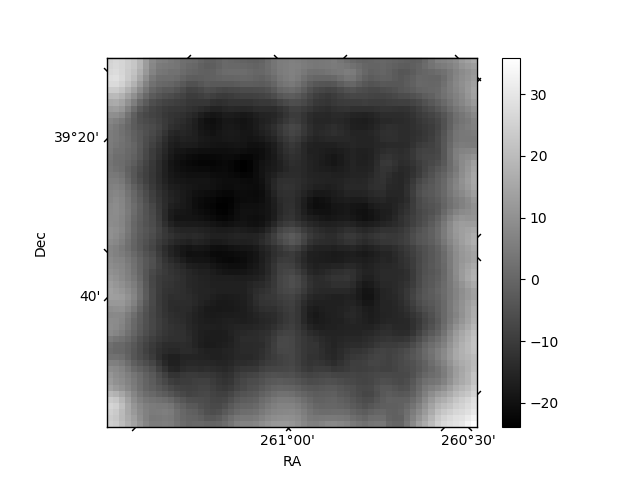
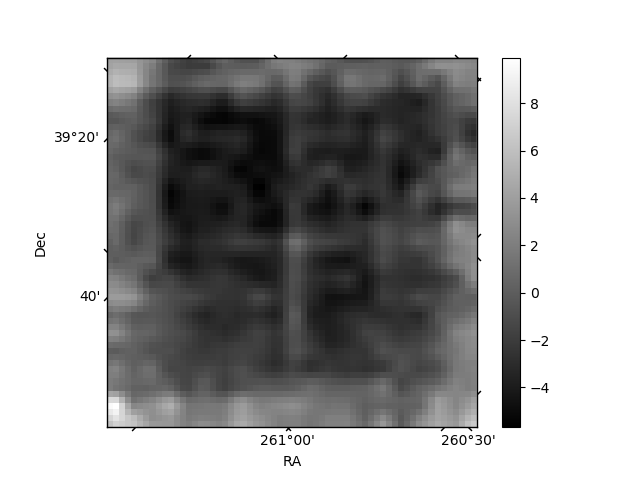
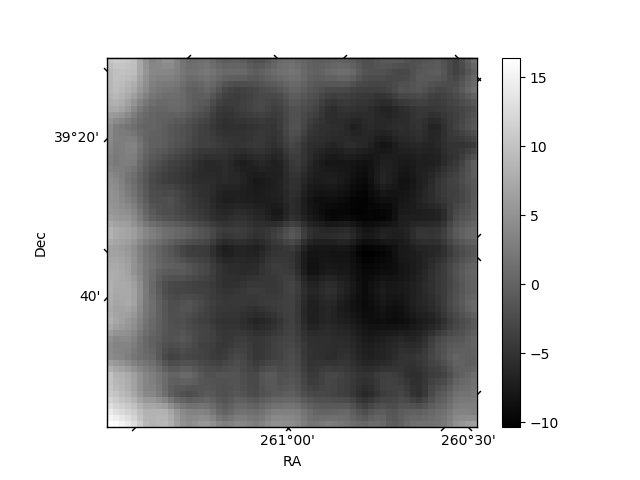
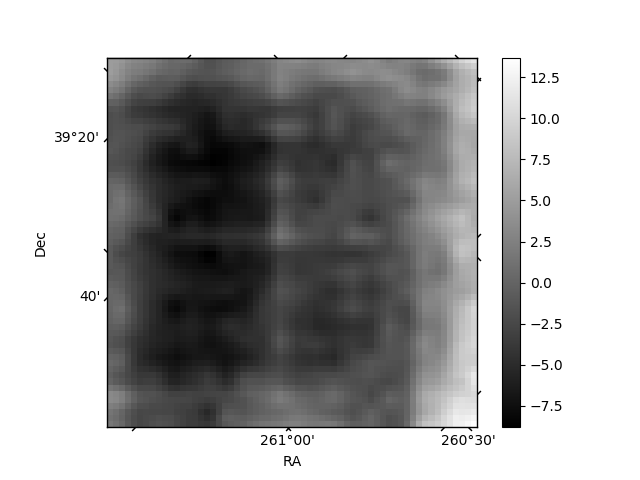
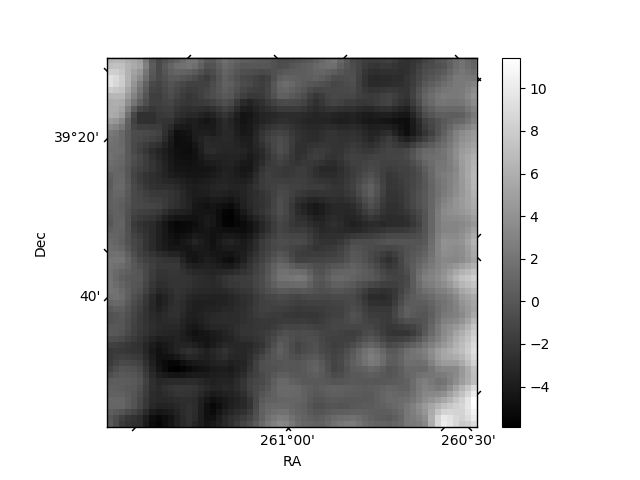
Histogram calculated using DETX and DETY for each event in the final _common_clean file
| Quadrant A | 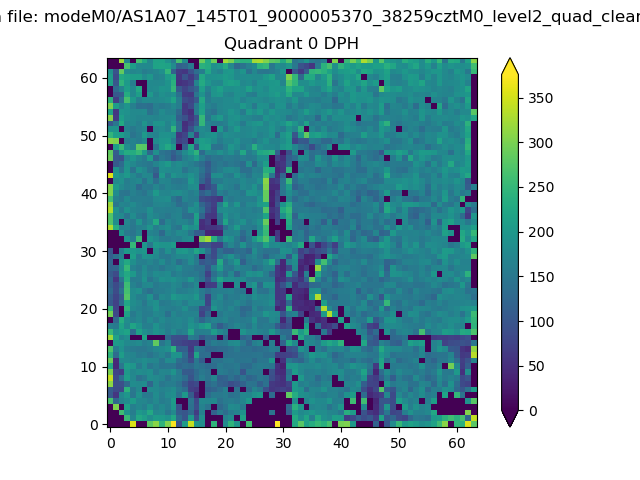 |
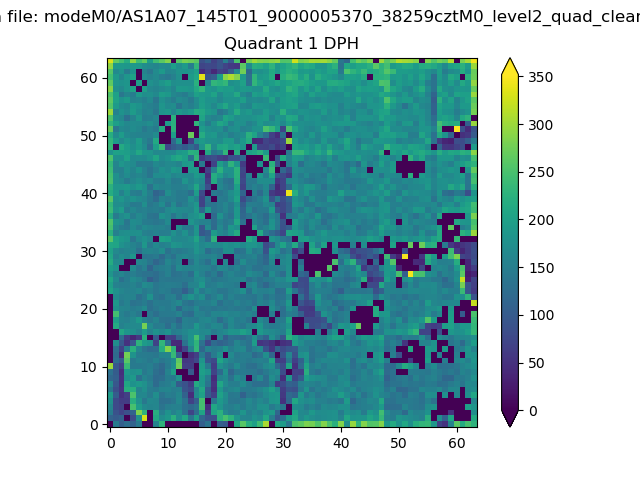 |
Quadrant B |
|---|---|---|---|
| Quadrant D | 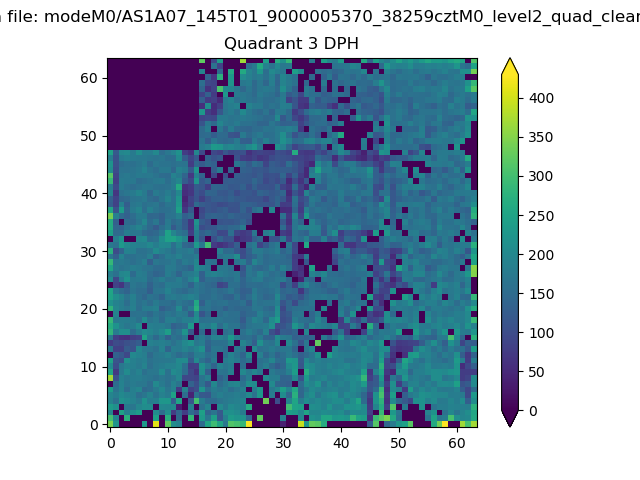 |
 |
Quadrant C |
| Plot type | Count rate plots | Images |
|---|---|---|
| Comparison with Poisson distribution Blue bars denote a histogram of data divided into 1 sec bins. Red curve is a Poisson curve with rate = median count rate of data. |
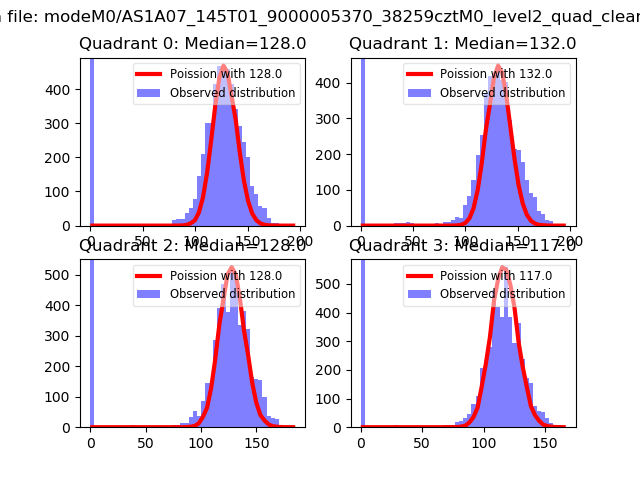 |
 |
| Quadrant-wise count rates Data is divided into 100 sec bins |
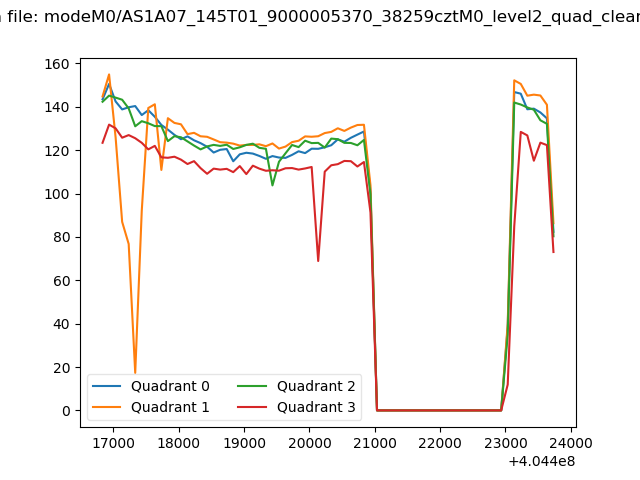 |
|
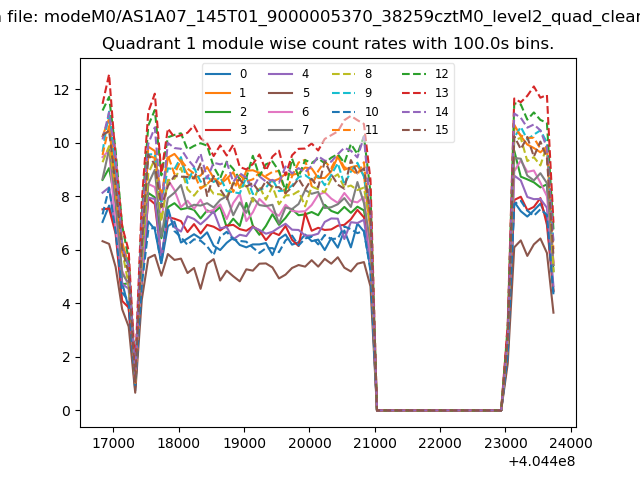
| Module-wise count rates for Quadrant A Data is divided into 100 sec bins |
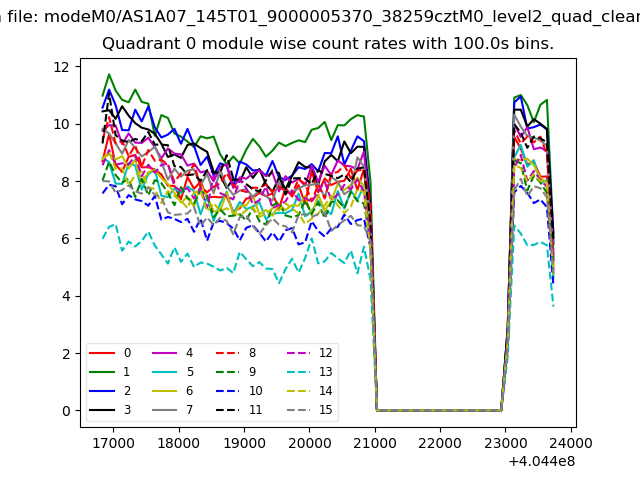 |
 |
| Module-wise count rates for Quadrant B Data is divided into 100 sec bins |
 |
 |
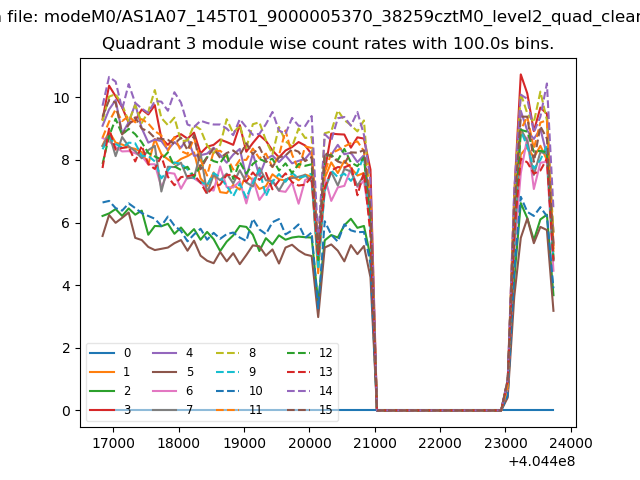
| Module-wise count rates for Quadrant C Data is divided into 100 sec bins |
 |
 |
| Module-wise count rates for Quadrant D Data is divided into 100 sec bins |
 |
 |
| Parameter | Plot |
|---|---|
| CZT HV Monitor | 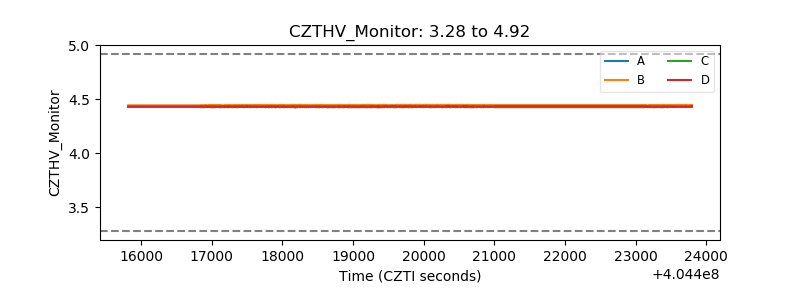 |
| D_VDD | 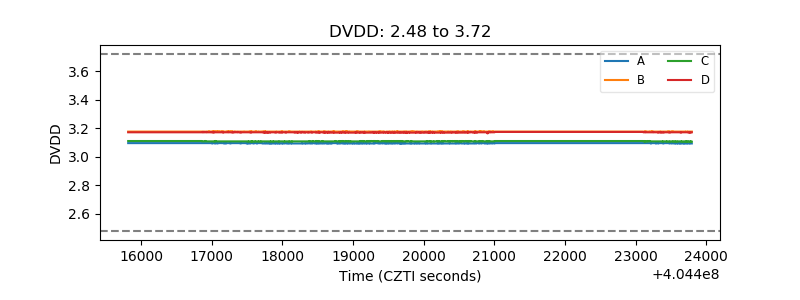 |
| Temperature 1 | 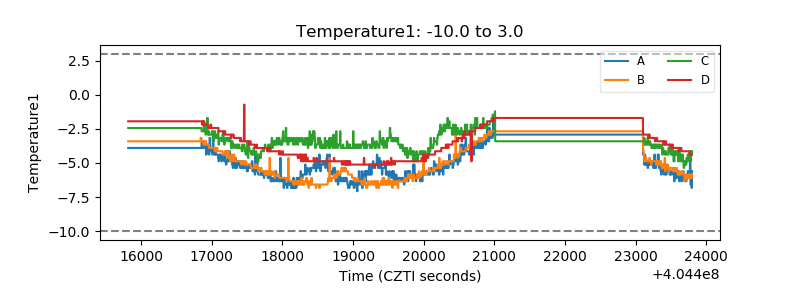 |
| Veto HV Monitor | 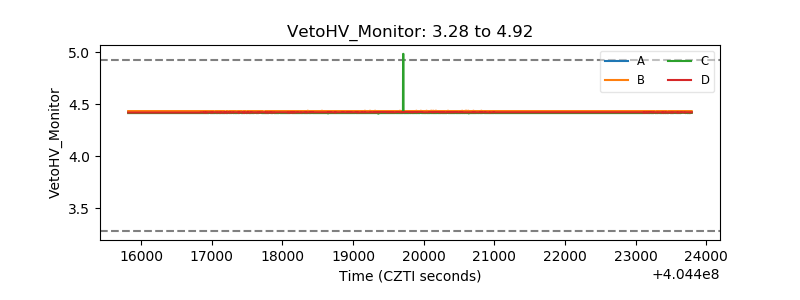 |
| Veto LLD | 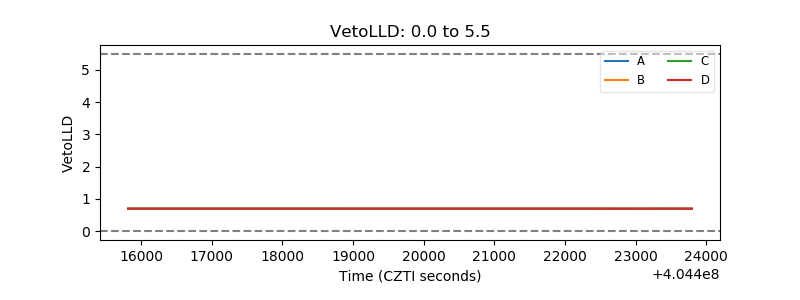 |
| Alpha Counter | 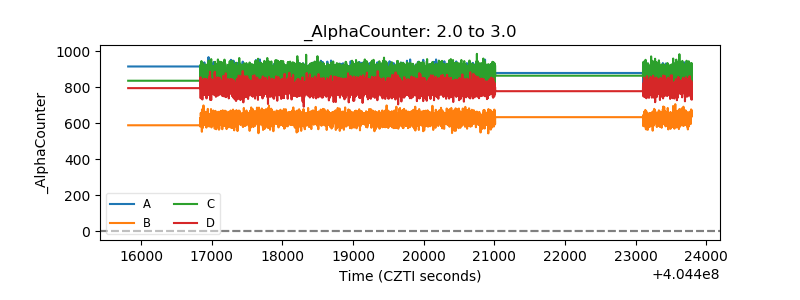 |
| _CPM_Rate | 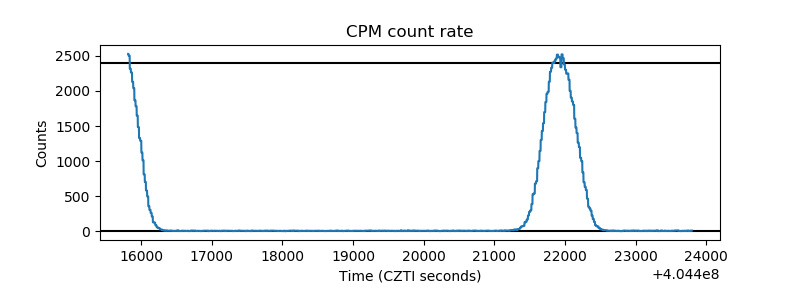 |
| CZT Counter | 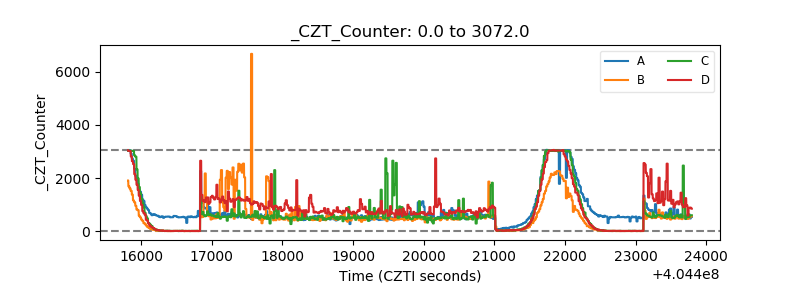 |
| +2.5 Volts monitor | 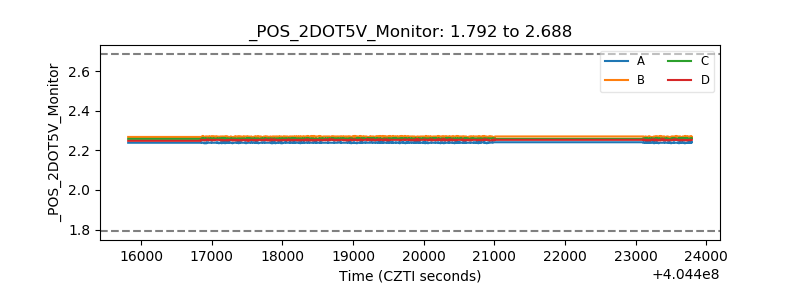 |
| +5 Volts monitor | 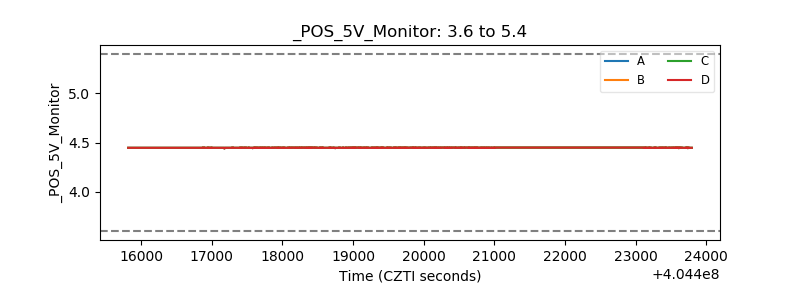 |
| _ROLL_ROT | 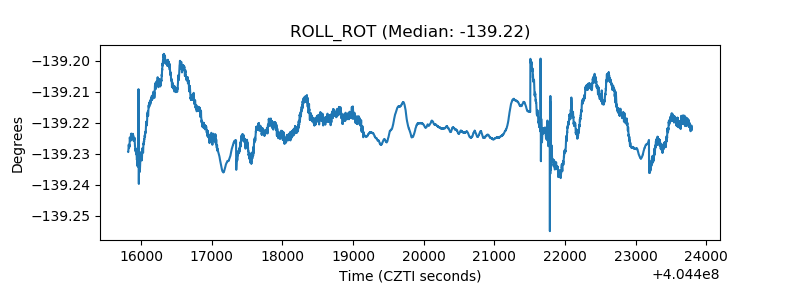 |
| _Roll_DEC | 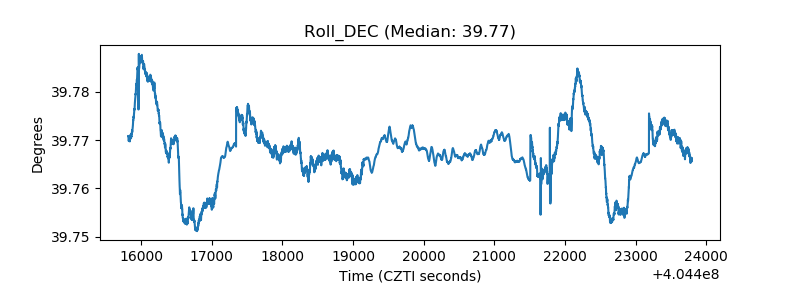 |
| _Roll_RA | 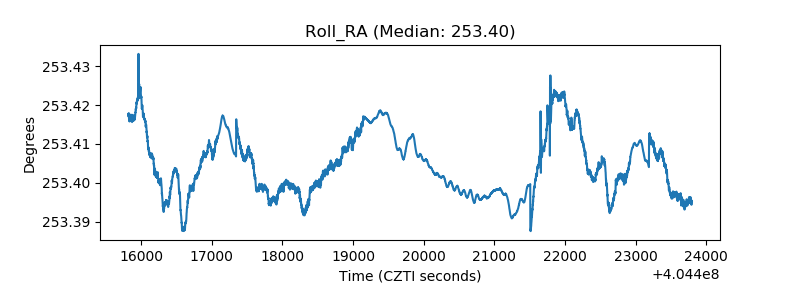 |
| Veto Counter | 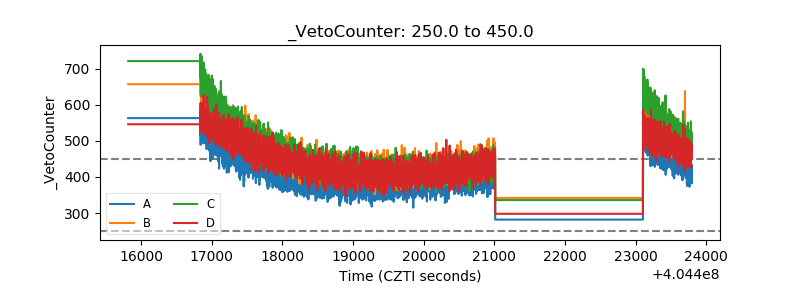 |