| Param | Original file | Final file |
|---|---|---|
| Filename | modeM0/AS1A07_145T01_9000005370_38260cztM0_level2.fits | modeM0/AS1A07_145T01_9000005370_38260cztM0_level2_quad_clean.evt |
| Size (bytes) | 378,141,120 | 96,361,920 |
| Size | 360.6 MB | 91.9 MB |
| Events in quadrant A | 2,837,317 | 649,995 |
| Events in quadrant B | 2,483,925 | 677,897 |
| Events in quadrant C | 3,058,893 | 644,802 |
| Events in quadrant D | 5,212,533 | 580,054 |
| Mode M9 | |||
|---|---|---|---|
| Quadrant | BADHDUFLAG | Total packets | Discarded packets |
| A | 0 | 32 | 0 |
| B | 0 | 32 | 0 |
| C | 0 | 32 | 0 |
| D | 0 | 33 | 0 |
| Mode SS | |||
|---|---|---|---|
| Quadrant | BADHDUFLAG | Total packets | Discarded packets |
| A | 0 | 108 | 0 |
| B | 0 | 108 | 0 |
| C | 0 | 108 | 0 |
| D | 0 | 108 | 0 |
| Mode M0 | |||
|---|---|---|---|
| Quadrant | BADHDUFLAG | Total packets | Discarded packets |
| A | 0 | 11534 | 3 |
| B | 0 | 10642 | 2 |
| C | 0 | 12183 | 2 |
| D | 0 | 19510 | 2 |
| Quadrant | Total seconds | Saturated seconds | Saturation percentage |
|---|---|---|---|
| A | 5211 | 11 | 0.211092% |
| B | 5211 | 10 | 0.191902% |
| C | 5211 | 66 | 1.266552% |
| D | 5211 | 195 | 3.742084% |
Noise dominated data is calculated using 1-second bins in cleaned event files. If a bin has >2000 counts, and if more than 50% of those come from <1% of pixels, then it is considered to be noise-dominated and hence unusable.
| Quadrant | # 1 sec bins | Bins with >0 counts | Bins with >2000 counts | High rate bins dominated by noise | Noise dominated (total time) | Noise dominated (detector-on time) | Marked lightcurve |
|---|---|---|---|---|---|---|---|
| A | 7364 | 5212 | 5 | 5 | 0.07% | 0.10% | 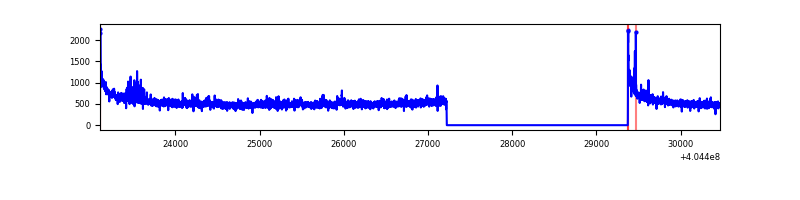 |
| B | 7364 | 5212 | 2 | 2 | 0.03% | 0.04% | 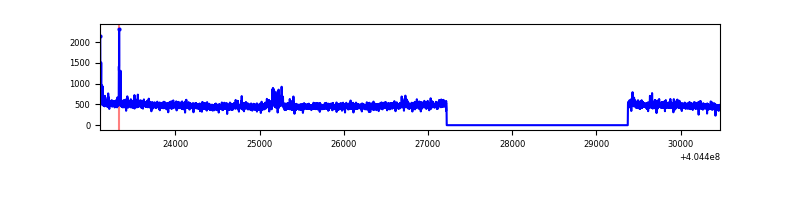 |
| C | 7364 | 5212 | 54 | 54 | 0.73% | 1.04% | 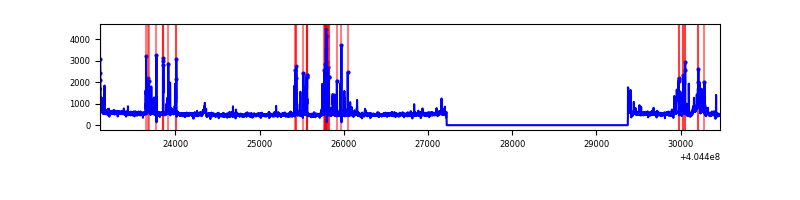 |
| D | 7364 | 5212 | 175 | 175 | 2.38% | 3.36% | 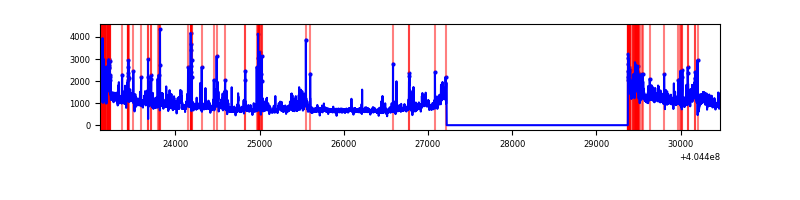 |
Top three noisy pixels from each quadrant. If the there are fewer than three noisy pixels in the level2.evt file, extra rows are filled as -1
| Pixel properties | Quadrant properties | ||||||
|---|---|---|---|---|---|---|---|
| Quadrant | DetID | PixID | Counts | Sigma | Mean | Median | Sigma |
| A | 10 | 83 | 365435 | 3019.35 | 604 | 593 | 120.8 |
| A | 12 | 16 | 64196 | 526.36 | 604 | 593 | 120.8 |
| A | 12 | 189 | 47593 | 388.96 | 604 | 593 | 120.8 |
| B | 5 | 172 | 49512 | 424.18 | 611 | 595 | 115.3 |
| B | 12 | 111 | 14030 | 116.5 | 611 | 595 | 115.3 |
| B | 11 | 111 | 12924 | 106.91 | 611 | 595 | 115.3 |
| C | 14 | 254 | 419775 | 3014.32 | 603 | 607 | 139.1 |
| C | 15 | 214 | 218765 | 1568.81 | 603 | 607 | 139.1 |
| C | 15 | 208 | 28860 | 203.17 | 603 | 607 | 139.1 |
| D | 10 | 203 | 1607926 | 11153.52 | 590 | 574 | 144.1 |
| D | 12 | 235 | 808719 | 5607.77 | 590 | 574 | 144.1 |
| D | 2 | 250 | 160797 | 1111.79 | 590 | 574 | 144.1 |
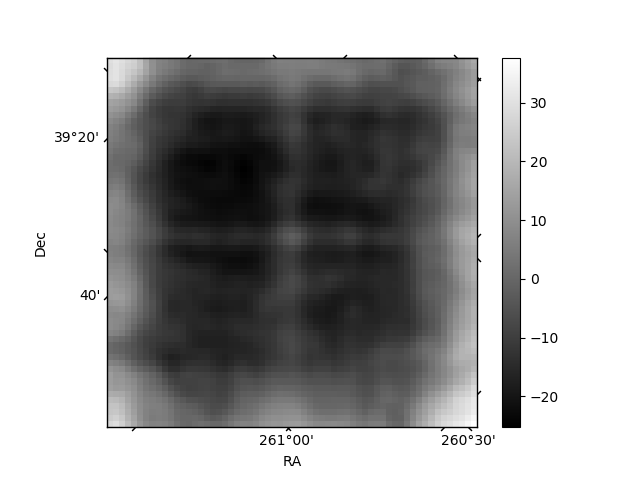
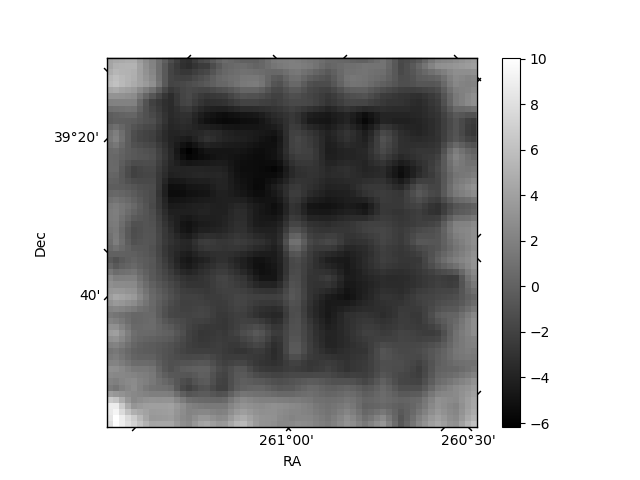
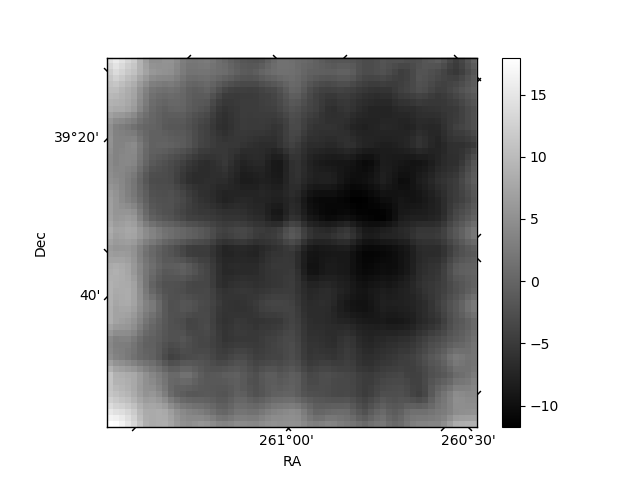
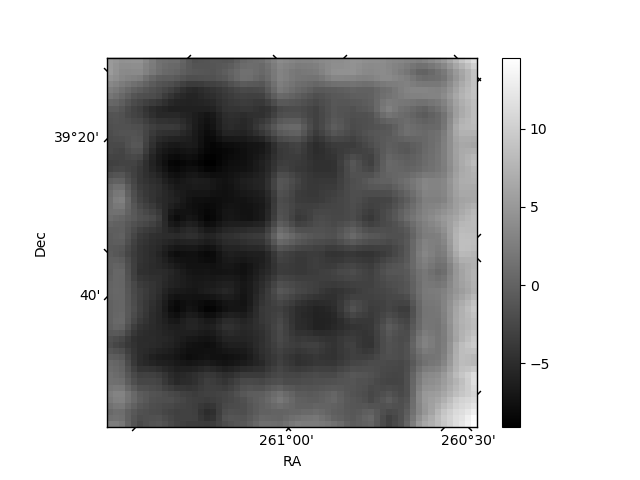
Histogram calculated using DETX and DETY for each event in the final _common_clean file
| Quadrant A | 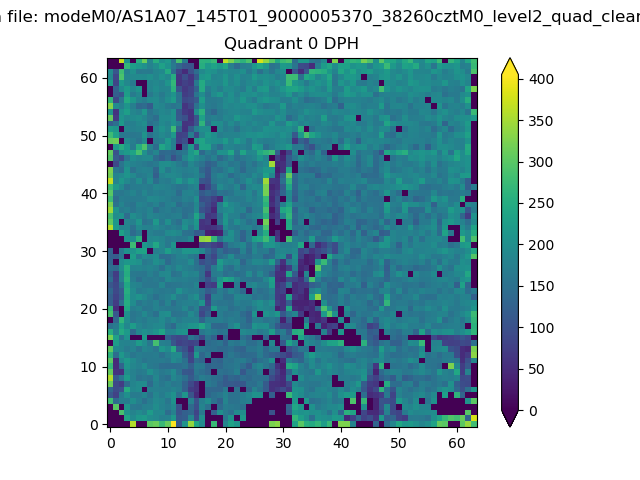 |
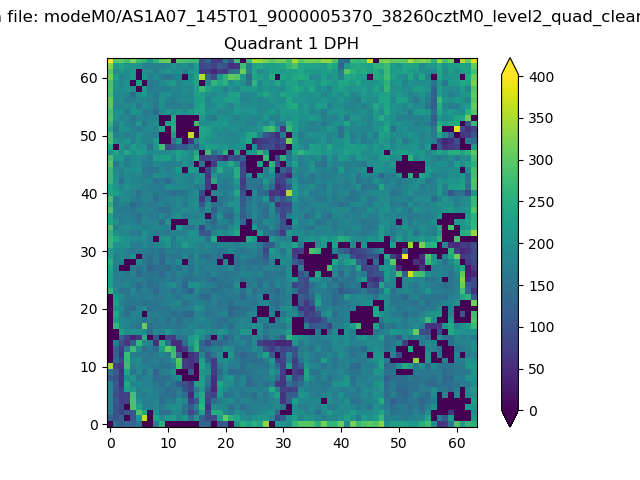 |
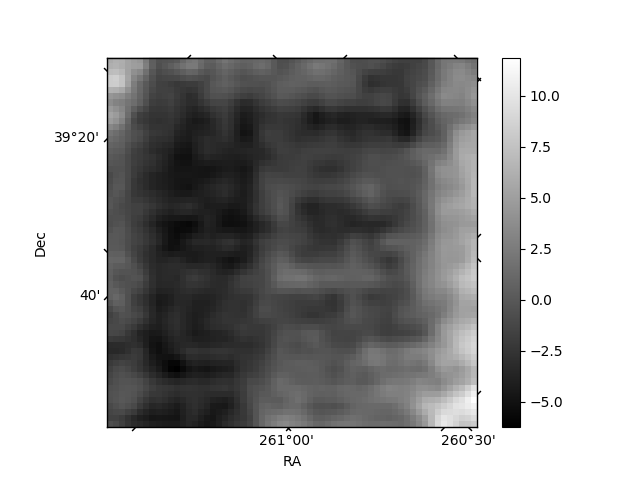
Quadrant B |
|---|---|---|---|
| Quadrant D | 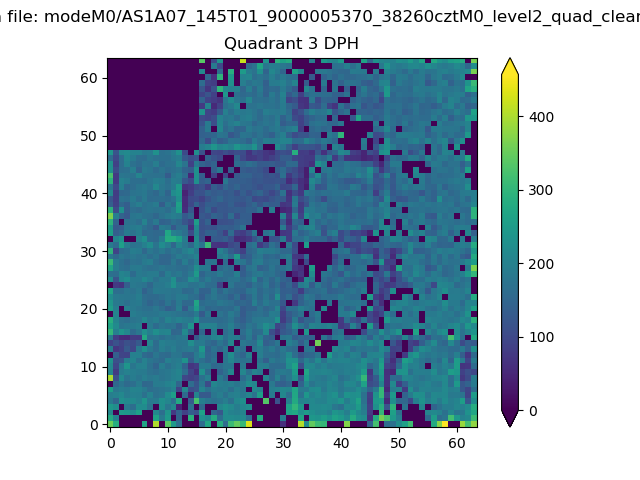 |
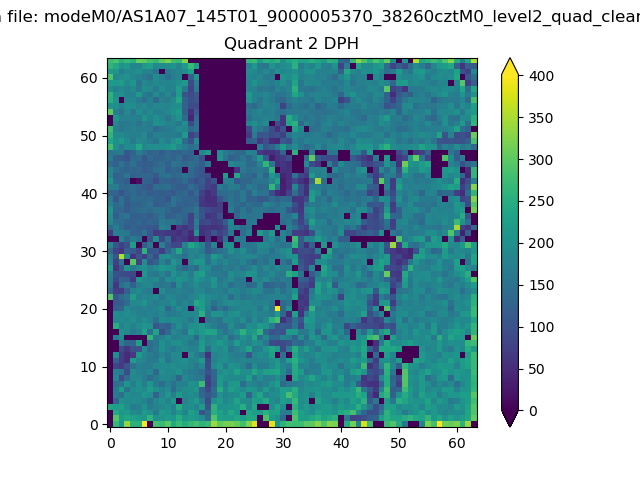 |
Quadrant C |
| Plot type | Count rate plots | Images |
|---|---|---|
| Comparison with Poisson distribution Blue bars denote a histogram of data divided into 1 sec bins. Red curve is a Poisson curve with rate = median count rate of data. |
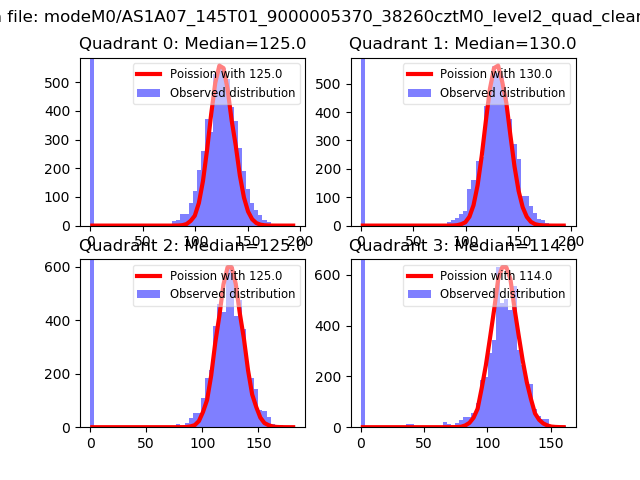 |
 |
| Quadrant-wise count rates Data is divided into 100 sec bins |
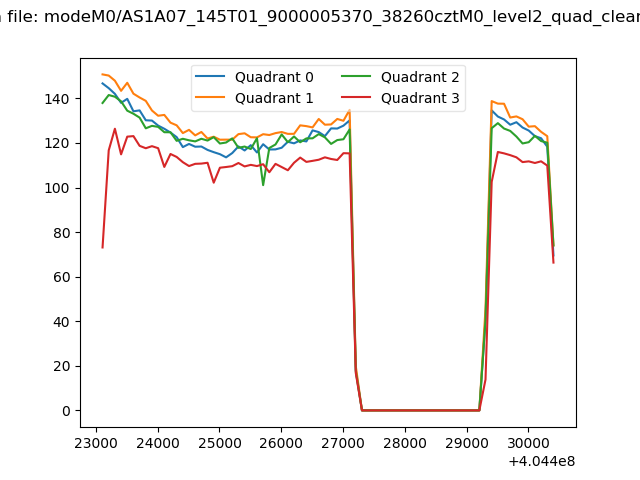 |
|
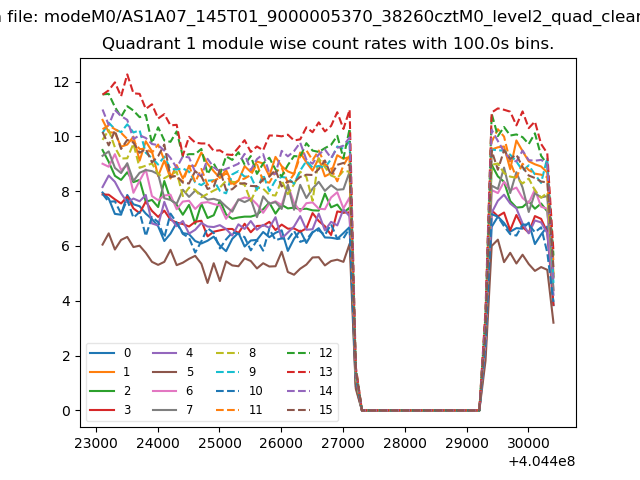
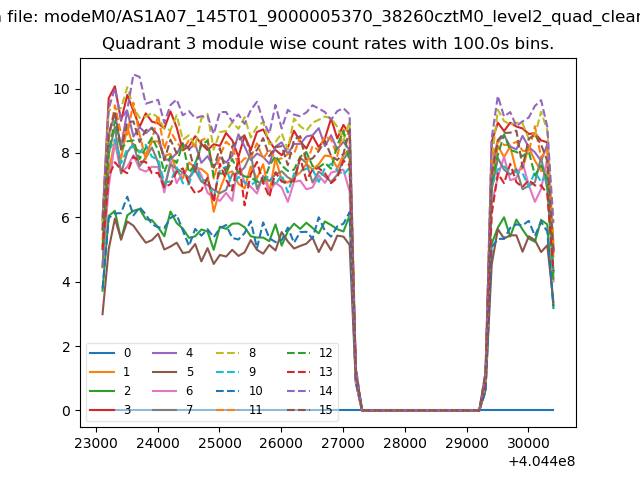
| Module-wise count rates for Quadrant A Data is divided into 100 sec bins |
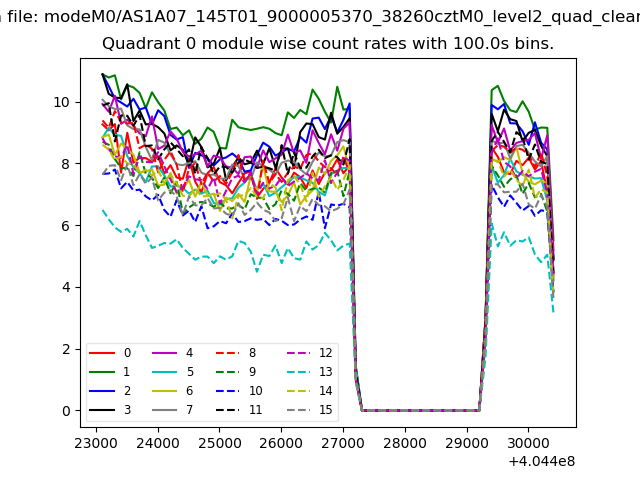 |
 |
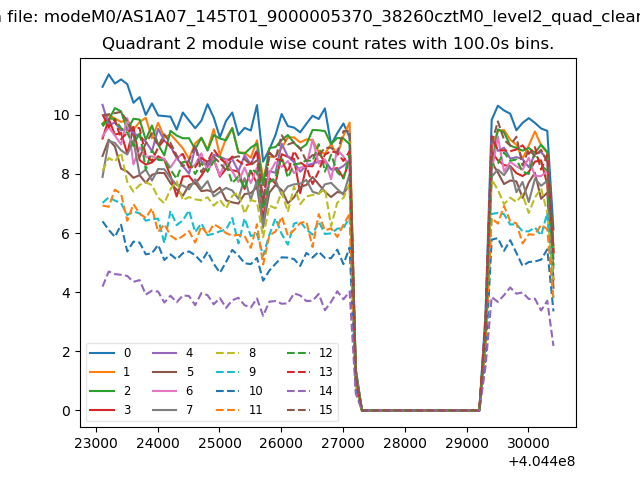
| Module-wise count rates for Quadrant B Data is divided into 100 sec bins |
 |
 |
| Module-wise count rates for Quadrant C Data is divided into 100 sec bins |
 |
 |
| Module-wise count rates for Quadrant D Data is divided into 100 sec bins |
 |
 |
| Parameter | Plot |
|---|---|
| CZT HV Monitor |  |
| D_VDD | 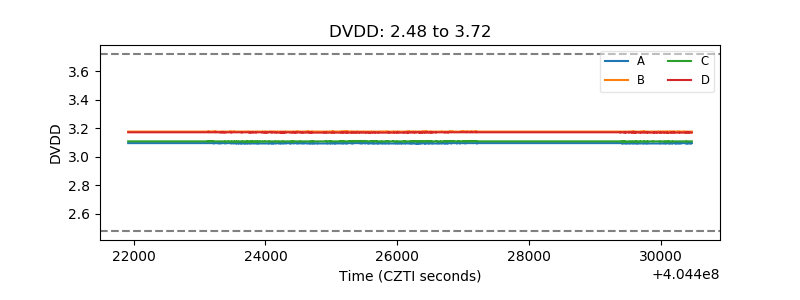 |
| Temperature 1 | 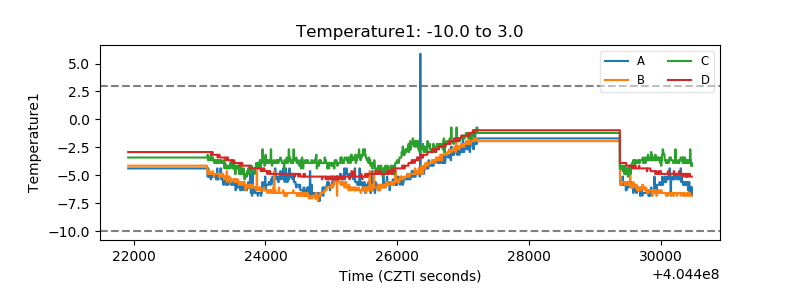 |
| Veto HV Monitor | 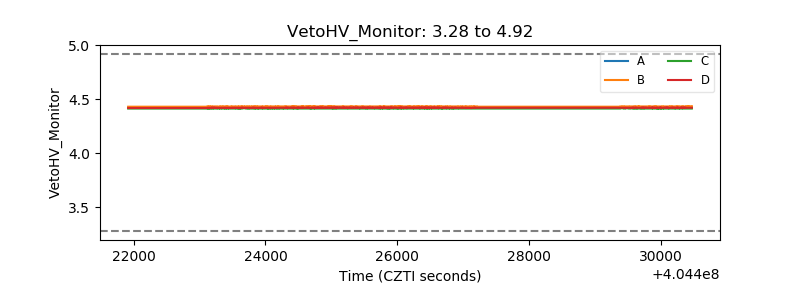 |
| Veto LLD | 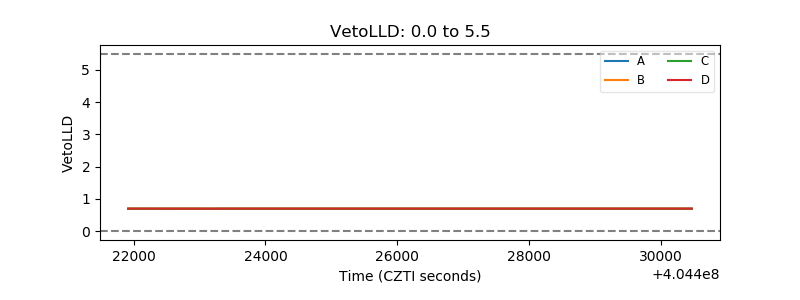 |
| Alpha Counter | 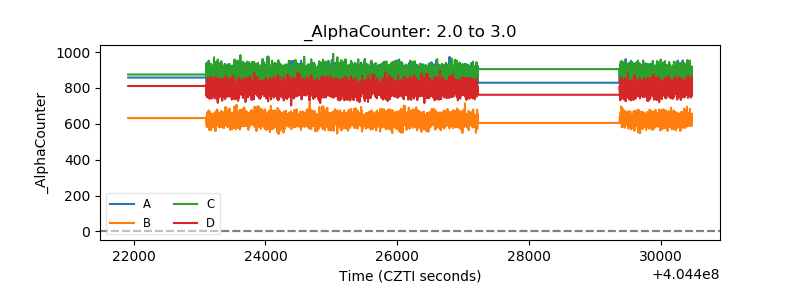 |
| _CPM_Rate | 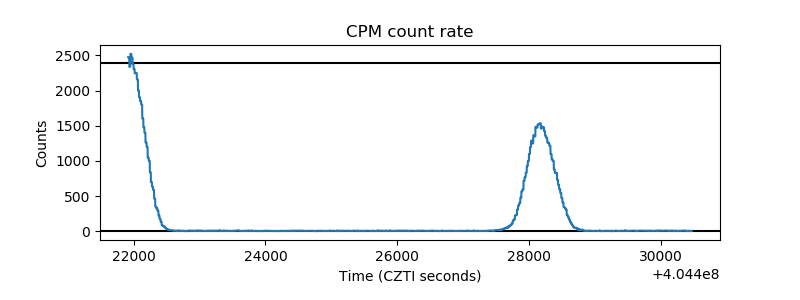 |
| CZT Counter | 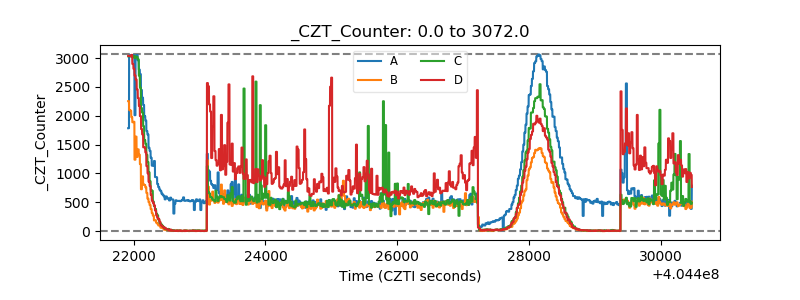 |
| +2.5 Volts monitor | 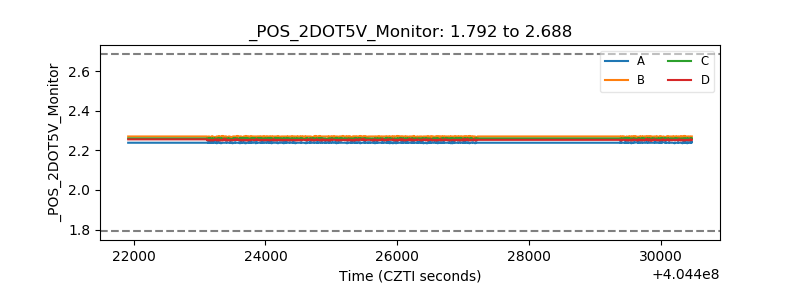 |
| +5 Volts monitor | 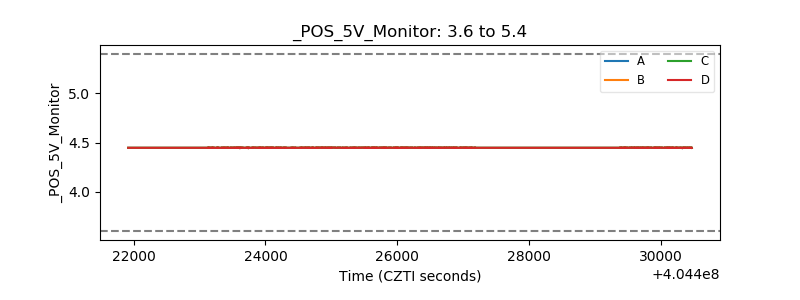 |
| _ROLL_ROT | 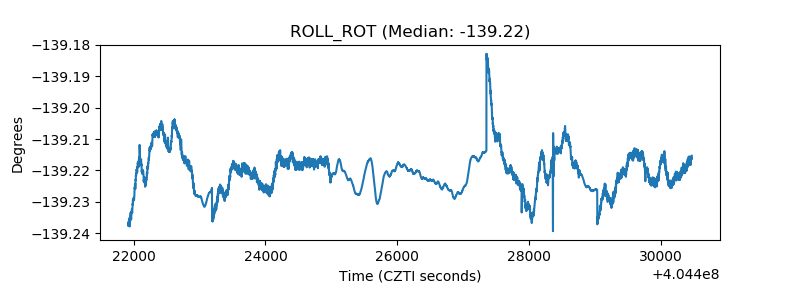 |
| _Roll_DEC | 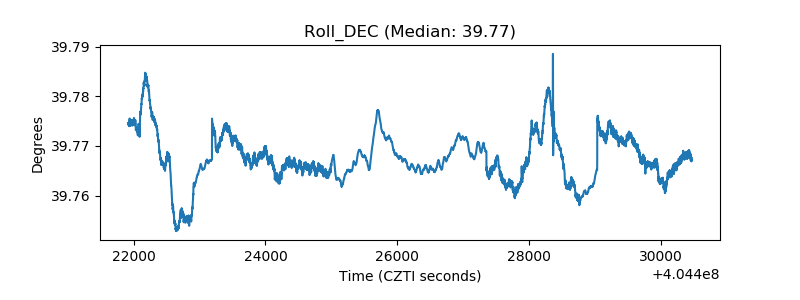 |
| _Roll_RA | 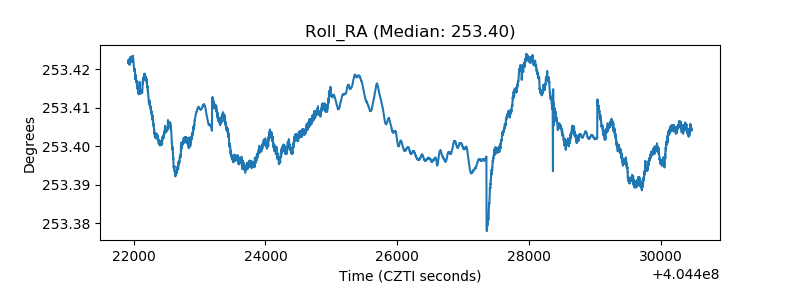 |
| Veto Counter | 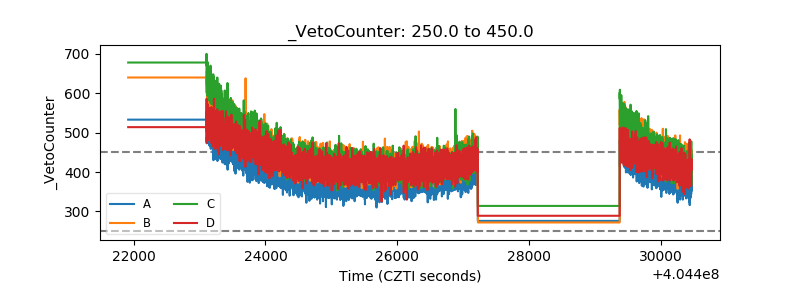 |