| Param | Original file | Final file |
|---|---|---|
| Filename | modeM0/AS1A07_145T01_9000005370_38262cztM0_level2.fits | modeM0/AS1A07_145T01_9000005370_38262cztM0_level2_quad_clean.evt |
| Size (bytes) | 375,436,800 | 89,686,080 |
| Size | 358.0 MB | 85.5 MB |
| Events in quadrant A | 2,749,223 | 603,103 |
| Events in quadrant B | 2,664,231 | 621,339 |
| Events in quadrant C | 2,664,119 | 601,784 |
| Events in quadrant D | 5,407,282 | 517,584 |
| Mode M9 | |||
|---|---|---|---|
| Quadrant | BADHDUFLAG | Total packets | Discarded packets |
| A | 0 | 34 | 0 |
| B | 0 | 34 | 0 |
| C | 0 | 34 | 0 |
| D | 0 | 35 | 0 |
| Mode SS | |||
|---|---|---|---|
| Quadrant | BADHDUFLAG | Total packets | Discarded packets |
| A | 0 | 110 | 0 |
| B | 0 | 110 | 0 |
| C | 0 | 110 | 0 |
| D | 0 | 110 | 0 |
| Mode M0 | |||
|---|---|---|---|
| Quadrant | BADHDUFLAG | Total packets | Discarded packets |
| A | 0 | 11385 | 3 |
| B | 0 | 11489 | 2 |
| C | 0 | 11154 | 2 |
| D | 0 | 19574 | 2 |
| Quadrant | Total seconds | Saturated seconds | Saturation percentage |
|---|---|---|---|
| A | 5304 | 13 | 0.245098% |
| B | 5304 | 49 | 0.923831% |
| C | 5304 | 25 | 0.471342% |
| D | 5304 | 471 | 8.880090% |
Noise dominated data is calculated using 1-second bins in cleaned event files. If a bin has >2000 counts, and if more than 50% of those come from <1% of pixels, then it is considered to be noise-dominated and hence unusable.
| Quadrant | # 1 sec bins | Bins with >0 counts | Bins with >2000 counts | High rate bins dominated by noise | Noise dominated (total time) | Noise dominated (detector-on time) | Marked lightcurve |
|---|---|---|---|---|---|---|---|
| A | 7186 | 5304 | 7 | 7 | 0.10% | 0.13% | 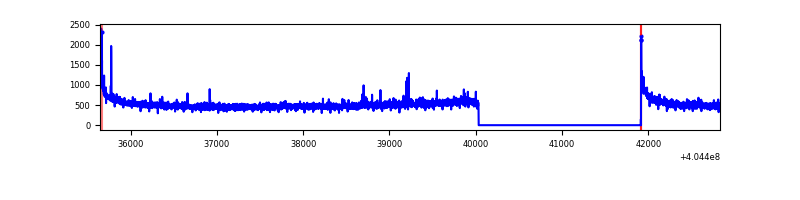 |
| B | 7186 | 5304 | 31 | 31 | 0.43% | 0.58% | 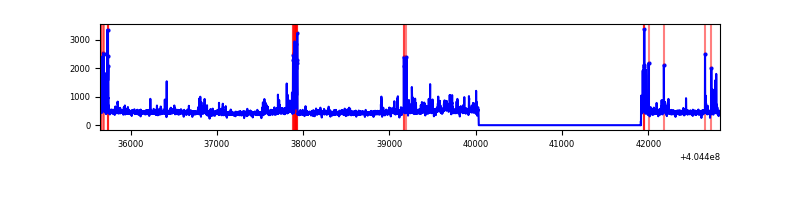 |
| C | 7186 | 5304 | 13 | 13 | 0.18% | 0.25% | 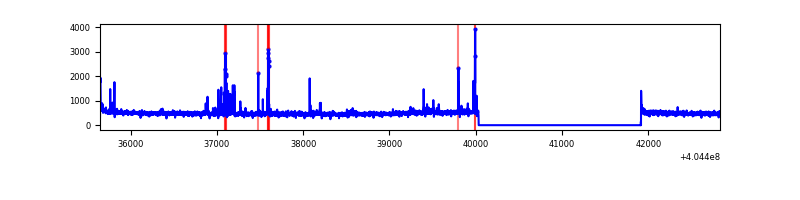 |
| D | 7186 | 5305 | 504 | 504 | 7.01% | 9.50% | 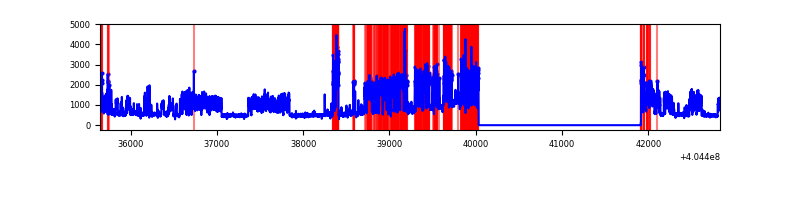 |
Top three noisy pixels from each quadrant. If the there are fewer than three noisy pixels in the level2.evt file, extra rows are filled as -1
| Pixel properties | Quadrant properties | ||||||
|---|---|---|---|---|---|---|---|
| Quadrant | DetID | PixID | Counts | Sigma | Mean | Median | Sigma |
| A | 10 | 83 | 366392 | 3071.57 | 591 | 579 | 119.1 |
| A | 12 | 189 | 35559 | 293.71 | 591 | 579 | 119.1 |
| A | 9 | 143 | 22515 | 184.19 | 591 | 579 | 119.1 |
| B | 5 | 172 | 140750 | 1236.64 | 589 | 574 | 113.4 |
| B | 5 | 184 | 90627 | 794.45 | 589 | 574 | 113.4 |
| B | 0 | 229 | 42439 | 369.33 | 589 | 574 | 113.4 |
| C | 15 | 214 | 223762 | 1644.84 | 579 | 583 | 135.7 |
| C | 14 | 254 | 98575 | 722.21 | 579 | 583 | 135.7 |
| C | 5 | 128 | 29562 | 213.58 | 579 | 583 | 135.7 |
| D | 10 | 203 | 2669227 | 19296.74 | 561 | 546 | 138.3 |
| D | 12 | 235 | 199470 | 1438.38 | 561 | 546 | 138.3 |
| D | 1 | 47 | 111624 | 803.18 | 561 | 546 | 138.3 |
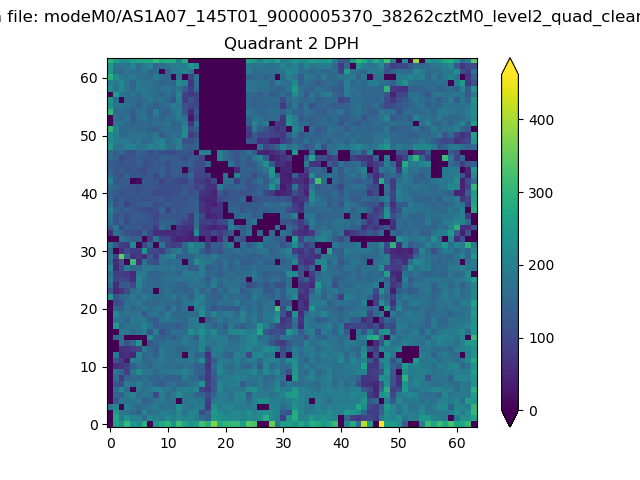
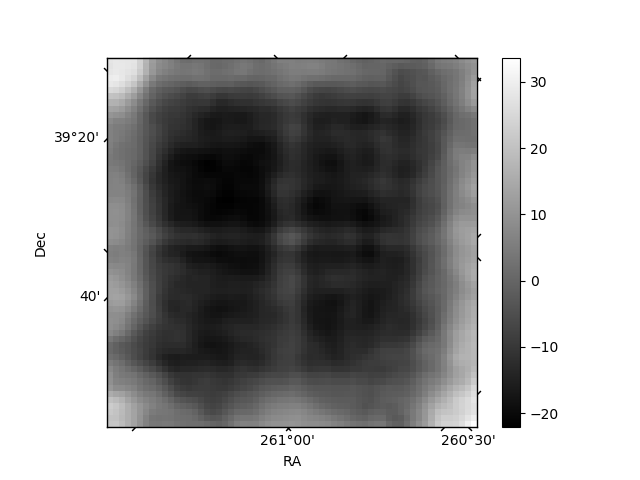
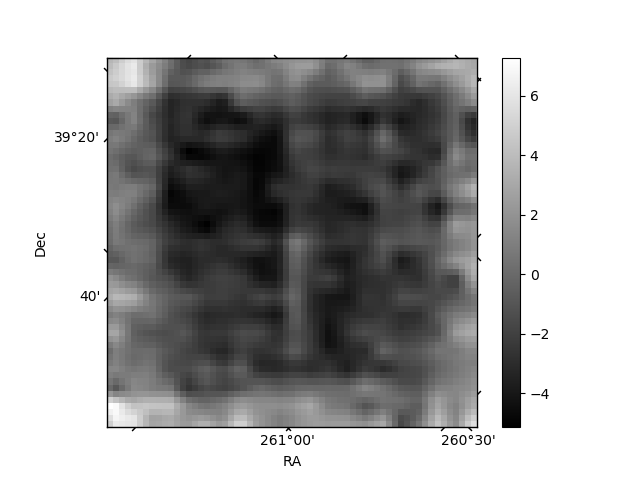
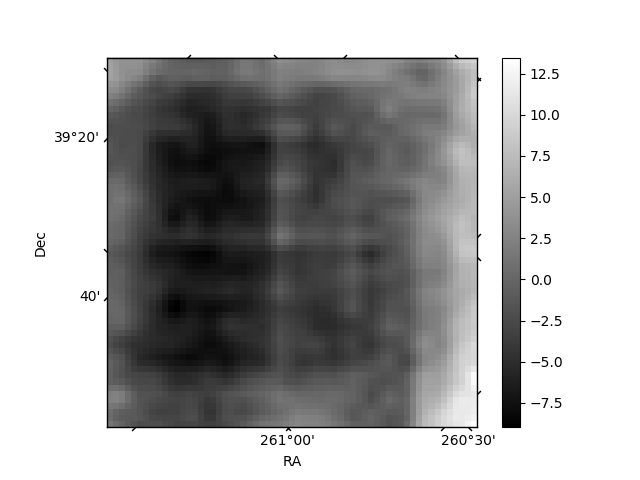
Histogram calculated using DETX and DETY for each event in the final _common_clean file
| Quadrant A | 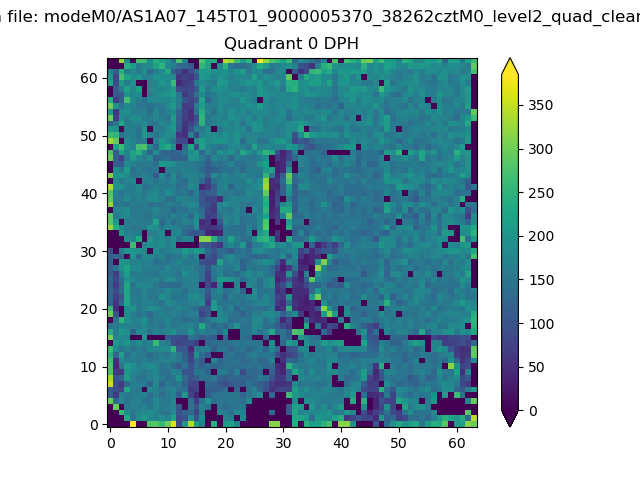 |
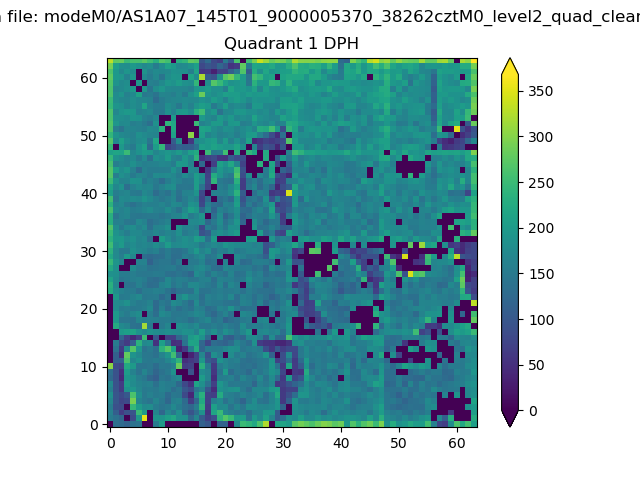 |
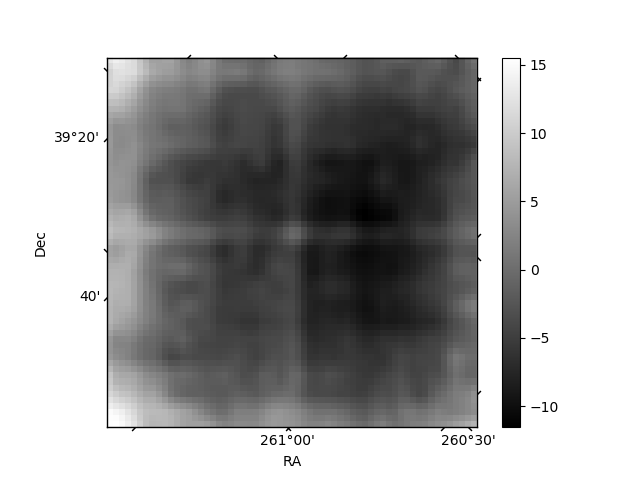
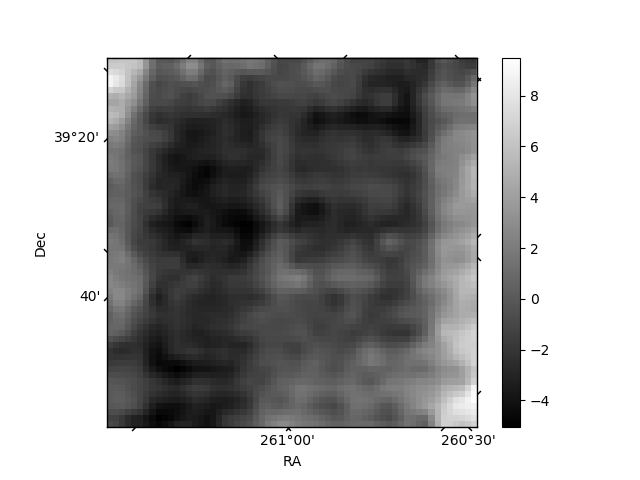
Quadrant B |
|---|---|---|---|
| Quadrant D | 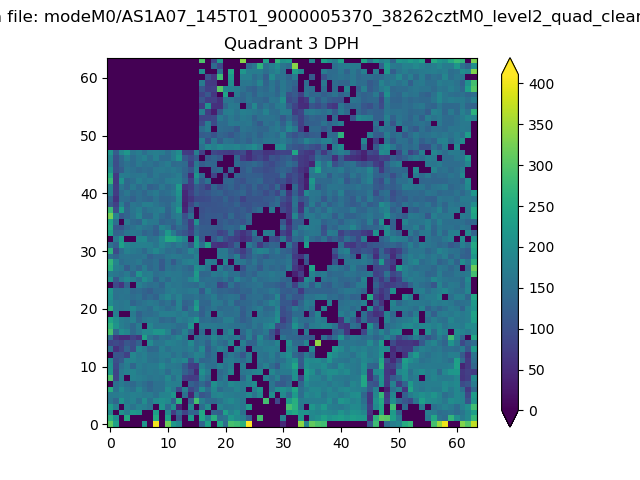 |
 |
Quadrant C |
| Plot type | Count rate plots | Images |
|---|---|---|
| Comparison with Poisson distribution Blue bars denote a histogram of data divided into 1 sec bins. Red curve is a Poisson curve with rate = median count rate of data. |
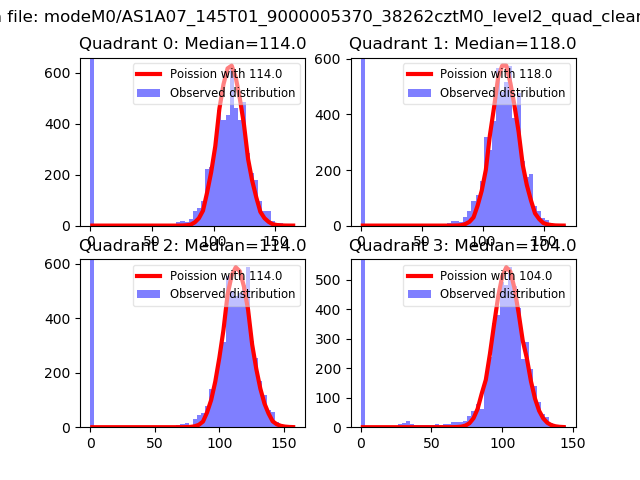 |
 |
| Quadrant-wise count rates Data is divided into 100 sec bins |
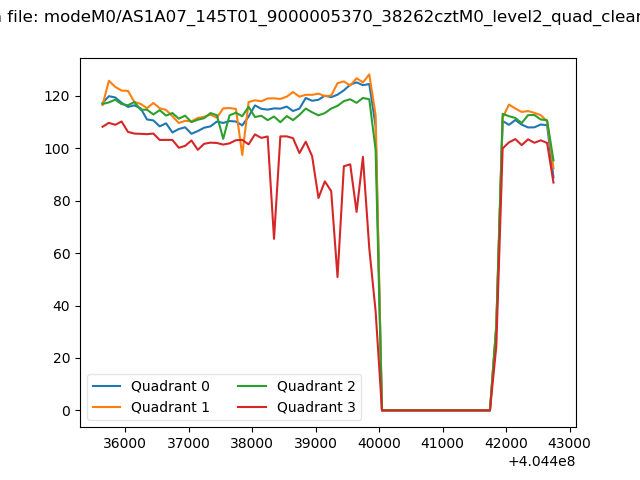 |
|
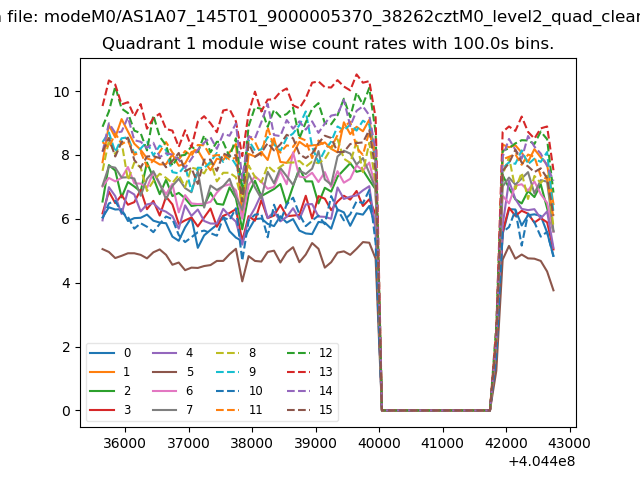
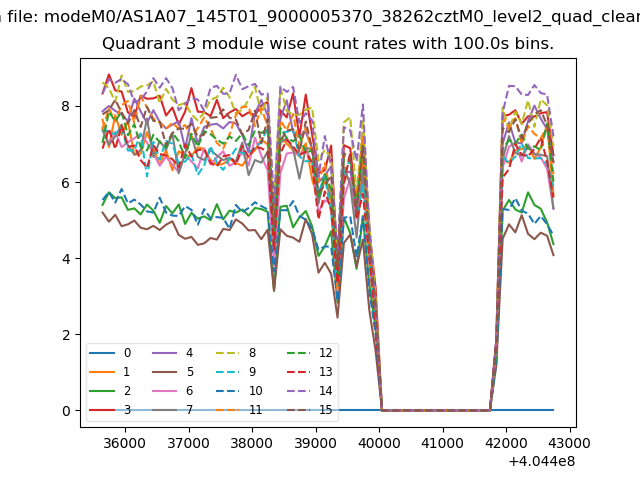
| Module-wise count rates for Quadrant A Data is divided into 100 sec bins |
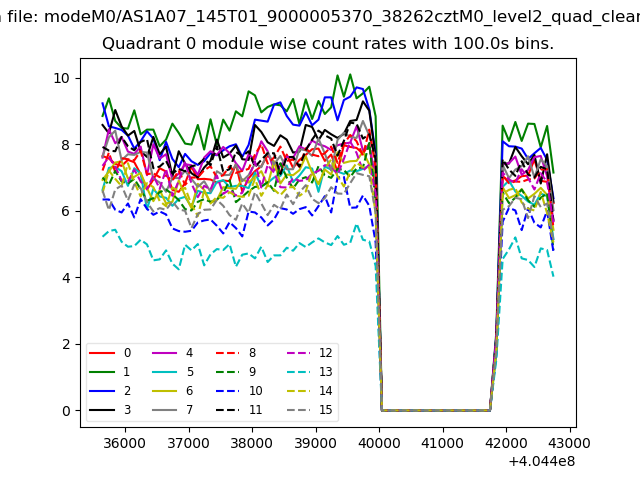 |
 |
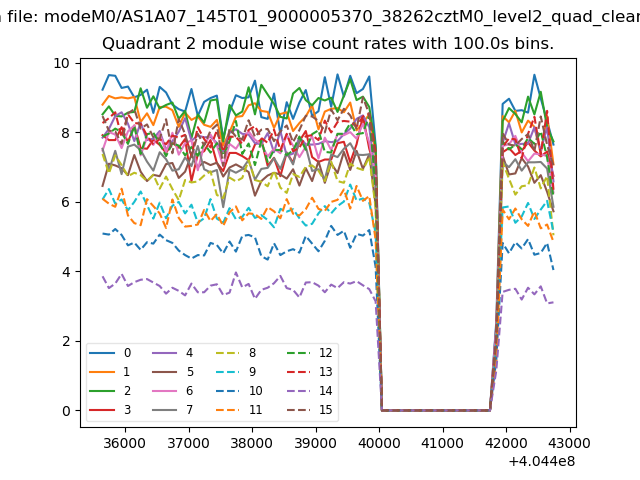
| Module-wise count rates for Quadrant B Data is divided into 100 sec bins |
 |
 |
| Module-wise count rates for Quadrant C Data is divided into 100 sec bins |
 |
 |
| Module-wise count rates for Quadrant D Data is divided into 100 sec bins |
 |
 |
| Parameter | Plot |
|---|---|
| CZT HV Monitor | 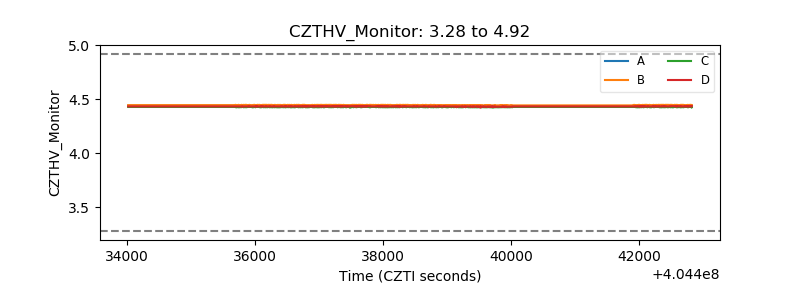 |
| D_VDD | 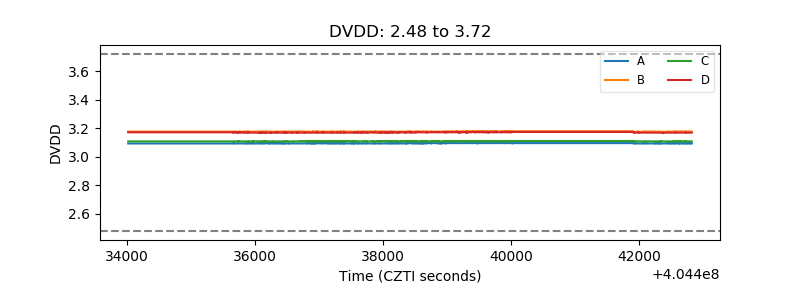 |
| Temperature 1 | 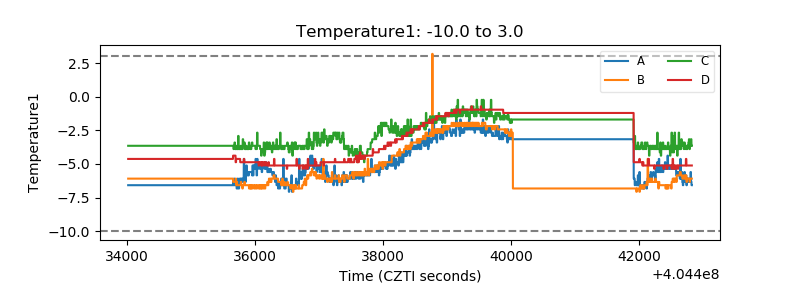 |
| Veto HV Monitor | 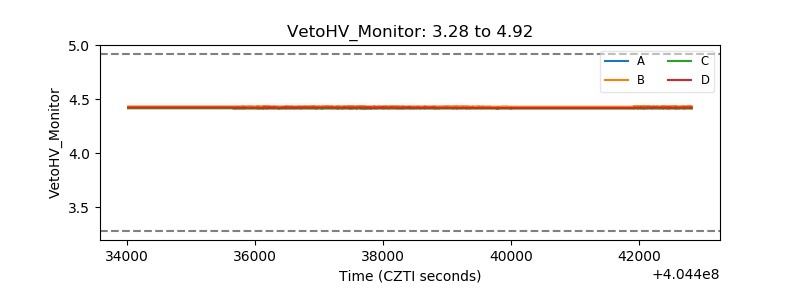 |
| Veto LLD | 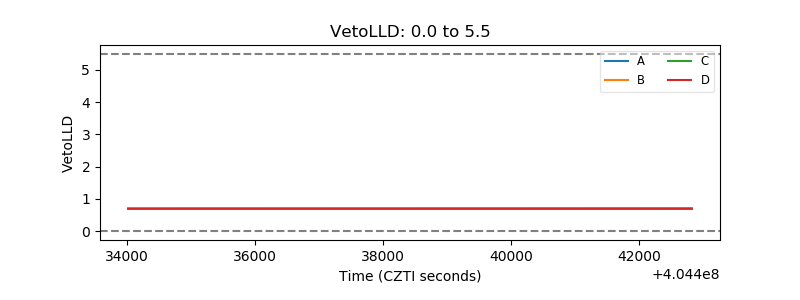 |
| Alpha Counter | 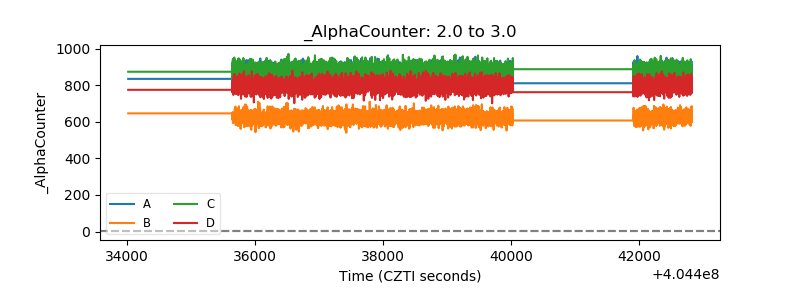 |
| _CPM_Rate | 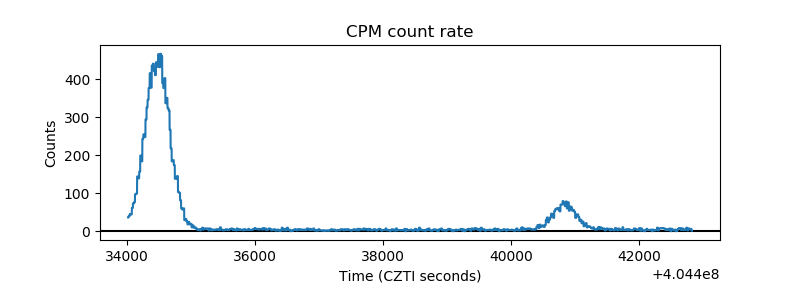 |
| CZT Counter | 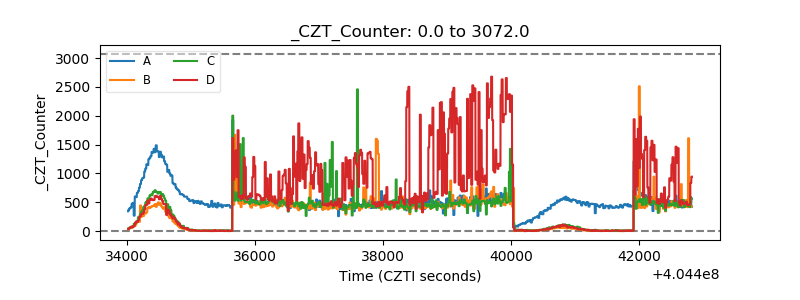 |
| +2.5 Volts monitor |  |
| +5 Volts monitor | 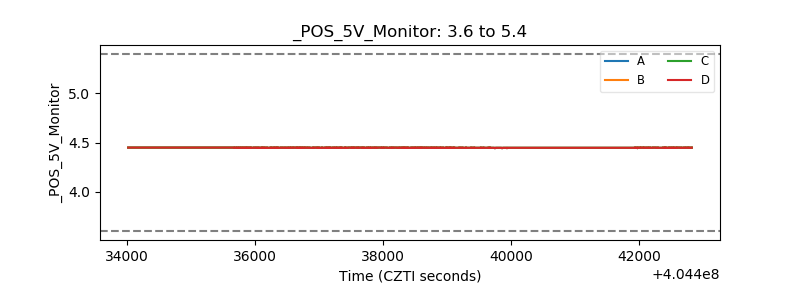 |
| _ROLL_ROT | 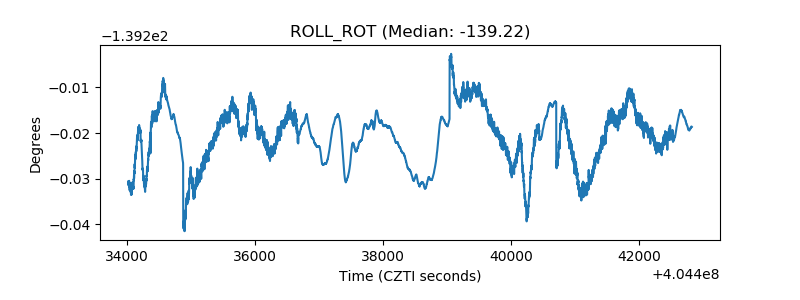 |
| _Roll_DEC | 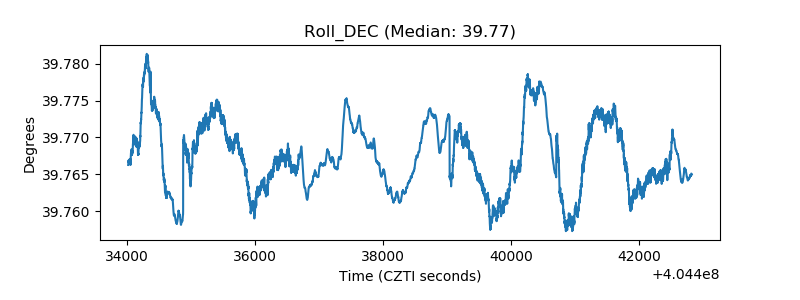 |
| _Roll_RA | 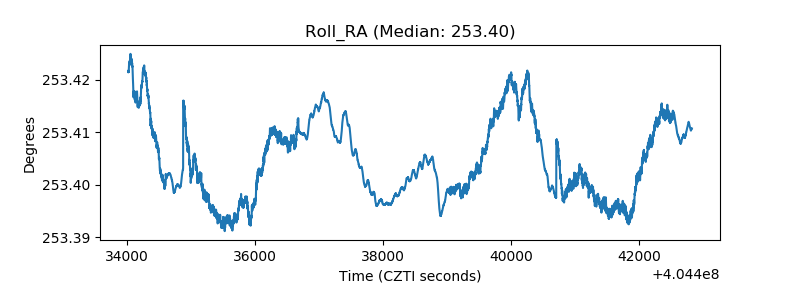 |
| Veto Counter | 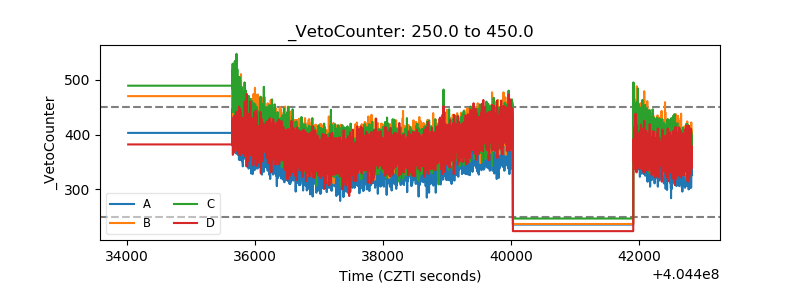 |