| Param | Original file | Final file |
|---|---|---|
| Filename | modeM0/AS1A07_145T01_9000005370_38264cztM0_level2.fits | modeM0/AS1A07_145T01_9000005370_38264cztM0_level2_quad_clean.evt |
| Size (bytes) | 471,110,400 | 97,764,480 |
| Size | 449.3 MB | 93.2 MB |
| Events in quadrant A | 5,515,502 | 640,805 |
| Events in quadrant B | 2,991,046 | 672,018 |
| Events in quadrant C | 3,009,904 | 646,776 |
| Events in quadrant D | 5,465,161 | 588,641 |
| Mode M9 | |||
|---|---|---|---|
| Quadrant | BADHDUFLAG | Total packets | Discarded packets |
| A | 0 | 14 | 0 |
| B | 0 | 14 | 0 |
| C | 0 | 14 | 0 |
| D | 0 | 15 | 0 |
| Mode SS | |||
|---|---|---|---|
| Quadrant | BADHDUFLAG | Total packets | Discarded packets |
| A | 0 | 118 | 0 |
| B | 0 | 118 | 0 |
| C | 0 | 118 | 0 |
| D | 0 | 118 | 0 |
| Mode M0 | |||
|---|---|---|---|
| Quadrant | BADHDUFLAG | Total packets | Discarded packets |
| A | 0 | 20547 | 3 |
| B | 0 | 12837 | 2 |
| C | 0 | 12656 | 2 |
| D | 0 | 20471 | 2 |
| Quadrant | Total seconds | Saturated seconds | Saturation percentage |
|---|---|---|---|
| A | 5902 | 195 | 3.303965% |
| B | 5902 | 59 | 0.999661% |
| C | 5902 | 36 | 0.609963% |
| D | 5902 | 142 | 2.405964% |
Noise dominated data is calculated using 1-second bins in cleaned event files. If a bin has >2000 counts, and if more than 50% of those come from <1% of pixels, then it is considered to be noise-dominated and hence unusable.
| Quadrant | # 1 sec bins | Bins with >0 counts | Bins with >2000 counts | High rate bins dominated by noise | Noise dominated (total time) | Noise dominated (detector-on time) | Marked lightcurve |
|---|---|---|---|---|---|---|---|
| A | 7216 | 5903 | 202 | 202 | 2.80% | 3.42% | 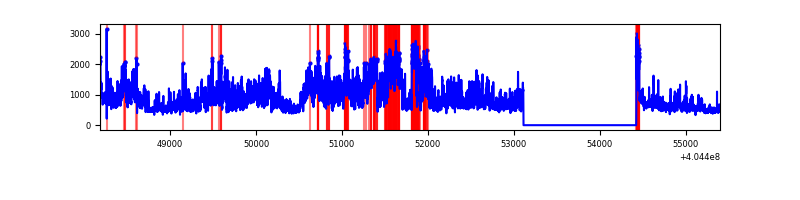 |
| B | 7216 | 5903 | 40 | 40 | 0.55% | 0.68% | 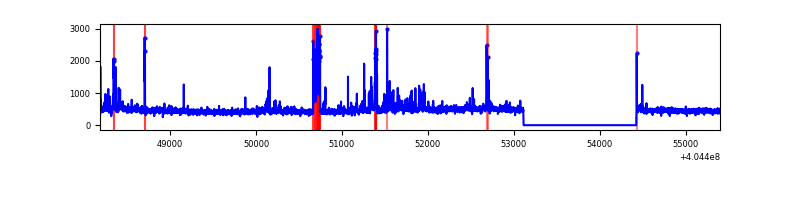 |
| C | 7216 | 5903 | 31 | 31 | 0.43% | 0.53% | 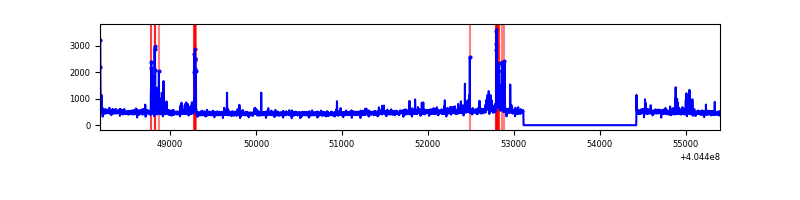 |
| D | 7216 | 5903 | 138 | 138 | 1.91% | 2.34% | 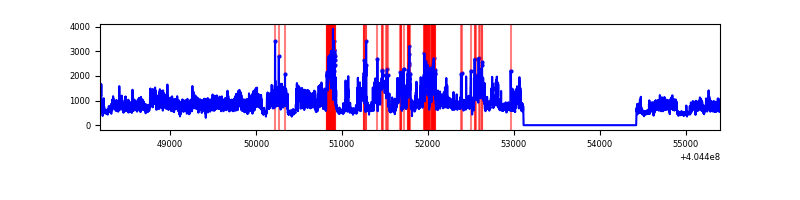 |
Top three noisy pixels from each quadrant. If the there are fewer than three noisy pixels in the level2.evt file, extra rows are filled as -1
| Pixel properties | Quadrant properties | ||||||
|---|---|---|---|---|---|---|---|
| Quadrant | DetID | PixID | Counts | Sigma | Mean | Median | Sigma |
| A | 12 | 16 | 2204580 | 16751.96 | 651 | 638 | 131.6 |
| A | 10 | 83 | 401035 | 3043.38 | 651 | 638 | 131.6 |
| A | 12 | 194 | 298068 | 2260.74 | 651 | 638 | 131.6 |
| B | 5 | 172 | 232991 | 1841.24 | 654 | 636 | 126.2 |
| B | 0 | 229 | 93736 | 737.75 | 654 | 636 | 126.2 |
| B | 15 | 85 | 35716 | 277.98 | 654 | 636 | 126.2 |
| C | 15 | 214 | 244382 | 1618.99 | 641 | 647 | 150.5 |
| C | 14 | 254 | 177386 | 1173.98 | 641 | 647 | 150.5 |
| C | 15 | 159 | 32079 | 208.78 | 641 | 647 | 150.5 |
| D | 10 | 203 | 2049370 | 13110.26 | 636 | 617 | 156.3 |
| D | 12 | 235 | 647990 | 4142.63 | 636 | 617 | 156.3 |
| D | 13 | 171 | 108871 | 692.73 | 636 | 617 | 156.3 |
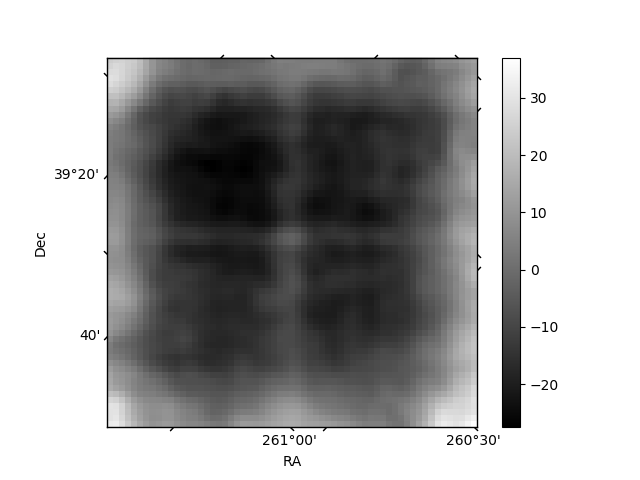
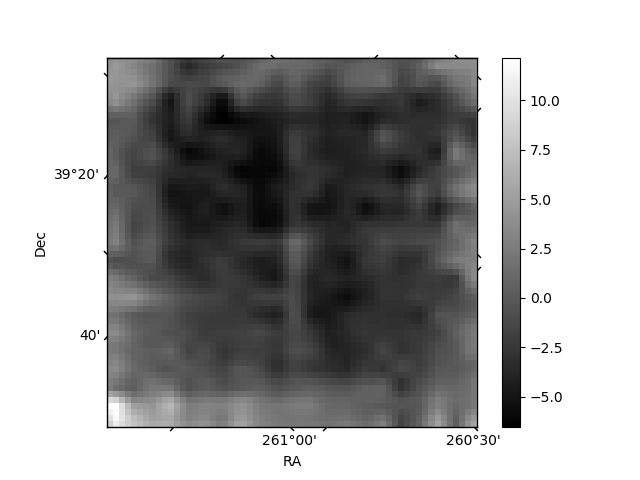
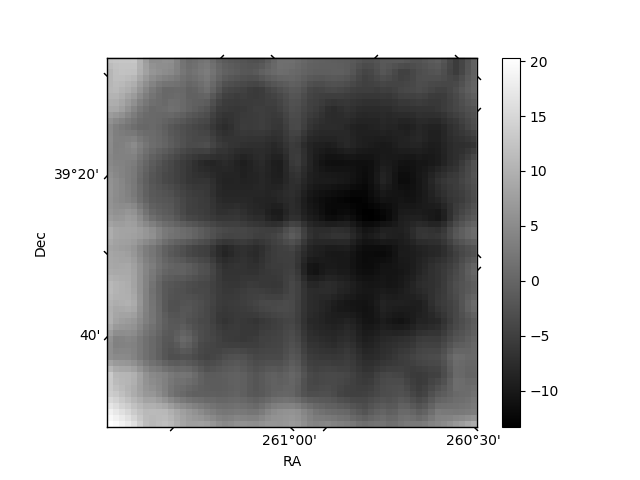
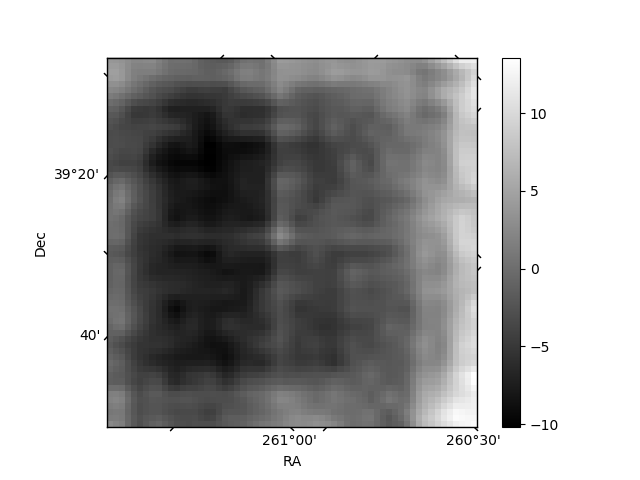
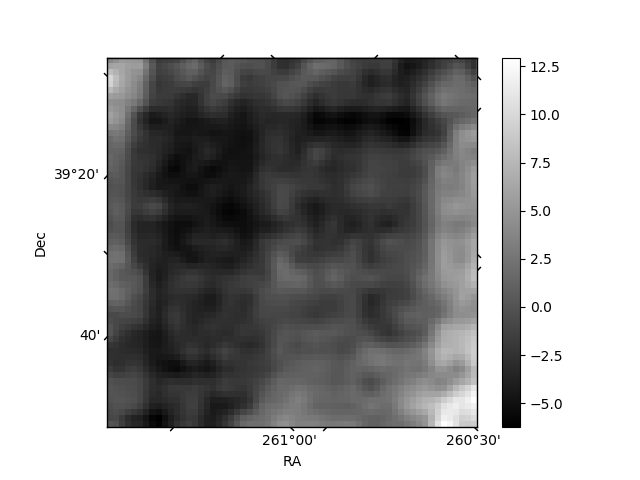
Histogram calculated using DETX and DETY for each event in the final _common_clean file
| Quadrant A | 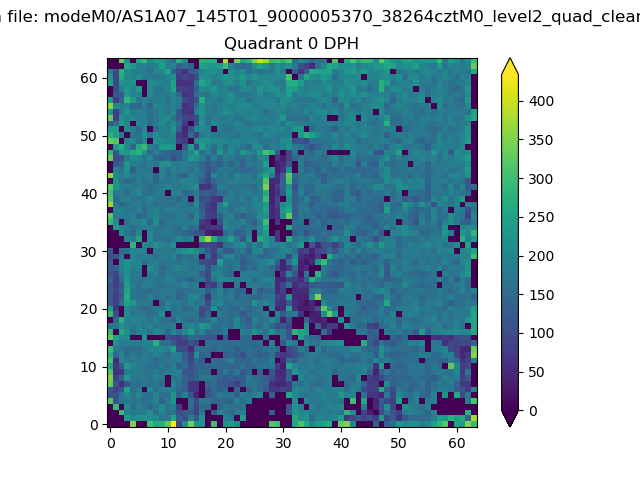 |
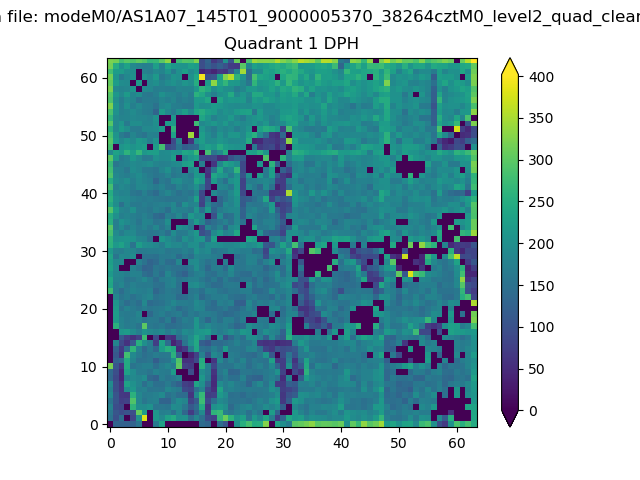 |
Quadrant B |
|---|---|---|---|
| Quadrant D | 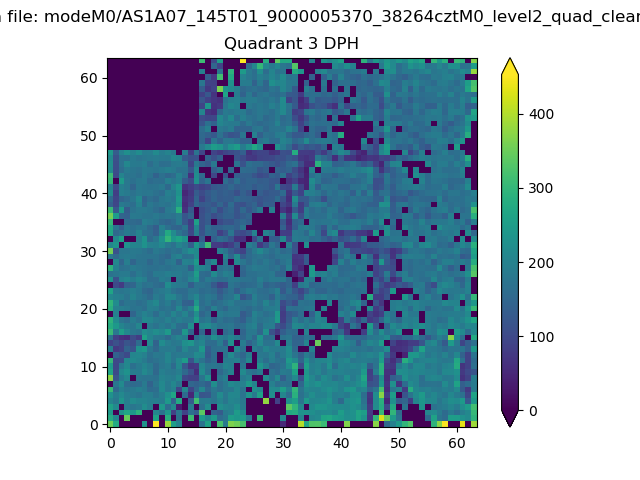 |
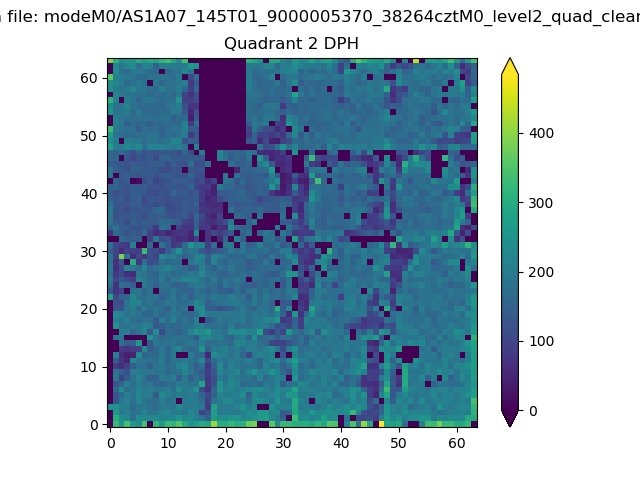 |
Quadrant C |
| Plot type | Count rate plots | Images |
|---|---|---|
| Comparison with Poisson distribution Blue bars denote a histogram of data divided into 1 sec bins. Red curve is a Poisson curve with rate = median count rate of data. |
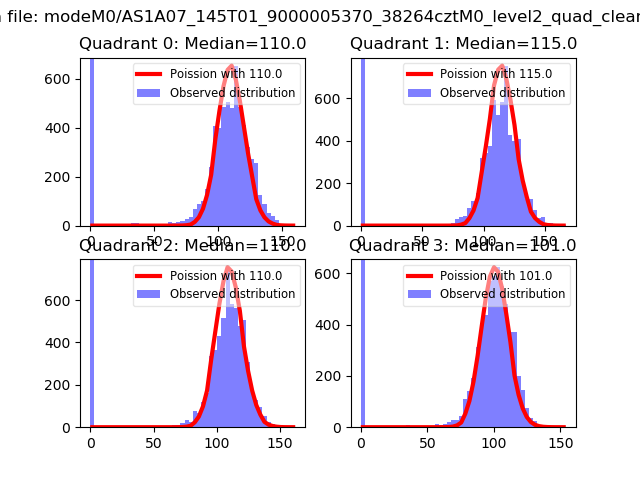 |
 |
| Quadrant-wise count rates Data is divided into 100 sec bins |
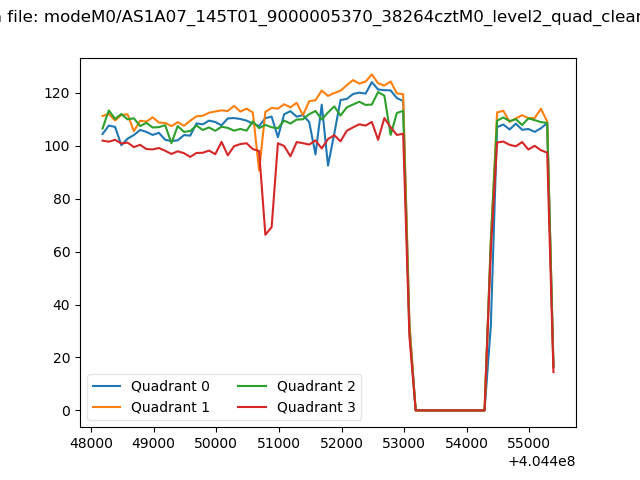 |
|
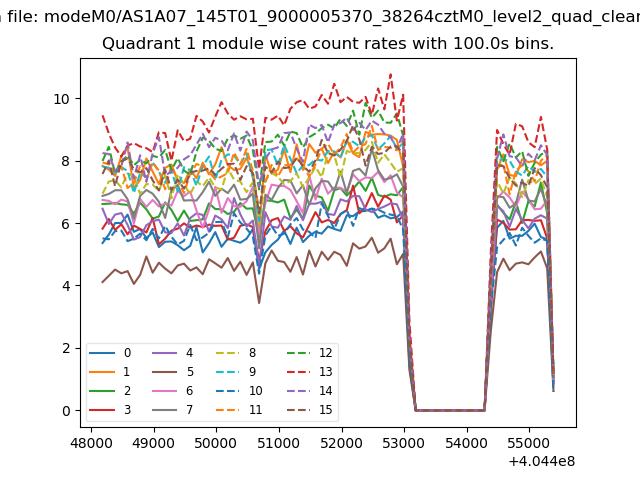
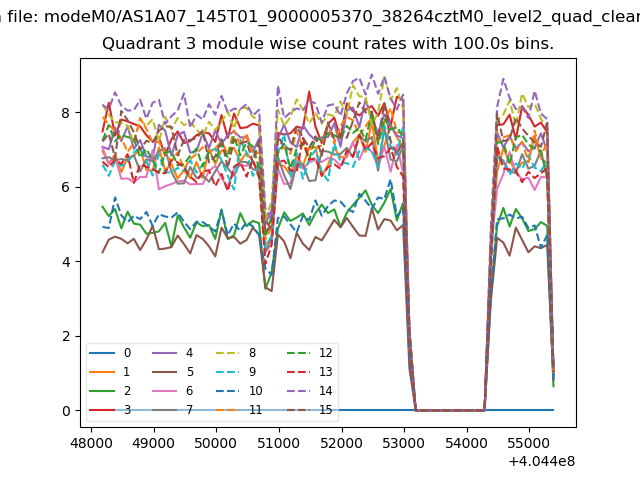
| Module-wise count rates for Quadrant A Data is divided into 100 sec bins |
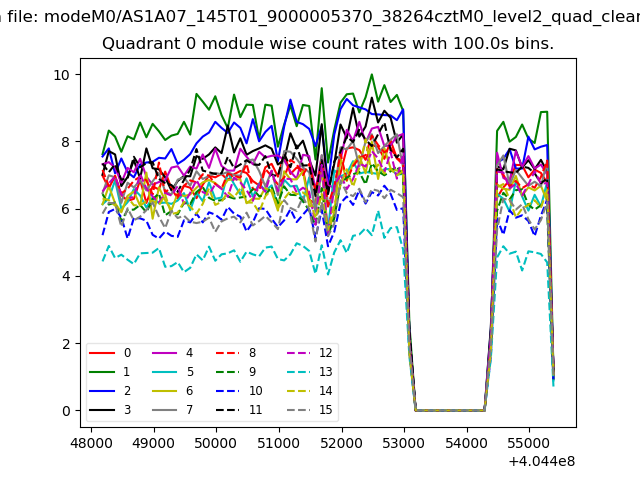 |
 |
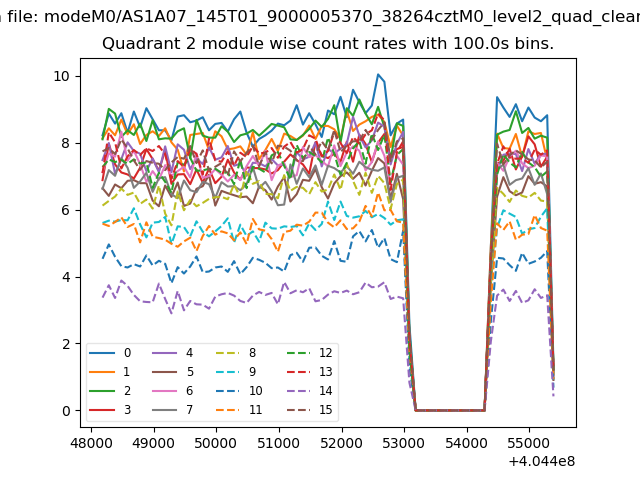
| Module-wise count rates for Quadrant B Data is divided into 100 sec bins |
 |
 |
| Module-wise count rates for Quadrant C Data is divided into 100 sec bins |
 |
 |
| Module-wise count rates for Quadrant D Data is divided into 100 sec bins |
 |
 |
| Parameter | Plot |
|---|---|
| CZT HV Monitor |  |
| D_VDD | 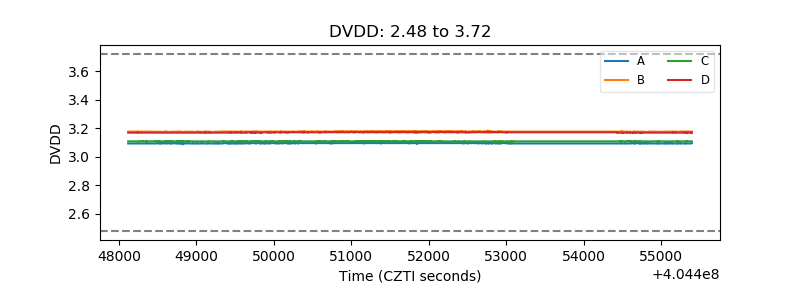 |
| Temperature 1 | 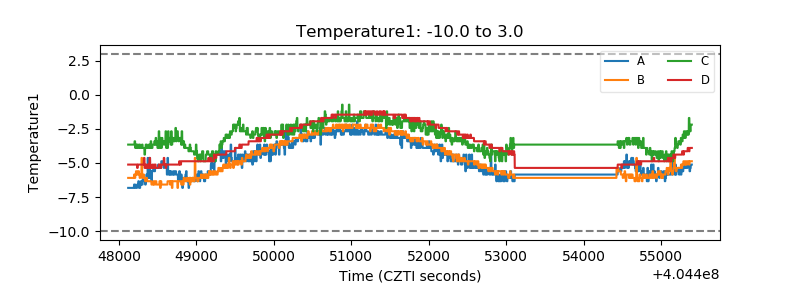 |
| Veto HV Monitor | 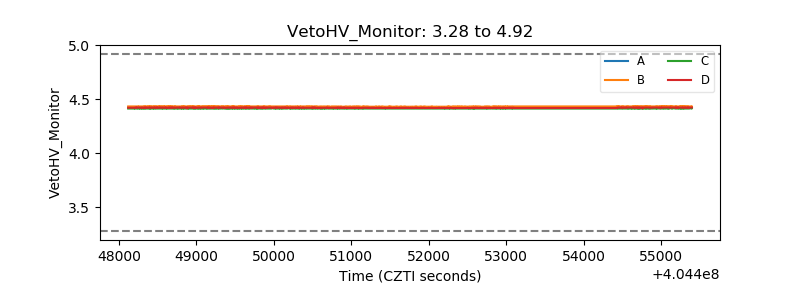 |
| Veto LLD | 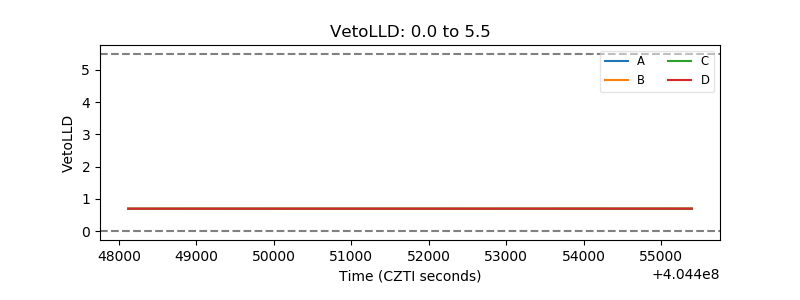 |
| Alpha Counter | 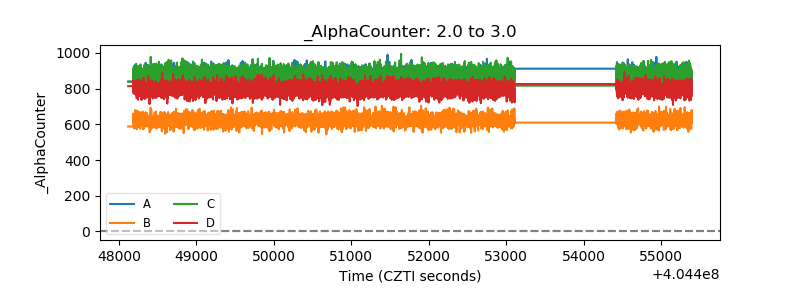 |
| _CPM_Rate | 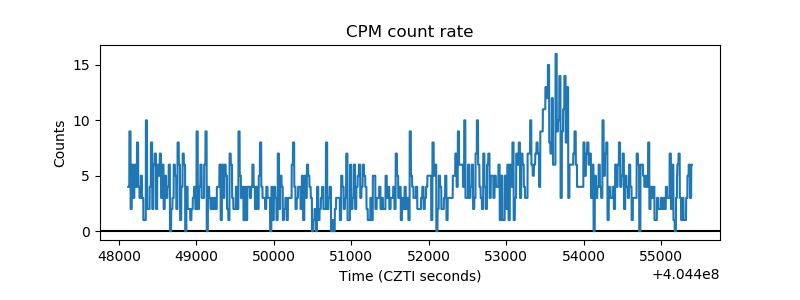 |
| CZT Counter | 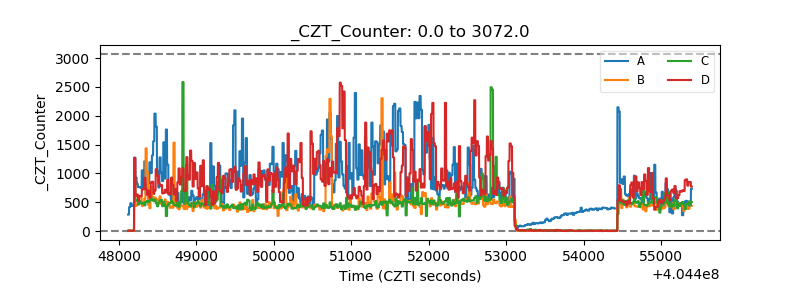 |
| +2.5 Volts monitor | 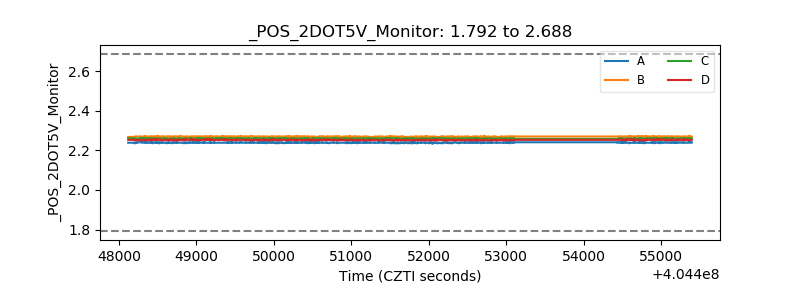 |
| +5 Volts monitor | 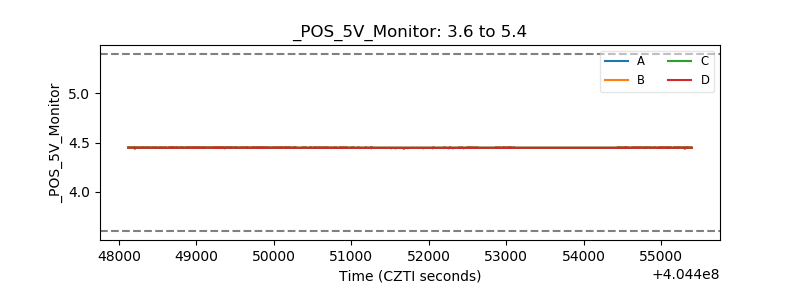 |
| _ROLL_ROT | 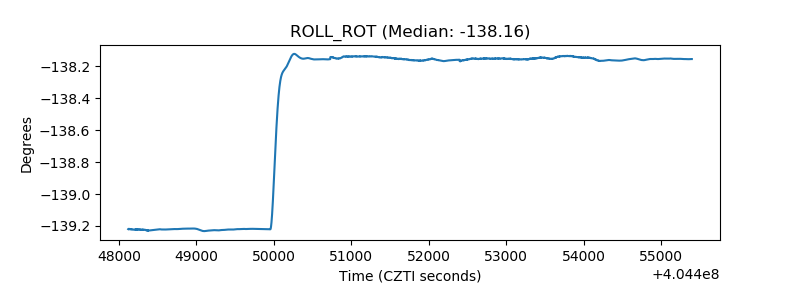 |
| _Roll_DEC | 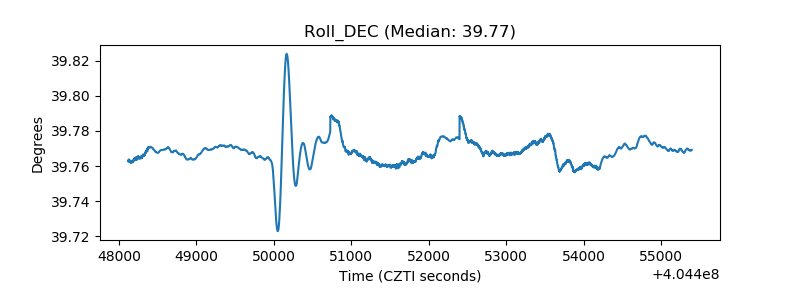 |
| _Roll_RA | 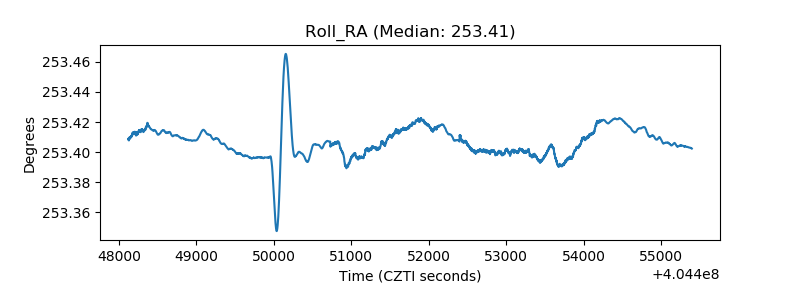 |
| Veto Counter | 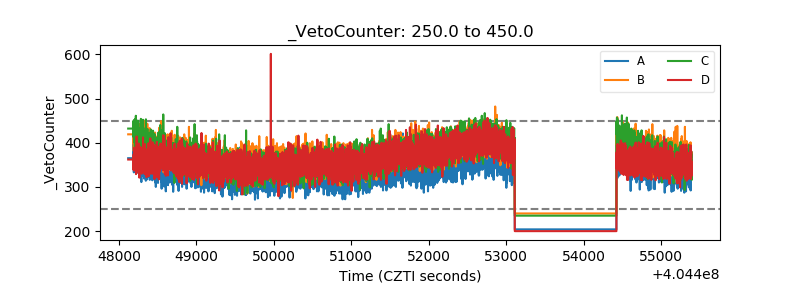 |