| Param | Original file | Final file |
|---|---|---|
| Filename | modeM0/AS1A07_145T01_9000005370_38265cztM0_level2.fits | modeM0/AS1A07_145T01_9000005370_38265cztM0_level2_quad_clean.evt |
| Size (bytes) | 413,824,320 | 99,820,800 |
| Size | 394.7 MB | 95.2 MB |
| Events in quadrant A | 3,381,695 | 667,023 |
| Events in quadrant B | 2,714,390 | 688,786 |
| Events in quadrant C | 3,030,386 | 650,387 |
| Events in quadrant D | 5,726,757 | 598,398 |
| Mode M9 | |||
|---|---|---|---|
| Quadrant | BADHDUFLAG | Total packets | Discarded packets |
| A | 0 | 27 | 0 |
| B | 0 | 27 | 0 |
| C | 0 | 27 | 0 |
| D | 0 | 27 | 0 |
| Mode SS | |||
|---|---|---|---|
| Quadrant | BADHDUFLAG | Total packets | Discarded packets |
| A | 0 | 122 | 0 |
| B | 0 | 122 | 0 |
| C | 0 | 122 | 0 |
| D | 0 | 122 | 0 |
| Mode M0 | |||
|---|---|---|---|
| Quadrant | BADHDUFLAG | Total packets | Discarded packets |
| A | 0 | 13705 | 3 |
| B | 0 | 12170 | 2 |
| C | 0 | 12730 | 2 |
| D | 0 | 21302 | 2 |
| Quadrant | Total seconds | Saturated seconds | Saturation percentage |
|---|---|---|---|
| A | 5989 | 58 | 0.968442% |
| B | 5989 | 10 | 0.166973% |
| C | 5989 | 45 | 0.751378% |
| D | 5989 | 179 | 2.988813% |
Noise dominated data is calculated using 1-second bins in cleaned event files. If a bin has >2000 counts, and if more than 50% of those come from <1% of pixels, then it is considered to be noise-dominated and hence unusable.
| Quadrant | # 1 sec bins | Bins with >0 counts | Bins with >2000 counts | High rate bins dominated by noise | Noise dominated (total time) | Noise dominated (detector-on time) | Marked lightcurve |
|---|---|---|---|---|---|---|---|
| A | 8586 | 5991 | 35 | 35 | 0.41% | 0.58% | 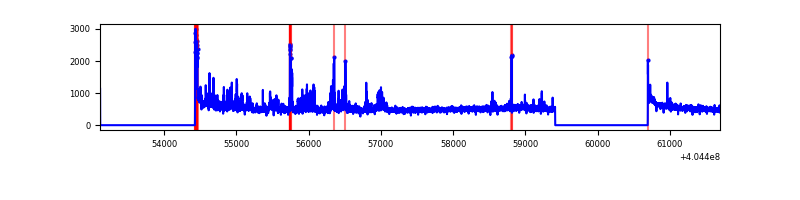 |
| B | 8586 | 5991 | 1 | 1 | 0.01% | 0.02% | 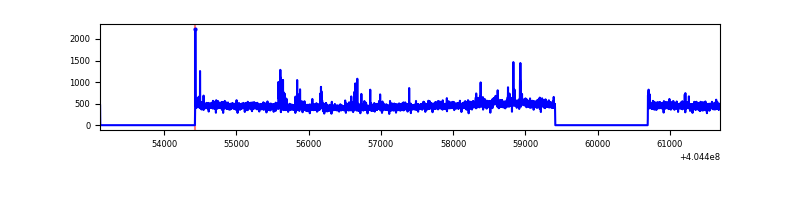 |
| C | 8586 | 5991 | 32 | 32 | 0.37% | 0.53% | 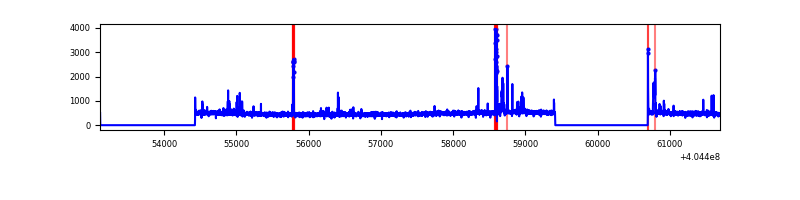 |
| D | 8586 | 5991 | 209 | 209 | 2.43% | 3.49% | 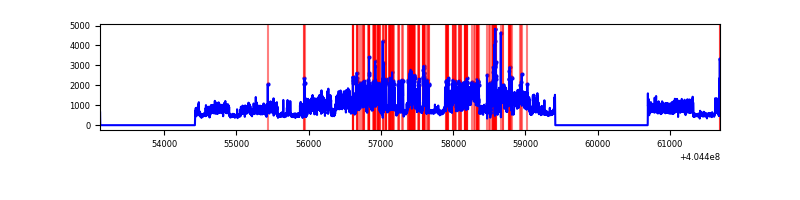 |
Top three noisy pixels from each quadrant. If the there are fewer than three noisy pixels in the level2.evt file, extra rows are filled as -1
| Pixel properties | Quadrant properties | ||||||
|---|---|---|---|---|---|---|---|
| Quadrant | DetID | PixID | Counts | Sigma | Mean | Median | Sigma |
| A | 10 | 83 | 401622 | 2966.99 | 666 | 651 | 135.1 |
| A | 12 | 16 | 280387 | 2069.91 | 666 | 651 | 135.1 |
| A | 12 | 194 | 45063 | 328.63 | 666 | 651 | 135.1 |
| B | 5 | 172 | 34994 | 264.29 | 665 | 645 | 130.0 |
| B | 4 | 141 | 22071 | 164.86 | 665 | 645 | 130.0 |
| B | 4 | 232 | 19206 | 142.81 | 665 | 645 | 130.0 |
| C | 15 | 214 | 252381 | 1655.82 | 648 | 650 | 152.0 |
| C | 14 | 254 | 177331 | 1162.16 | 648 | 650 | 152.0 |
| C | 12 | 249 | 25941 | 166.36 | 648 | 650 | 152.0 |
| D | 10 | 203 | 2661110 | 16799.97 | 644 | 627 | 158.4 |
| D | 12 | 235 | 270161 | 1702.01 | 644 | 627 | 158.4 |
| D | 13 | 249 | 95472 | 598.91 | 644 | 627 | 158.4 |
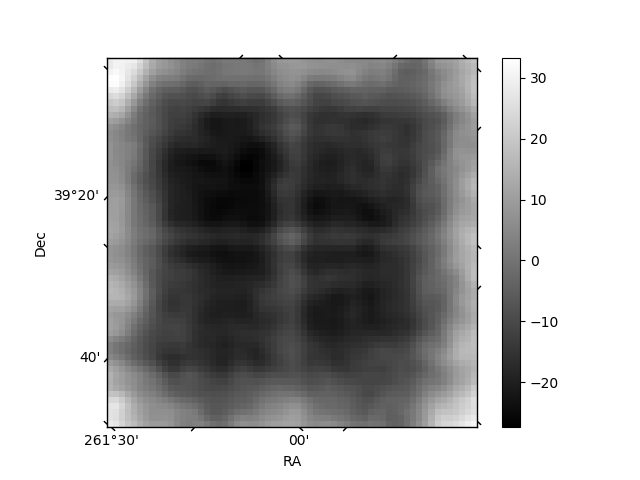
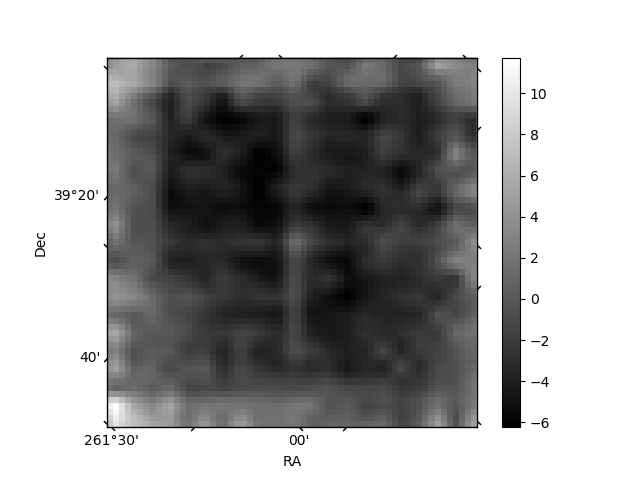
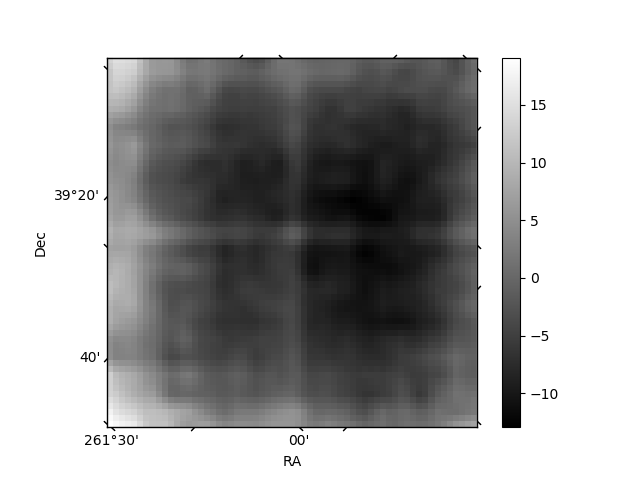
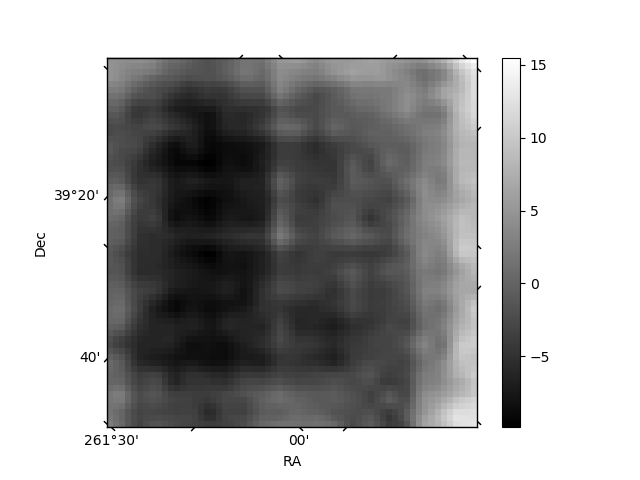
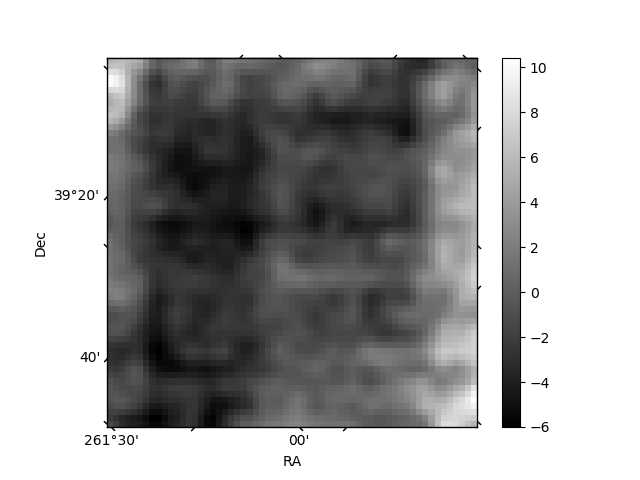
Histogram calculated using DETX and DETY for each event in the final _common_clean file
| Quadrant A | 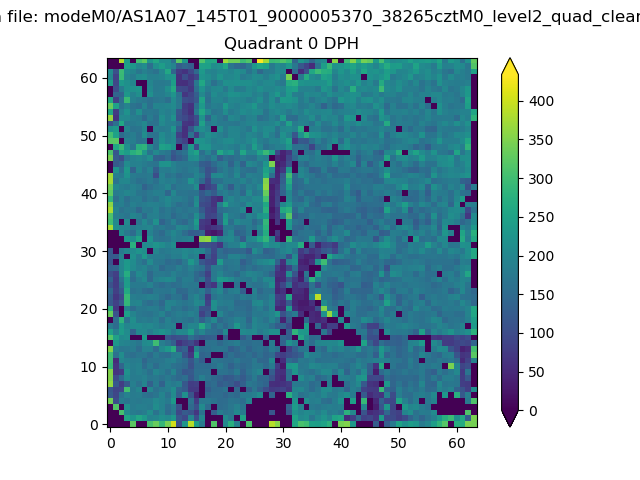 |
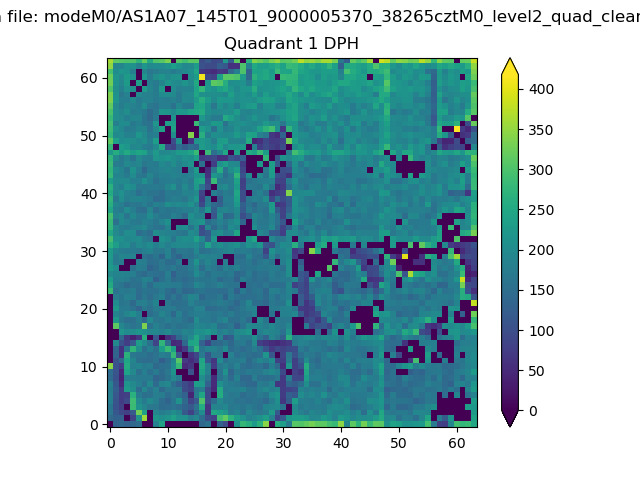 |
Quadrant B |
|---|---|---|---|
| Quadrant D | 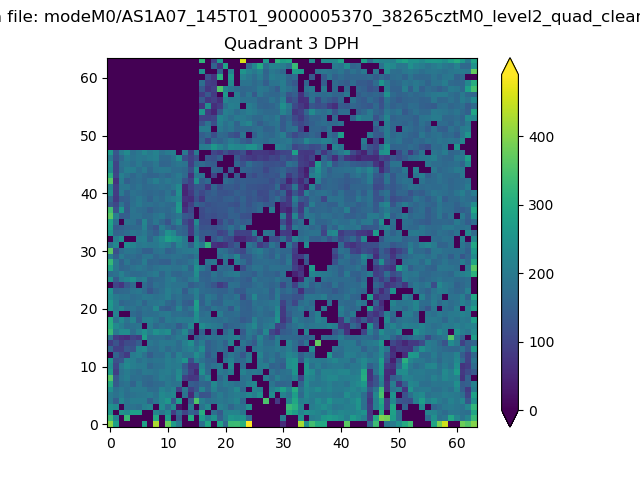 |
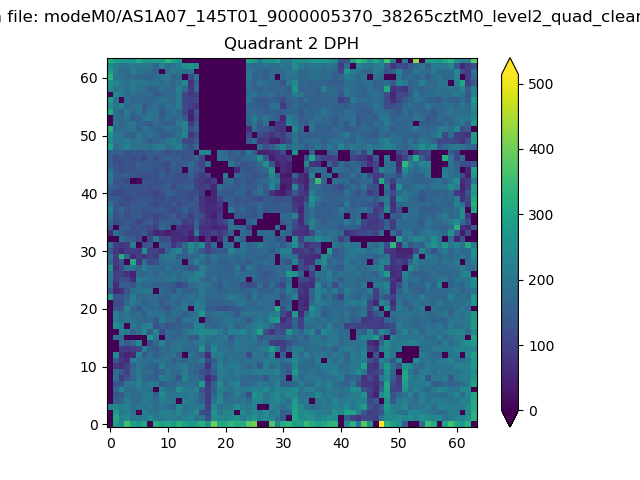 |
Quadrant C |
| Plot type | Count rate plots | Images |
|---|---|---|
| Comparison with Poisson distribution Blue bars denote a histogram of data divided into 1 sec bins. Red curve is a Poisson curve with rate = median count rate of data. |
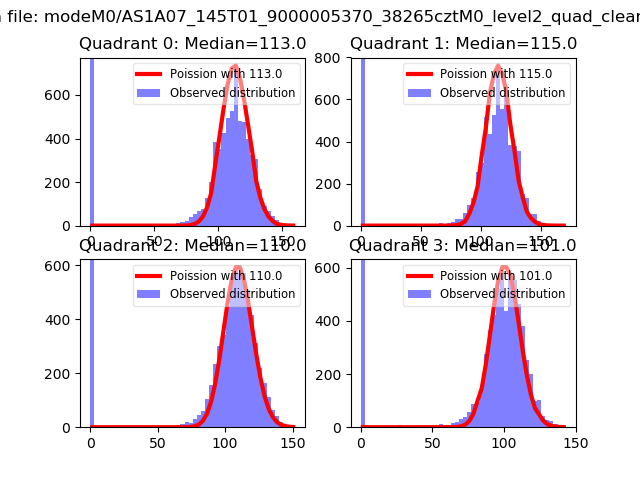 |
 |
| Quadrant-wise count rates Data is divided into 100 sec bins |
 |
|
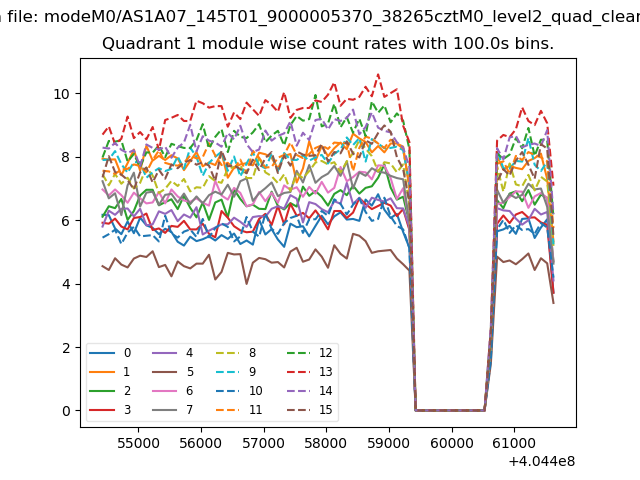
| Module-wise count rates for Quadrant A Data is divided into 100 sec bins |
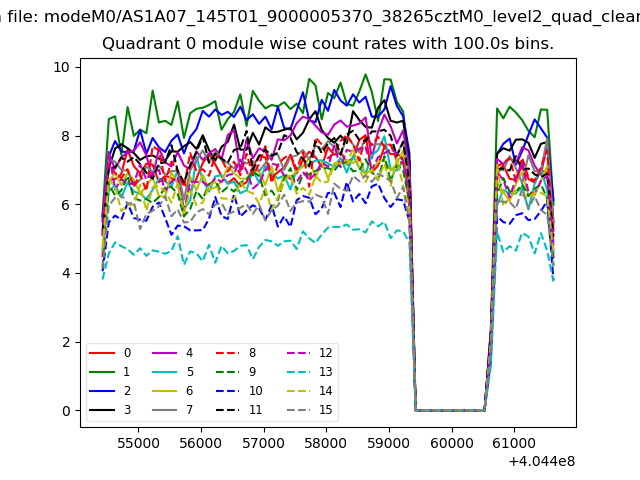 |
 |
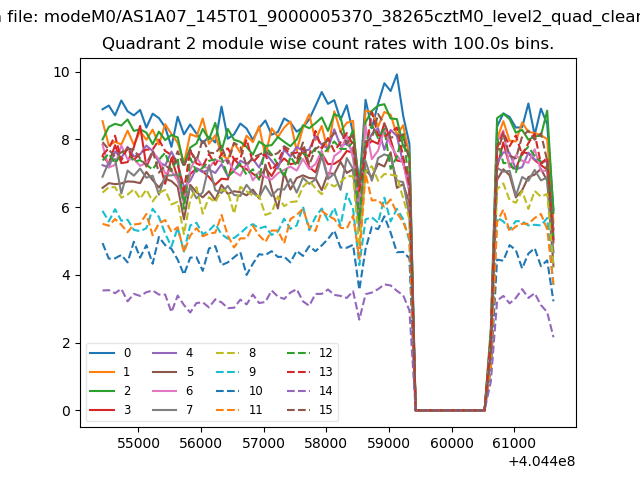
| Module-wise count rates for Quadrant B Data is divided into 100 sec bins |
 |
 |
| Module-wise count rates for Quadrant C Data is divided into 100 sec bins |
 |
 |
| Module-wise count rates for Quadrant D Data is divided into 100 sec bins |
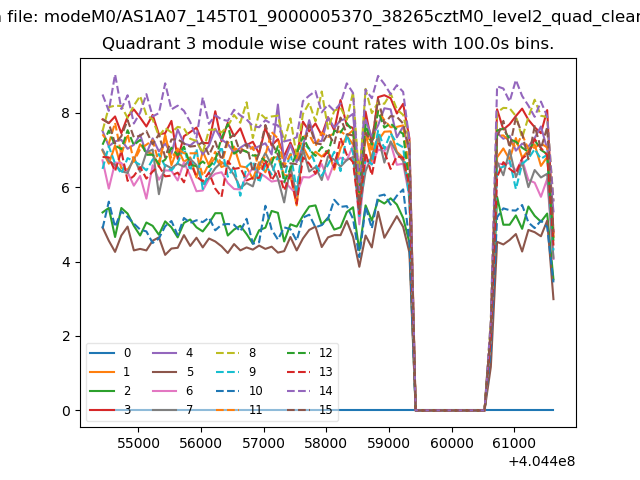 |
 |
| Parameter | Plot |
|---|---|
| CZT HV Monitor | 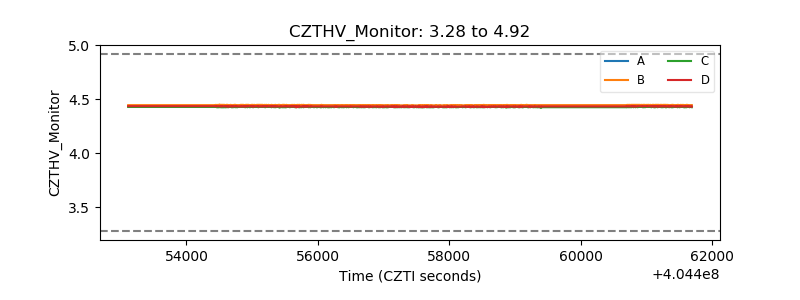 |
| D_VDD | 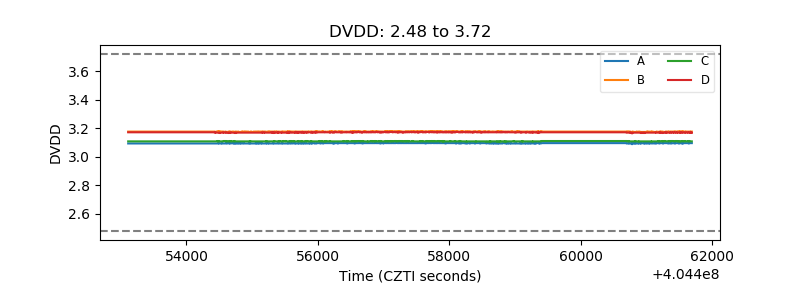 |
| Temperature 1 | 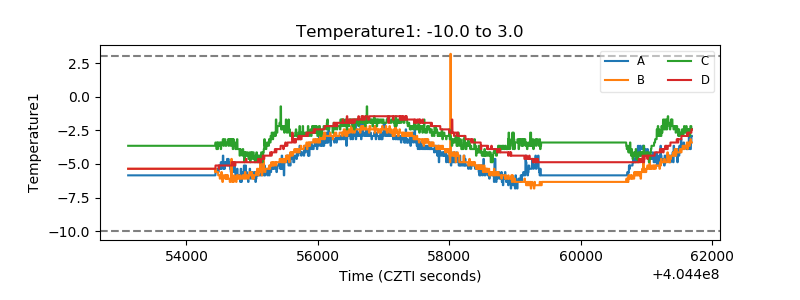 |
| Veto HV Monitor | 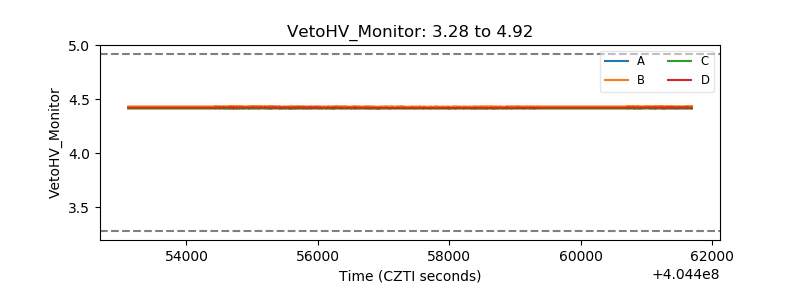 |
| Veto LLD | 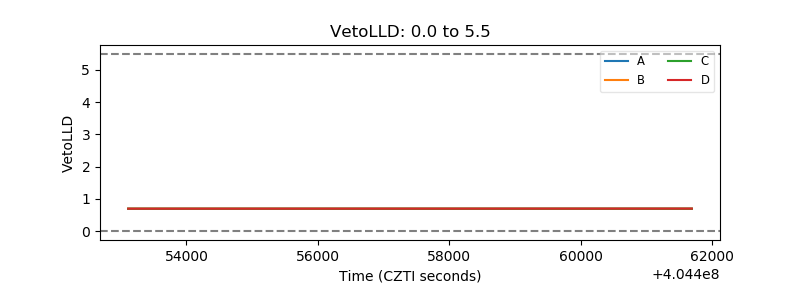 |
| Alpha Counter | 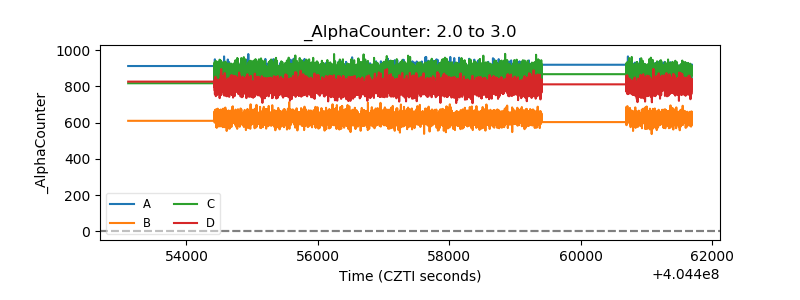 |
| _CPM_Rate | 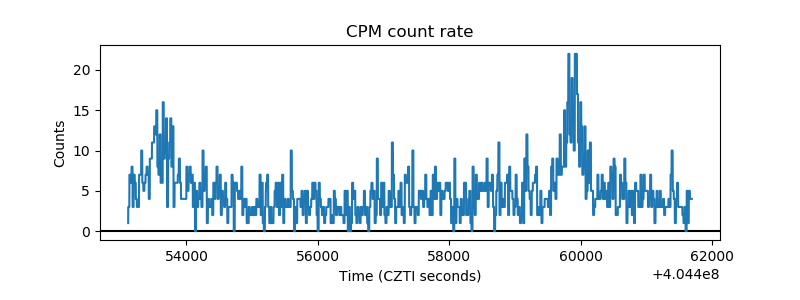 |
| CZT Counter | 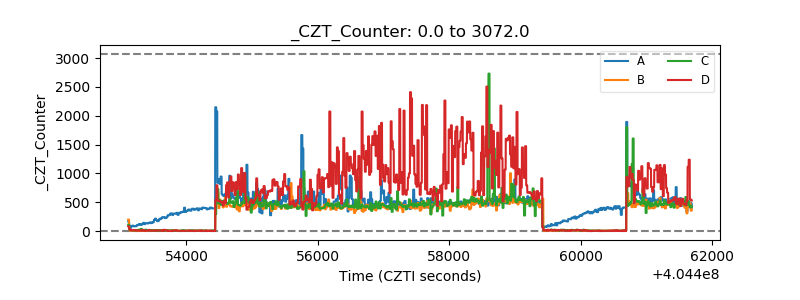 |
| +2.5 Volts monitor | 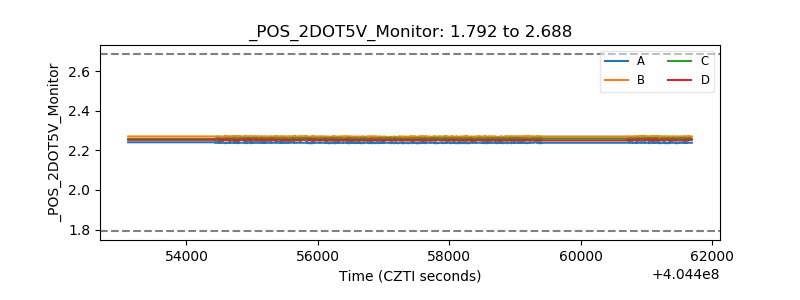 |
| +5 Volts monitor | 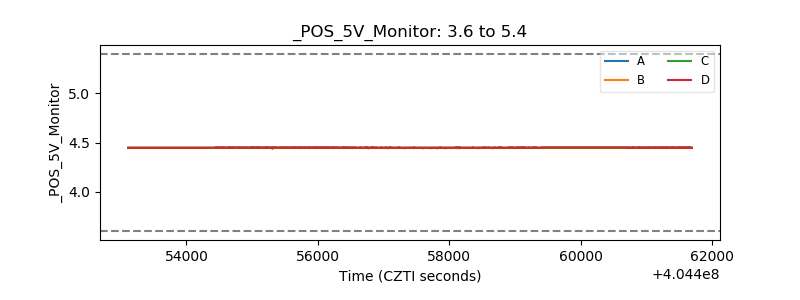 |
| _ROLL_ROT | 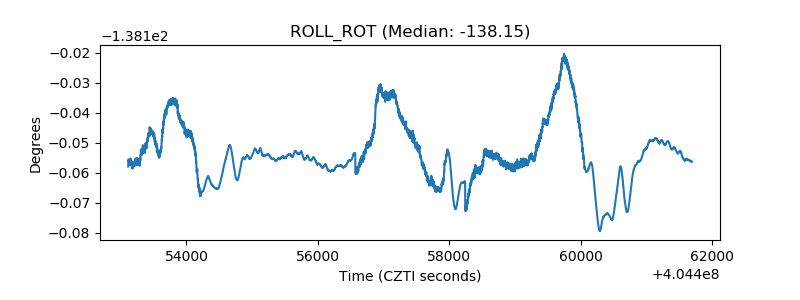 |
| _Roll_DEC | 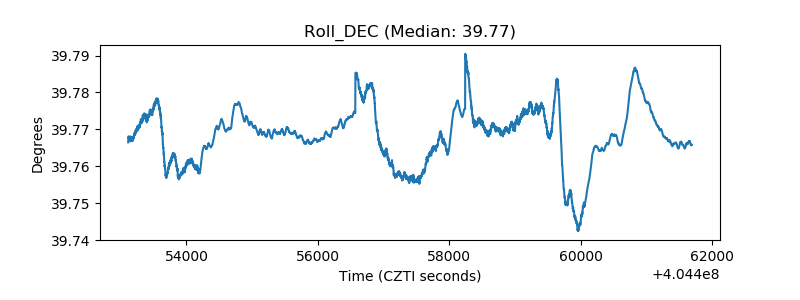 |
| _Roll_RA | 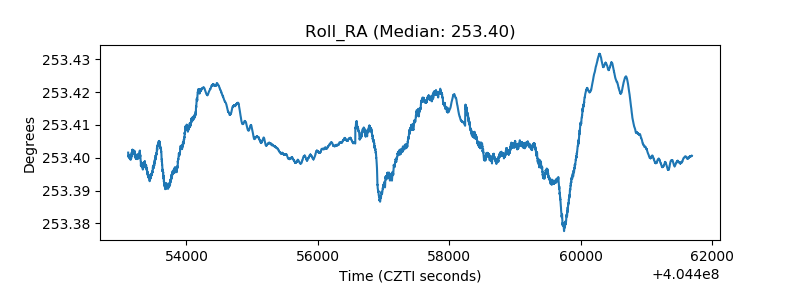 |
| Veto Counter | 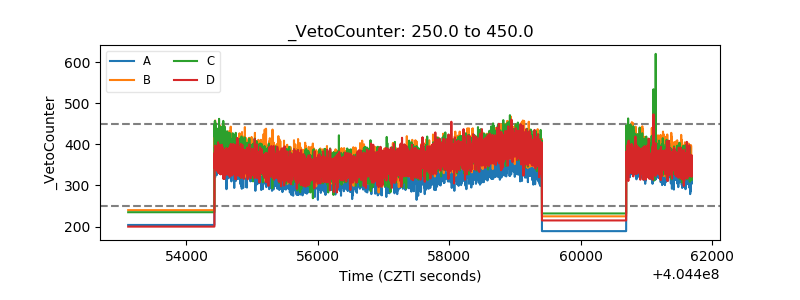 |